Analysis Summary
Notes:
- 1) No attempt has been made to eliminate the non-significant decimal places.
- 2) This batgrbproduct analysis is done using the HEASARC data.
- 3) This batgrbproduct analysis is using the flight position for the mask-weighting calculation.
======================================================================
                  BAT GRB EVENT DATA PROCESSING REPORT
    Process Script Ver: batgrbproduct v2.47
    Process Start Time: Mon May 18 14:24:43 EDT 2020
             Host Name: bat1
   Current Working Dir: /local/data/bat1/alien/Swift_3rdBATcatalog/event/batevent_reproc/trigger963260
======================================================================

  Trigger: 00963260      Segment: 000

  BAT Trigger Time: 606760772.608   [s; MET]
      Trigger Stop: 606760776.704   [s; MET]
               UTC: 2020-03-24T16:39:07.954400    [includes UTCF correction]
       Where From?: TDRSS position message

  BAT
    RA: 222.685467928864   Dec: 35.9684973487692  [deg; J2000]

     Catalogged Source?: NO
     Point Source?:      YES
     GRB Indicated?:     YES    [ by BAT flight software ]
     Image S/N Ratio:    9.81
     Image Trigger?:     NO
     Rate S/N Ratio:     9.8488578017961  [ if not an image trigger ]
     Image S/N Ratio:    9.81

  Analysis Position:   [ source = BAT ]
    RA: 222.685467928864   Dec: 35.9684973487692  [deg; J2000]

  Refined Position:   [ source = BAT pre-slew burst ]
    RA: 222.661127600395   Dec: 35.9222331826329  [deg; J2000]
        { 14h 50m 38.7s , +35d 55' 20.0" }
         +/- 1.44877700451342 [arcmin] (estimated 90% radius based on SNR)
         +/- 0.619200117063945 [arcmin] (formal 1-sigma fit error)
    SNR: 17.9108490670039

  Angular difference between the analysis and refined position is 3.017156 arcmin

  Partial Coding Fraction: 1    [ including projection effects ]

  Duration
     T90: N/A
        Measured from: N/A
                   to: N/A     [s; relative to TRIGTIME]
     T50: N/A
        Measured from: N/A
                   to: N/A     [s; relative to TRIGTIME]


  Fluence
     Peak Flux  (peak 1 second)
        Measured from: N/A
                   to: N/A     [s; relative to TRIGTIME]
     Total Fluence
        Measured from: N/A
                   to: N/A     [s; relative to TRIGTIME]

======================================================================


====== Spectral Analysis Summary =====================================

Model      : spectral model: simple power-law (PL) and cutoff power-law (CPL)
Ph_index   : photon index: E^{Ph_index}
Ph_90err   : 90% error of the photon index
Epeak      : Epeak in keV
Epeak_90err: 90% error of Epeak
Norm       : normalization at 50 keV in both the PL model and CPL model
Nomr_90err : 90% error of the normalization
chi2       : Chi-Squared
dof        : degree of freedo

=== Time-averaged spectral analysis ===
(Best model with acceptable fit: PL)

Model Ph_index Ph_90err_low Ph_90err_hi  Epeak  Epeak_90err_low  Epeak_90err_hi  Norm       Nomr_90err_low    Norm_90err_hi    chi2    dof
PL      -1.683    -0.152      0.148       -           -               -         1.78e-03     -1.67e-04          1.65e-04      65.440   57
CPL     -1.222    -0.523      0.636       76.831     -23.306       -76.831      3.17e-03     -1.48e-03          3.77e-03      63.430   56


=== 1-s peak spectral analysis ===
(Best model with acceptable fit: N/A)

Model Ph_index Ph_90err_low Ph_90err_hi  Epeak  Epeak_90err_low  Epeak_90err_hi  Norm       Nomr_90err_low    Norm_90err_hi    chi2    dof
PL      N/A         N/A       N/A          -           -               -           N/A           N/A               N/A         N/A        N/A
CPL     N/A         N/A       N/A          N/A         N/A           N/A           N/A           N/A               N/A         N/A        N/A


=== Fluence/Peak Flux Summary ===

              Model    Band1     Band2     Band3     Band4     Band5     Total
                       15-25     25-50    50-100    100-350    15-150    15-350    keV
Fluence         PL   3.74e-07  6.14e-07  7.65e-07  1.89e-06  2.28e-06  3.64e-06   erg/cm2
      90%_error_low -4.78e-08 -5.16e-08 -9.65e-08 -4.47e-07 -2.26e-07 -5.46e-07   erg/cm2
      90%_error_hi   4.91e-08  5.16e-08  9.69e-08  5.33e-07  2.29e-07  6.14e-07   erg/cm2
Peak flux       PL     N/A      N/A      N/A      N/A      N/A      N/A     ph/cm2/s
Image
Pre-slew 15.0-350.0 keV image (Event data)
#   RAcent    DECcent   POSerr    Theta     Phi              Peak Cts       SNR   Name
  222.6611    35.9222   0.0107    18.7171     8.9846         3.3626199     17.911 TRIG_00963260

Foreground time interval of the image:
-106.932  29.293 (delta_t = 136.225 [sec])
Background time interval of the image:
-239.608 -106.932 (delta_t = 132.676 [sec])
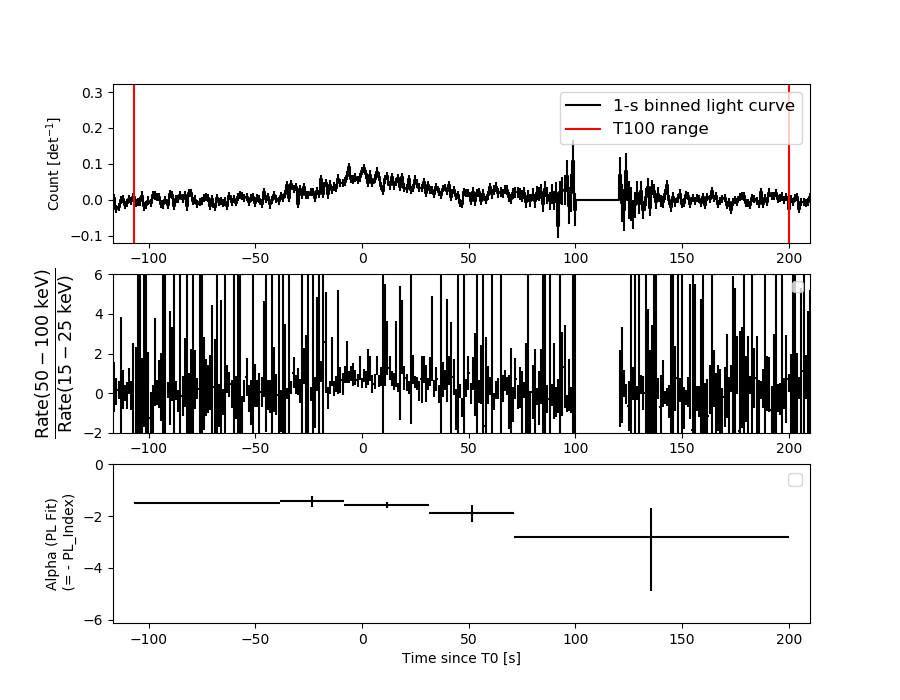
Light Curves
Note: The mask-weighted lightcurves have units of either count/det or counts/sec/det, where a det is 0.4 x 0.4 = 0.16 sq cm.
Full-time range; 1 s binning
Other quick-look light curves:
- 64 ms binning (zoomed)
- 16 ms binning (zoomed)
- 8 ms binning (zoomed)
- 2 ms binning (zoomed)
- SN=5 or 10 s binning (full-time range)
- Raw light curve
Spectra
- 64 ms binning (zoomed)
- 16 ms binning (zoomed)
- 8 ms binning (zoomed)
- 2 ms binning (zoomed)
- SN=5 or 10 s binning (full-time range)
- Raw light curve
Spectra
Notes:
- 1) The fitting includes the systematic errors.
- 2) When the burst includes telescope slew time periods, the fitting uses an average response file made from multiple 5-s response files through out the slew time plus single time preiod for the non-slew times, and weighted by the total counts in the corresponding time period using addrmf. An average response file is needed becuase a spectral fit using the pre-slew DRM will introduce some errors in both a spectral shape and a normalization if the PHA file contains a lot of the slew/post-slew time interval.
- 3) For fits to more complicated models (e.g. a power-law over a cutoff power-law), the BAT team has decided to require a chi-square improvement of more than 6 for each extra dof.
Time averaged spectrum fit using the average DRM
Power-law model

Time interval is from  -38.100 sec. to  100.400 sec.
XSPEC12>exit
 XSPEC: quit


Photon index: -1.68347     ( -0.151546   0.148058 )
------------------------------------------------------------
Parameters  : value       lower 90%   higher 90%
Photon index: 1.68347     ( -0.148058   0.151546 )
Norm@50keV  : 1.77901E-03    ( -0.000167124   0.000165005 )
------------------------------------------------------------

Photon flux (15-150 keV)    in 138.5 sec: 0.234934 ( -0.019779  0.019786 ) ph/cm2/s
Energy fluence (15-150 keV)             : 2.28475e-06 ( -2.25687e-07  2.29043e-07 ) ergs/cm2
Cutoff power-law model

Time interval is from  -38.100 sec. to  100.400 sec.
 XSPEC: quit


Photon index: -1.22238     ( -0.523495   0.635797 )
------------------------------------------------------------
Parameters  : value       lower 90%   higher 90%
Photon index: 1.22238     ( -0.635797   0.523495 )
Epeak [keV] : 76.8310      ( -23.3059 -76.831 )
Norm@50keV  : 3.17194E-03    ( -0.00147528   0.00376662 )
------------------------------------------------------------

Photon flux (15-150 keV)    in 138.5 sec: 0.230464 ( -0.020503  0.020486 ) ph/cm2/s
Energy fluence (15-150 keV)             : 2.18398e-06 ( -2.53213e-07  2.5765e-07 ) ergs/cm2
1-s peak spectrum fit
1-s peak spectrum unavailable, likely because there are no event data in the 1-s peak range.
Time-resolved spectra
Distribution
T90 vs. Hardness ratio plot
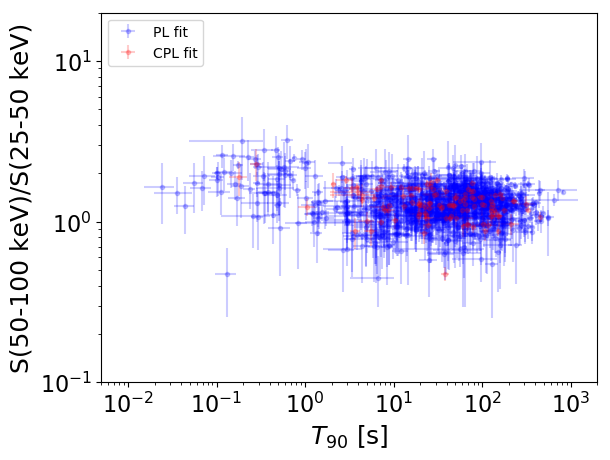
T90                                   = N/A sec.
Hardness ratio (energy fluence ratio) = N/A
S(15-50 keV) vs. S(50-150 keV) plot
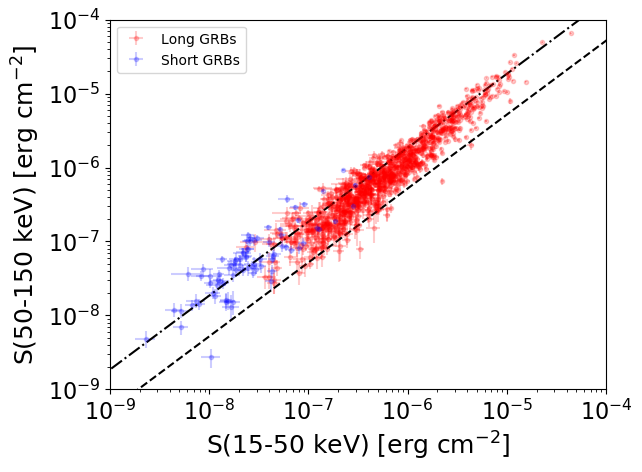
S(15-50 keV)  = N/A
S(50-150 keV) = N/A
The dash-dotted line and the dashed line traces the fluences calculated from the Band function with Epeak = 15 and 150 keV, respectively. Both lines assume a canonical values of alpha = -1 and beta = -2.5.
Mask shadow pattern
IMX = 3.346575364159042E-01, IMY = -5.291261654185283E-02
Spacecraft aspect plot
Bright source in the pre-burst/pre-slew/post-slew images
Pre-burst image of 15-350 keV band
Time interval of the image:
-239.608000 -106.932000

# RAcent  DECcent POSerr Theta    Phi  PeakCts   SNR AngSep     Name
#  [deg]    [deg]    ['] [deg]  [deg]                   [']
254.4007  35.3244  507.0  40.0  -22.7   0.0052   0.0    3.0	Her X-1
188.9898  22.9956    2.3  26.5   98.3   1.1778   5.1 ------	UNKNOWN
246.4699  16.3029    2.8  47.5    4.8   1.2779   4.1 ------	UNKNOWN
273.5907  26.9259    3.0  58.1  -27.0   4.1801   3.8 ------	UNKNOWN
276.2768  58.5841    3.9  43.6  -64.0   1.9422   3.0 ------	UNKNOWN
 97.8679  75.7708    3.1  48.1 -129.2   2.7071   3.8 ------	UNKNOWN
Pre-slew background subtracted image of 15-350 keV band
Time interval of the image:
-106.932000 29.292600

# RAcent  DECcent POSerr Theta    Phi  PeakCts   SNR AngSep     Name
#  [deg]    [deg]    ['] [deg]  [deg]                   [']
254.5908  35.2433    8.4  40.2  -22.7   0.3886   1.4    8.8	Her X-1
225.3237  20.3646    1.8  32.6   26.9   1.5912   6.4 ------	UNKNOWN
222.6609  35.9220    0.6  18.7    9.0   3.3623  17.9 ------	UNKNOWN
202.2278  61.9055    2.0  14.8 -111.0   1.0610   5.7 ------	UNKNOWN
121.2968  70.7958    2.0  43.4 -138.7   2.2958   5.9 ------	UNKNOWN
276.6746  49.6506    2.1  47.3  -52.5   4.5542   5.4 ------	UNKNOWN
Post-slew image of 15-350 keV band
Time interval of the image:
101.892600 114.292650

# RAcent  DECcent POSerr Theta    Phi  PeakCts   SNR AngSep     Name
#  [deg]    [deg]    ['] [deg]  [deg]                   [']
254.6745  35.2890    6.1  25.9   46.5  -0.0953  -1.9   11.1	Her X-1
288.6944  10.9596   27.5  46.9  -13.5   0.0316   0.4    6.2	GRS 1915+105
299.7585  35.1673    3.1  26.9  -42.9   0.1739   3.7    8.5	Cyg X-1
308.0904  40.8204    3.8  26.1  -62.3   0.1712   3.1    8.0	Cyg X-3
326.1362  38.2343    4.3  37.5  -78.5  -0.2881  -2.7    5.5	Cyg X-2
264.1605   3.2652    2.1  54.4   18.3   1.2308   5.6 ------	UNKNOWN
272.7779  85.1043    1.8  28.3 -177.0   0.2735   6.3 ------	UNKNOWN
296.4204  11.4852    2.1  48.0  -23.7   0.4922   5.5 ------	UNKNOWN