Analysis Summary
Notes:
- 1) No attempt has been made to eliminate the non-significant decimal places.
- 2) This batgrbproduct analysis is done using the HEASARC data.
- 3) This batgrbproduct analysis is using the flight position for the mask-weighting calculation.
======================================================================
                  BAT GRB EVENT DATA PROCESSING REPORT
    Process Script Ver: batgrbproduct v2.48
    Process Start Time: Wed May  5 19:42:54 EDT 2021
             Host Name: batproc1
   Current Working Dir: /local/data/bat1/alien/Swift_3rdBATcatalog/event/batevent_reproc/trigger965484
======================================================================

  Trigger: 00965484      Segment: 000

  BAT Trigger Time: 608095224.512   [s; MET]
      Trigger Stop: 608095225.024   [s; MET]
               UTC: 2020-04-09T03:19:59.771640    [includes UTCF correction]
       Where From?: TDRSS position message

  BAT
    RA: 60.5532477609483   Dec: -50.2471522412378  [deg; J2000]

     Catalogged Source?: NO
     Point Source?:      YES
     GRB Indicated?:     YES    [ by BAT flight software ]
     Image S/N Ratio:    7.58
     Image Trigger?:     NO
     Rate S/N Ratio:     16.5529453572468  [ if not an image trigger ]
     Image S/N Ratio:    7.58

  Analysis Position:   [ source = BAT ]
    RA: 60.5532477609483   Dec: -50.2471522412378  [deg; J2000]

  Refined Position:   [ source = BAT pre-slew burst ]
    RA: 60.5556190927451   Dec: -50.2445568117243  [deg; J2000]
        { 04h 02m 13.3s , -50d 14' 40.4" }
         +/- 2.70147822511752 [arcmin] (estimated 90% radius based on SNR)
         +/- 1.4720638777668 [arcmin] (formal 1-sigma fit error)
    SNR: 7.35435939918652

  Angular difference between the analysis and refined position is 0.180359 arcmin

  Partial Coding Fraction: 0.75    [ including projection effects ]

  Duration
     T90: 16 +/- 5.09901951359278
        Measured from: -0.51199996471405
                   to: 15.4880000352859     [s; relative to TRIGTIME]
     T50: 11 +/- 4.47213595499958
        Measured from: 0.48800003528595
                   to: 11.4880000352859     [s; relative to TRIGTIME]


  Fluence
     Peak Flux  (peak 1 second)
        Measured from: -0.51199996471405
                   to: 0.48800003528595     [s; relative to TRIGTIME]
     Total Fluence
        Measured from: -0.51199996471405
                   to: 19.4880000352859     [s; relative to TRIGTIME]

             Band 1     Band 2     Band 3     Band 4
              15-25      25-50     50-100    100-350     keV
 Total     0.216216   0.156777   0.065924   0.041416
           0.033338   0.034306   0.029816   0.026578 [error]
 Peak      0.024779   0.030568   0.027011   0.006423
           0.008131   0.008393   0.007516   0.006116 [error]

     [ fluence units of on-axis counts / fully illuminated detector ]

======================================================================


====== Table of the duration information =============================

        Value   tstart    tstop
T100   20.000   -0.512   19.488
T90    16.000   -0.512   15.488
T50    11.000    0.488   11.488
Peak    1.000   -0.512    0.488


====== Spectral Analysis Summary =====================================

Model      : spectral model: simple power-law (PL) and cutoff power-law (CPL)
Ph_index   : photon index: E^{Ph_index}
Ph_90err   : 90% error of the photon index
Epeak      : Epeak in keV
Epeak_90err: 90% error of Epeak
Norm       : normalization at 50 keV in both the PL model and CPL model
Nomr_90err : 90% error of the normalization
chi2       : Chi-Squared
dof        : degree of freedo

=== Time-averaged spectral analysis ===
(Best model with acceptable fit: PL)

Model Ph_index Ph_90err_low Ph_90err_hi  Epeak  Epeak_90err_low  Epeak_90err_hi  Norm       Nomr_90err_low    Norm_90err_hi    chi2    dof
PL      -2.117    -0.482      0.418       -           -               -         1.24e-03     -3.98e-04          3.78e-04      43.650   57
CPL     -2.183    -0.636      0.891       78.821      N/A           N/A         1.06e-03        N/A               N/A         43.370   56


=== 1-s peak spectral analysis ===
(Best model with acceptable fit: PL)

Model Ph_index Ph_90err_low Ph_90err_hi  Epeak  Epeak_90err_low  Epeak_90err_hi  Norm       Nomr_90err_low    Norm_90err_hi    chi2    dof
PL      -1.482     -0.446     0.431       -           -               -         5.75e-03     -1.61e-03          1.58e-03      44.770   57
CPL     -0.265     -1.518     2.681       68.797     -23.680       -68.797      2.47e-02     -2.47e-02          5.22e-01      43.360   56


=== Fluence/Peak Flux Summary ===

              Model    Band1     Band2     Band3     Band4     Band5     Total
                       15-25     25-50    50-100    100-350    15-150    15-350    keV
Fluence         PL   5.67e-08  7.17e-08  6.61e-08  1.07e-07  2.31e-07  3.01e-07   erg/cm2
      90%_error_low -1.51e-08 -1.62e-08 -2.73e-08 -6.62e-08 -6.22e-08 -1.06e-07   erg/cm2
      90%_error_hi   1.52e-08  1.55e-08  3.00e-08  1.19e-07  6.67e-08  1.48e-07   erg/cm2
Peak flux       PL   2.33e-01  2.37e-01  1.69e-01  1.93e-01  7.15e-01  8.32e-01   ph/cm2/s
      90%_error_low -9.32e-02 -6.64e-02 -5.78e-02 -1.04e-01 -1.92e-01 -2.27e-01   ph/cm2/s
      90%_error_hi   1.04e-01  6.56e-02  5.75e-02  1.57e-01  1.92e-01  2.31e-01   ph/cm2/s

Fluence        CPL   5.32e-08  5.61e-08  4.57e-08  5.07e-08  1.82e-07  3.02e-07   erg/cm2
      90%_error_low -1.73e-08 -3.44e-08 -3.86e-08 -4.67e-08 -1.11e-07 -2.26e-07   erg/cm2
      90%_error_hi   1.69e-08  2.87e-08  4.15e-08  1.72e-07  1.83e-07  1.20e-07   erg/cm2
Peak flux      CPL   1.92e-01  2.68e-01  1.83e-01  6.05e-02  6.88e-01  7.03e-01   ph/cm2/s
      90%_error_low -1.11e-01 -8.08e-02 -7.08e-02 -6.05e-02 -1.96e-01 -2.08e-01   ph/cm2/s
      90%_error_hi   1.19e-01  8.72e-02  7.12e-02  1.89e-01  1.96e-01  2.79e-01   ph/cm2/s

======================================================================
Image
Pre-slew 15.0-350.0 keV image (Event data)
#   RAcent    DECcent   POSerr    Theta     Phi              Peak Cts       SNR   Name
   60.5556   -50.2446   0.0263    19.5270   -69.3260         0.4516108      7.354 TRIG_00965484

Foreground time interval of the image:
 -0.512  16.789 (delta_t =  17.301 [sec])
Background time interval of the image:
-239.512  -0.512 (delta_t = 239.000 [sec])
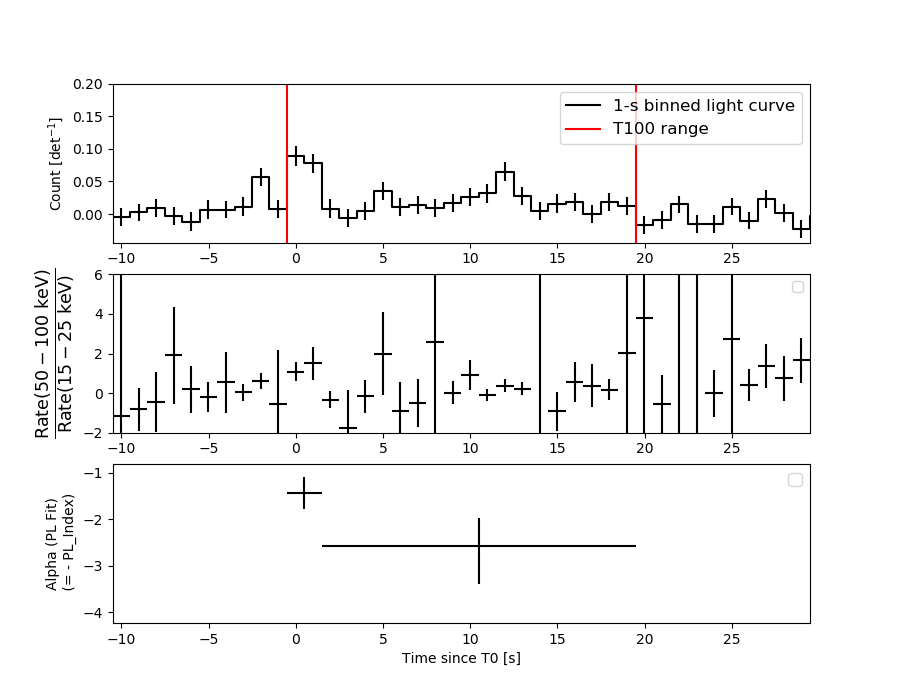
Light Curves
Note: The mask-weighted lightcurves have units of either count/det or counts/sec/det, where a det is 0.4 x 0.4 = 0.16 sq cm.
Full-time range; 1 s binning
Other quick-look light curves:
- 64 ms binning (zoomed)
- 16 ms binning (zoomed)
- 8 ms binning (zoomed)
- 2 ms binning (zoomed)
- SN=5 or 10 s binning (full-time range)
- Raw light curve
Spectra
- 64 ms binning (zoomed)
- 16 ms binning (zoomed)
- 8 ms binning (zoomed)
- 2 ms binning (zoomed)
- SN=5 or 10 s binning (full-time range)
- Raw light curve
Spectra
Notes:
- 1) The fitting includes the systematic errors.
- 2) When the burst includes telescope slew time periods, the fitting uses an average response file made from multiple 5-s response files through out the slew time plus single time preiod for the non-slew times, and weighted by the total counts in the corresponding time period using addrmf. An average response file is needed becuase a spectral fit using the pre-slew DRM will introduce some errors in both a spectral shape and a normalization if the PHA file contains a lot of the slew/post-slew time interval.
- 3) For fits to more complicated models (e.g. a power-law over a cutoff power-law), the BAT team has decided to require a chi-square improvement of more than 6 for each extra dof.
Time averaged spectrum fit using the average DRM
Power-law model
Time interval is from   -0.512 sec. to   19.488 sec.

Spectral model in power-law:
------------------------------------------------------------
Parameters  : value       lower 90%   higher 90%
Photon index: -2.11733     ( -0.481696   0.418263 )
Norm@50keV  : 1.23946E-03    ( -0.000397747   0.000378088 )
------------------------------------------------------------
#Fit statistic  : Chi-Squared                   43.65     using 59 bins.
 Reduced chi-squared = 0.765789
# Null hypothesis probability of 9.03e-01 with 57 degrees of freedom

Photon flux (15-150 keV)    in 20 sec: 0.196701 ( -0.039995  0.040024 ) ph/cm2/s
Energy fluence (15-150 keV)             : 2.30766e-07 ( -6.22156e-08  6.6695e-08 ) ergs/cm2
Cutoff power-law model
Time interval is from   -0.512 sec. to   19.488 sec.
Spectral model in the cutoff power-law:
------------------------------------------------------------
Parameters  : value       lower 90%   higher 90%
Photon index: -2.57162     ( -0.244805   1.282 )
Epeak [keV] : 198.699      (   )
Norm@50keV  : 7.10627E-04    (     )
------------------------------------------------------------
#Fit statistic  : Chi-Squared                   42.81     using 59 bins.
 Reduced chi-squared = 0.764464
# Null hypothesis probability of 9.03e-01 with 56 degrees of freedom

Photon flux (15-150 keV)    in 20 sec: 0.156090 ( -0.0565071  0.074096 ) ph/cm2/s
Energy fluence (15-150 keV)             : 1.82448e-07 ( -1.10558e-07  1.82776e-07 ) ergs/cm2
1-s peak spectrum fit
Power-law model
Time interval is from   -0.512 sec. to    0.488 sec.

Spectral model in power-law:
------------------------------------------------------------
Parameters  : value       lower 90%   higher 90%
Photon index: -1.48238     ( -0.445604   0.431521 )
Norm@50keV  : 5.75025E-03    ( -0.00160642   0.00158344 )
------------------------------------------------------------
#Fit statistic  : Chi-Squared                   44.77     using 59 bins.
 Reduced chi-squared = 0.785439
# Null hypothesis probability of 8.80e-01 with 57 degrees of freedom

Photon flux (15-150 keV)    in 1 sec: 0.714538 ( -0.191964  0.19232 ) ph/cm2/s
Energy fluence (15-150 keV)             : 5.47142e-08 ( -1.63603e-08  1.68556e-08 ) ergs/cm2
Cutoff power-law model
Time interval is from   -0.512 sec. to    0.488 sec.
Spectral model in the cutoff power-law:
------------------------------------------------------------
Parameters  : value       lower 90%   higher 90%
Photon index: -0.265333     ( -1.51817   2.68119 )
Epeak [keV] : 68.7967      ( -23.6805 -68.7967 )
Norm@50keV  : 2.47084E-02    ( -0.0247084   0.52205 )
------------------------------------------------------------
#Fit statistic  : Chi-Squared                   43.36     using 59 bins.
 Reduced chi-squared = 0.774286
# Null hypothesis probability of 8.91e-01 with 56 degrees of freedom

Photon flux (15-150 keV)    in 1 sec: 0.687666 ( -0.196083  0.19642 ) ph/cm2/s
Energy fluence (15-150 keV)             : 5.03002e-08 ( -1.66095e-08  1.80359e-08 ) ergs/cm2
Time-resolved spectra
Distribution
T90 vs. Hardness ratio plot
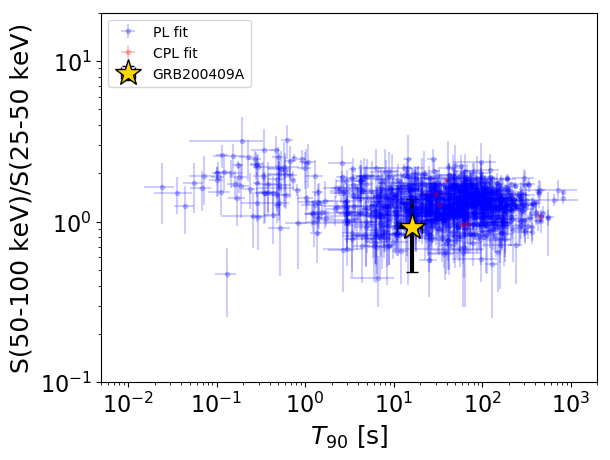
T90                                   = 16.0 sec.
Hardness ratio (energy fluence ratio) = 0.92191309092
S(15-50 keV) vs. S(50-150 keV) plot
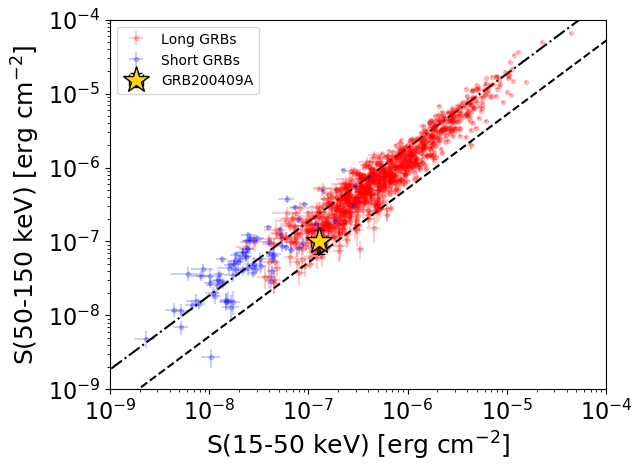
S(15-50 keV)  = 1.2841088e-07
S(50-150 keV) = 1.0235116e-07
The dash-dotted line and the dashed line traces the fluences calculated from the Band function with Epeak = 15 and 150 keV, respectively. Both lines assume a canonical values of alpha = -1 and beta = -2.5.
Mask shadow pattern
IMX = 1.252090946347269E-01, IMY = 3.318117338568732E-01
Spacecraft aspect plot
Bright source in the pre-burst/pre-slew/post-slew images
Pre-burst image of 15-350 keV band
Time interval of the image:
-239.512000 -0.512000

# RAcent  DECcent POSerr Theta    Phi  PeakCts   SNR AngSep     Name
#  [deg]    [deg]    ['] [deg]  [deg]                   [']
135.5369 -40.5455    1.6  39.0   51.3   4.3505   7.2    0.7	Vela X-1
170.3296 -60.4467   10.5  36.5   99.6  -0.6844  -1.1   10.6	Cen X-3
186.8066 -62.8850    6.3  39.7  111.9   1.6613   1.8    8.0	GX 301-2
151.9471 -66.4892    2.6  26.4   98.3   1.6877   4.4 ------	UNKNOWN
 93.6940  -9.3473    2.7  57.6  -11.0   4.9364   4.2 ------	UNKNOWN
Pre-slew background subtracted image of 15-350 keV band
Time interval of the image:
-0.512000 16.788590

# RAcent  DECcent POSerr Theta    Phi  PeakCts   SNR AngSep     Name
#  [deg]    [deg]    ['] [deg]  [deg]                   [']
135.5210 -40.6905    5.8  38.9   51.4   0.2494   2.0    8.2	Vela X-1
170.4362 -60.6734    8.1  36.4  100.0   0.1840   1.4    4.7	Cen X-3
186.9356 -62.7399    7.8  39.8  111.8   0.2840   1.5    7.9	GX 301-2
178.4574 -57.8453    2.6  41.2  102.1   1.0220   4.4 ------	UNKNOWN
 94.5950 -27.8991    3.1  39.2   -7.0   0.2639   3.7 ------	UNKNOWN
 60.5557 -50.2446    1.6  19.5  -69.3   0.4491   7.3 ------	UNKNOWN
Post-slew image of 15-350 keV band
Time interval of the image:
57.788590 898.988600

# RAcent  DECcent POSerr Theta    Phi  PeakCts   SNR AngSep     Name
#  [deg]    [deg]    ['] [deg]  [deg]                   [']
309.0769 -62.7506    3.9  54.8  167.4   9.7764   3.0 ------	UNKNOWN
 13.4701 -60.4045    3.2  27.9 -173.4   2.6384   3.6 ------	UNKNOWN
  2.7497 -37.7794    2.7  42.3 -139.8   5.8876   4.4 ------	UNKNOWN