Analysis Summary
Notes:
- 1) No attempt has been made to eliminate the non-significant decimal places.
- 2) This batgrbproduct analysis is done using the HEASARC data.
- 3) This batgrbproduct analysis is using the flight position for the mask-weighting calculation.
======================================================================
                  BAT GRB EVENT DATA PROCESSING REPORT
    Process Script Ver: batgrbproduct v2.47
    Process Start Time: Mon May 18 14:18:00 EDT 2020
             Host Name: bat1
   Current Working Dir: /local/data/bat1/alien/Swift_3rdBATcatalog/event/batevent_reproc/trigger966554
======================================================================

  Trigger: 00966554      Segment: 000

  BAT Trigger Time: 608713541.952   [s; MET]
      Trigger Stop: 608713542.464   [s; MET]
               UTC: 2020-04-16T07:05:17.171400    [includes UTCF correction]
       Where From?: TDRSS position message

  BAT
    RA: 335.690709384972   Dec: -7.52998032721292  [deg; J2000]

     Catalogged Source?: NO
     Point Source?:      YES
     GRB Indicated?:     YES    [ by BAT flight software ]
     Image S/N Ratio:    10.19
     Image Trigger?:     NO
     Rate S/N Ratio:     21.6564078277077  [ if not an image trigger ]
     Image S/N Ratio:    10.19

  Analysis Position:   [ source = BAT ]
    RA: 335.690709384972   Dec: -7.52998032721292  [deg; J2000]

  Refined Position:   [ source = BAT pre-slew burst ]
    RA: 335.693477989413   Dec: -7.52694426326541  [deg; J2000]
        { 22h 22m 46.4s , -07d 31' 37.0" }
         +/- 1.33918172274151 [arcmin] (estimated 90% radius based on SNR)
         +/- 0.424268143128861 [arcmin] (formal 1-sigma fit error)
    SNR: 20.040985560328

  Angular difference between the analysis and refined position is 0.245570 arcmin

  Partial Coding Fraction: 0.3398438    [ including projection effects ]

  Duration
     T90: 6.04799997806549 +/- 0.978652094595659
        Measured from: -1.80799996852875
                   to: 4.24000000953674     [s; relative to TRIGTIME]
     T50: 3.18400013446808 +/- 0.609261909202546
        Measured from: -0.0320000648498535
                   to: 3.15200006961823     [s; relative to TRIGTIME]


  Fluence
     Peak Flux  (peak 1 second)
        Measured from: -0.0279999971389771
                   to: 0.972000002861023     [s; relative to TRIGTIME]
     Total Fluence
        Measured from: -2.33599996566772
                   to: 4.95999991893768     [s; relative to TRIGTIME]

             Band 1     Band 2     Band 3     Band 4
              15-25      25-50     50-100    100-350     keV
 Total     0.470313   0.561033   0.359884   0.147273
           0.039258   0.041406   0.036024   0.030863 [error]
 Peak      0.097966   0.179493   0.126429   0.020890
           0.016564   0.017684   0.015912   0.011914 [error]

     [ fluence units of on-axis counts / fully illuminated detector ]

======================================================================


====== Table of the duration information =============================

        Value   tstart    tstop
T100    7.296   -2.336    4.960
T90     6.048   -1.808    4.240
T50     3.184   -0.032    3.152
Peak    1.000   -0.028    0.972


====== Spectral Analysis Summary =====================================

Model      : spectral model: simple power-law (PL) and cutoff power-law (CPL)
Ph_index   : photon index: E^{Ph_index}
Ph_90err   : 90% error of the photon index
Epeak      : Epeak in keV
Epeak_90err: 90% error of Epeak
Norm       : normalization at 50 keV in both the PL model and CPL model
Nomr_90err : 90% error of the normalization
chi2       : Chi-Squared
dof        : degree of freedo

=== Time-averaged spectral analysis ===
(Best model with acceptable fit: PL)

Model Ph_index Ph_90err_low Ph_90err_hi  Epeak  Epeak_90err_low  Epeak_90err_hi  Norm       Nomr_90err_low    Norm_90err_hi    chi2    dof
PL      -1.767    -0.147      0.145       -           -               -         1.41e-02     -1.23e-03          1.21e-03      57.140   57
CPL     -1.765    -0.149      0.431     9999.210    -9999.200      -9999.210      1.41e-02     -6.98e-03          9.38e-03      57.140   56


=== 1-s peak spectral analysis ===
(Best model with acceptable fit: PL)

Model Ph_index Ph_90err_low Ph_90err_hi  Epeak  Epeak_90err_low  Epeak_90err_hi  Norm       Nomr_90err_low    Norm_90err_hi    chi2    dof
PL      -1.665     -0.206     0.200       -           -               -         2.86e-02     -3.64e-03          3.61e-03      43.790   57
CPL     -1.047     -0.741     0.975       77.818     -19.775       -77.818      5.89e-02     -3.25e-02          1.21e-01      42.120   56


=== Fluence/Peak Flux Summary ===

              Model    Band1     Band2     Band3     Band4     Band5     Total
                       15-25     25-50    50-100    100-350    15-150    15-350    keV
Fluence         PL   1.69e-07  2.63e-07  3.10e-07  7.04e-07  9.47e-07  1.45e-06   erg/cm2
      90%_error_low -2.20e-08 -2.17e-08 -3.60e-08 -1.57e-07 -8.43e-08 -1.92e-07   erg/cm2
      90%_error_hi   2.27e-08  2.16e-08  3.58e-08  1.84e-07  8.50e-08  2.12e-07   erg/cm2
Peak flux       PL   1.38e+00  1.26e+00  7.94e-01  7.66e-01  3.75e+00  4.20e+00   ph/cm2/s
      90%_error_low -2.68e-01 -1.62e-01 -1.26e-01 -2.17e-01 -4.71e-01 -5.11e-01   ph/cm2/s
      90%_error_hi   2.83e-01  1.61e-01  1.24e-01  2.58e-01  4.73e-01  5.11e-01   ph/cm2/s

Fluence        CPL   1.70e-07  2.62e-07  3.08e-07  7.02e-07  9.49e-07  1.45e-06   erg/cm2
      90%_error_low    N/A       N/A    -4.43e-08    N/A    -9.16e-08 -3.78e-07   erg/cm2
      90%_error_hi     N/A       N/A     4.63e-08    N/A     8.68e-08  1.95e-07   erg/cm2
Peak flux      CPL   1.24e+00  1.34e+00  8.44e-01  4.19e-01  3.68e+00  3.84e+00   ph/cm2/s
      90%_error_low -3.22e-01 -1.93e-01 -1.44e-01 -2.35e-01 -4.83e-01 -5.58e-01   ph/cm2/s
      90%_error_hi   3.36e-01  2.01e-01  1.50e-01  4.46e-01  4.84e-01  6.78e-01   ph/cm2/s

======================================================================
Image
Pre-slew 15.0-350.0 keV image (Event data)
#   RAcent    DECcent   POSerr    Theta     Phi              Peak Cts       SNR   Name
  335.6935    -7.5269   0.0096    47.0631  -168.2027         1.6086980     20.041 TRIG_00966554

Foreground time interval of the image:
 -2.336   4.960 (delta_t =   7.296 [sec])
Background time interval of the image:
-216.851  -2.336 (delta_t = 214.515 [sec])
Light Curves
Note: The mask-weighted lightcurves have units of either count/det or counts/sec/det, where a det is 0.4 x 0.4 = 0.16 sq cm.
Full-time range; 1 s binning
Other quick-look light curves:
- 64 ms binning (zoomed)
- 16 ms binning (zoomed)
- 8 ms binning (zoomed)
- 2 ms binning (zoomed)
- SN=5 or 10 s binning (full-time range)
- Raw light curve
Spectra
- 64 ms binning (zoomed)
- 16 ms binning (zoomed)
- 8 ms binning (zoomed)
- 2 ms binning (zoomed)
- SN=5 or 10 s binning (full-time range)
- Raw light curve
Spectra
Notes:
- 1) The fitting includes the systematic errors.
- 2) When the burst includes telescope slew time periods, the fitting uses an average response file made from multiple 5-s response files through out the slew time plus single time preiod for the non-slew times, and weighted by the total counts in the corresponding time period using addrmf. An average response file is needed becuase a spectral fit using the pre-slew DRM will introduce some errors in both a spectral shape and a normalization if the PHA file contains a lot of the slew/post-slew time interval.
- 3) For fits to more complicated models (e.g. a power-law over a cutoff power-law), the BAT team has decided to require a chi-square improvement of more than 6 for each extra dof.
Time averaged spectrum fit using the average DRM
Power-law model
Time interval is from   -2.336 sec. to    4.960 sec.
XSPEC12>exit
 XSPEC: quit


Photon index: -1.76692     ( -0.147398   0.144546 )
------------------------------------------------------------
Parameters  : value       lower 90%   higher 90%
Photon index: 1.76692     ( -0.144546   0.147398 )
Norm@50keV  : 1.40791E-02    ( -0.00122581   0.00121254 )
------------------------------------------------------------

Photon flux (15-150 keV)    in 7.296 sec: 1.91584 ( -0.15987  0.16023 ) ph/cm2/s
Energy fluence (15-150 keV)             : 9.47123e-07 ( -8.43337e-08  8.49605e-08 ) ergs/cm2
Cutoff power-law model
Time interval is from   -2.336 sec. to    4.960 sec.
 XSPEC: quit


Photon index: -1.76479     ( -0.149171   0.431013 )
------------------------------------------------------------
Parameters  : value       lower 90%   higher 90%
Photon index: 1.76479     ( -0.431013   0.149171 )
Epeak [keV] : 9999.21      ( -9999.35 -9999.36 )
Norm@50keV  : 1.41110E-02    ( -0.00697438   0.00938523 )
------------------------------------------------------------

Photon flux (15-150 keV)    in 7.296 sec: 1.91925 ( -0.1711  0.16444 ) ph/cm2/s
Energy fluence (15-150 keV)             : 9.49458e-07 ( -9.16006e-08  8.68166e-08 ) ergs/cm2
1-s peak spectrum fit
Power-law model
Time interval is from   -0.028 sec. to    0.972 sec.
XSPEC12>exit
 XSPEC: quit


Photon index: -1.66542     ( -0.206484   0.200197 )
------------------------------------------------------------
Parameters  : value       lower 90%   higher 90%
Photon index: 1.66542     ( -0.200197   0.206484 )
Norm@50keV  : 2.86049E-02    ( -0.00364012   0.00360853 )
------------------------------------------------------------

Photon flux (15-150 keV)    in 1 sec: 3.75446 ( -0.4715  0.4726 ) ph/cm2/s
Energy fluence (15-150 keV)             : 2.65675e-07 ( -3.52445e-08  3.54591e-08 ) ergs/cm2
Cutoff power-law model
Time interval is from   -0.028 sec. to    0.972 sec.
 XSPEC: quit


Photon index: -1.04664     ( -0.741105   0.975007 )
------------------------------------------------------------
Parameters  : value       lower 90%   higher 90%
Photon index: 1.04664     ( -0.975007   0.741105 )
Epeak [keV] : 77.8180      ( -19.7754 -77.818 )
Norm@50keV  : 5.88622E-02    ( -0.0324648   0.120783 )
------------------------------------------------------------

Photon flux (15-150 keV)    in 1 sec: 3.67676 ( -0.48319  0.48374 ) ph/cm2/s
Energy fluence (15-150 keV)             : 2.58131e-07 ( -3.72644e-08  3.71531e-08 ) ergs/cm2
Time-resolved spectra
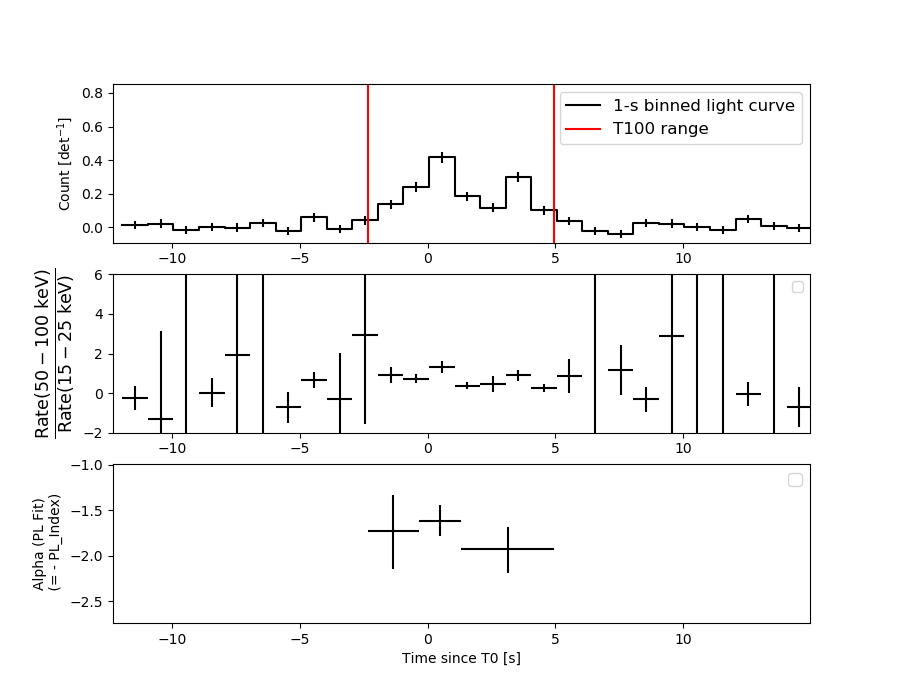
Distribution
T90 vs. Hardness ratio plot
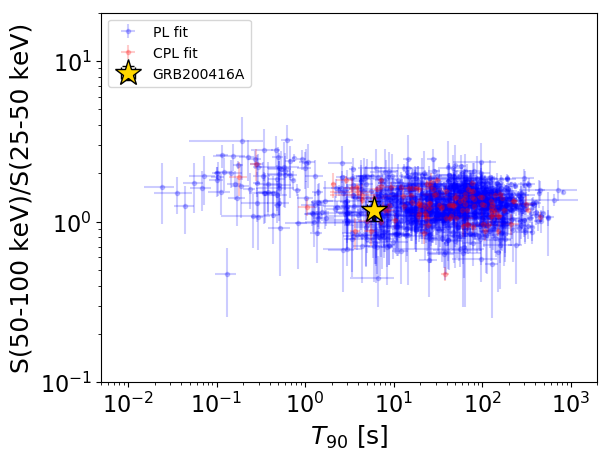
T90                                   = 6.048 sec.
Hardness ratio (energy fluence ratio) = 1.17535766918
S(15-50 keV) vs. S(50-150 keV) plot
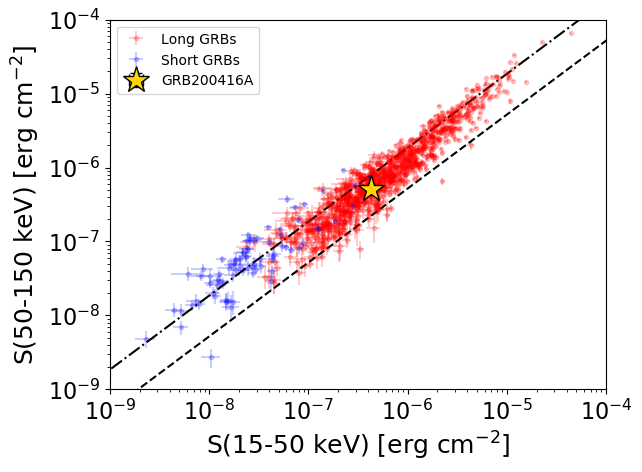
S(15-50 keV)  = 4.319537e-07
S(50-150 keV) = 5.15175e-07
The dash-dotted line and the dashed line traces the fluences calculated from the Band function with Epeak = 15 and 150 keV, respectively. Both lines assume a canonical values of alpha = -1 and beta = -2.5.
Mask shadow pattern
IMX = -1.052036859068425E+00, IMY = 2.197308086859326E-01
Spacecraft aspect plot
Bright source in the pre-burst/pre-slew/post-slew images
Pre-burst image of 15-350 keV band
Time interval of the image:
-216.851410 -2.336000

# RAcent  DECcent POSerr Theta    Phi  PeakCts   SNR AngSep     Name
#  [deg]    [deg]    ['] [deg]  [deg]                   [']
 88.9907 -34.2591    3.3  58.3   -0.4   4.8892   3.6 ------	UNKNOWN
 84.2391 -30.3213    3.1  56.7   -6.9   3.6739   3.7 ------	UNKNOWN
Pre-slew background subtracted image of 15-350 keV band
Time interval of the image:
-2.336000 4.960000

# RAcent  DECcent POSerr Theta    Phi  PeakCts   SNR AngSep     Name
#  [deg]    [deg]    ['] [deg]  [deg]                   [']
335.6935  -7.5269    0.6  47.1 -168.2   1.6087  20.0 ------	UNKNOWN
Post-slew image of 15-350 keV band
Time interval of the image:
83.748590 780.748600

# RAcent  DECcent POSerr Theta    Phi  PeakCts   SNR AngSep     Name
#  [deg]    [deg]    ['] [deg]  [deg]                   [']
299.5634  35.2096    6.2  54.7  163.4   6.7179   1.9    1.4	Cyg X-1
308.1724  41.0616    3.3  54.8  174.3   9.4346   3.5    7.1	Cyg X-3
326.1298  38.4057    4.5  46.8 -170.7   3.8111   2.6    5.4	Cyg X-2
309.1448 -11.7385    2.9  26.5   98.4   4.1604   4.0 ------	UNKNOWN
303.0076  37.7456    2.8  54.6  168.0  13.0934   4.1 ------	UNKNOWN
333.4291 -10.8890    3.7   4.0   53.2   1.8650   3.1 ------	UNKNOWN