Analysis Summary
Notes:
- 1) No attempt has been made to eliminate the non-significant decimal places.
- 2) This batgrbproduct analysis is done using the HEASARC data.
- 3) This batgrbproduct analysis is using the flight position for the mask-weighting calculation.
======================================================================
BAT GRB EVENT DATA PROCESSING REPORT
Process Script Ver: batgrbproduct v2.47
Process Start Time: Mon May 18 14:16:08 EDT 2020
Host Name: bat1
Current Working Dir: /local/data/bat1/alien/Swift_3rdBATcatalog/event/batevent_reproc/trigger967774
======================================================================
Trigger: 00967774 Segment: 000
BAT Trigger Time: 609466606.592 [s; MET]
Trigger Stop: 609466610.688 [s; MET]
UTC: 2020-04-25T00:16:21.762420 [includes UTCF correction]
Where From?: TDRSS position message
BAT
RA: 85.2407720384269 Dec: -13.4588771838186 [deg; J2000]
Catalogged Source?: NO
Point Source?: YES
GRB Indicated?: YES [ by BAT flight software ]
Image S/N Ratio: 8.62
Image Trigger?: NO
Rate S/N Ratio: 13.490737563232 [ if not an image trigger ]
Image S/N Ratio: 8.62
Analysis Position: [ source = BAT ]
RA: 85.2407720384269 Dec: -13.4588771838186 [deg; J2000]
Refined Position: [ source = BAT pre-slew burst ]
RA: 85.2173769200413 Dec: -13.3994730425819 [deg; J2000]
{ 05h 40m 52.2s , -13d 23' 58.1" }
+/- 1.95064636822535 [arcmin] (estimated 90% radius based on SNR)
+/- 0.987794856144153 [arcmin] (formal 1-sigma fit error)
SNR: 11.7105583823982
Angular difference between the analysis and refined position is 3.816803 arcmin
Partial Coding Fraction: 1.015625 [ including projection effects ]
Duration
T90: 81 +/- 21.6621790224345
Measured from: -41.5920000076294
to: 39.4079999923706 [s; relative to TRIGTIME]
T50: 28 +/- 10.1980390271856
Measured from: -23.5920000076294
to: 4.40799999237061 [s; relative to TRIGTIME]
Fluence
Peak Flux (peak 1 second)
Measured from: 2.40799999237061
to: 3.40799999237061 [s; relative to TRIGTIME]
Total Fluence
Measured from: -47.5920000076294
to: 58.4079999923706 [s; relative to TRIGTIME]
Band 1 Band 2 Band 3 Band 4
15-25 25-50 50-100 100-350 keV
Total 0.526994 0.624328 0.581243 0.131340
0.069188 0.072306 0.063782 0.058385 [error]
Peak 0.020831 0.035056 0.025643 0.005298
0.007064 0.007723 0.006551 0.005949 [error]
[ fluence units of on-axis counts / fully illuminated detector ]
======================================================================
====== Table of the duration information =============================
Value tstart tstop
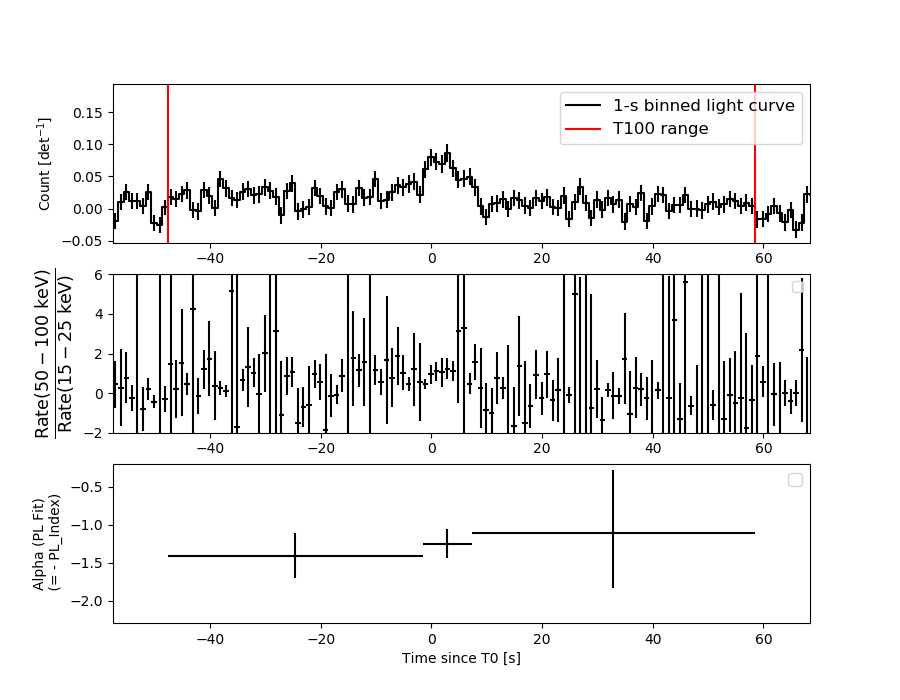
T100 106.000 -47.592 58.408
T90 81.000 -41.592 39.408
T50 28.000 -23.592 4.408
Peak 1.000 2.408 3.408
====== Spectral Analysis Summary =====================================
Model : spectral model: simple power-law (PL) and cutoff power-law (CPL)
Ph_index : photon index: E^{Ph_index}
Ph_90err : 90% error of the photon index
Epeak : Epeak in keV
Epeak_90err: 90% error of Epeak
Norm : normalization at 50 keV in both the PL model and CPL model
Nomr_90err : 90% error of the normalization
chi2 : Chi-Squared
dof : degree of freedo
=== Time-averaged spectral analysis ===
(Best model with acceptable fit: N/A)
Model Ph_index Ph_90err_low Ph_90err_hi Epeak Epeak_90err_low Epeak_90err_hi Norm Nomr_90err_low Norm_90err_hi chi2 dof
PL -1.301 -0.210 0.213 - - - 1.17e-03 -1.29e-04 1.28e-04 77.600 57
CPL -1.313 -0.197 0.230 9999.360 -9999.360 -9999.360 1.16e-03 -1.22e-04 1.36e-04 77.650 56
=== 1-s peak spectral analysis ===
(Best model with acceptable fit: PL)
Model Ph_index Ph_90err_low Ph_90err_hi Epeak Epeak_90err_low Epeak_90err_hi Norm Nomr_90err_low Norm_90err_hi chi2 dof
PL -1.243 -0.384 0.396 - - - 5.93e-03 -1.38e-03 1.38e-03 46.050 57
CPL 0.105 -1.515 2.019 78.638 -25.939 -78.638 2.77e-02 -2.77e-02 7.98e-01 44.500 56
=== Fluence/Peak Flux Summary ===
Model Band1 Band2 Band3 Band4 Band5 Total
15-25 25-50 50-100 100-350 15-150 15-350 keV
Fluence PL 1.31e-07 2.72e-07 4.41e-07 1.61e-06 1.22e-06 2.45e-06 erg/cm2
90%_error_low -2.70e-08 -3.34e-08 -6.39e-08 -4.70e-07 -1.55e-07 -5.19e-07 erg/cm2
90%_error_hi 2.84e-08 3.27e-08 6.29e-08 6.00e-07 1.57e-07 6.30e-07 erg/cm2
Peak flux PL 1.91e-01 2.24e-01 1.89e-01 2.71e-01 7.01e-01 8.75e-01 ph/cm2/s
90%_error_low -7.43e-02 -5.90e-02 -5.21e-02 -1.26e-01 -1.65e-01 -2.12e-01 ph/cm2/s
90%_error_hi 8.32e-02 5.77e-02 5.15e-02 1.83e-01 1.65e-01 2.20e-01 ph/cm2/s
Fluence CPL 1.31e-07 2.72e-07 4.41e-07 1.85e-06 1.23e-06 2.41e-06 erg/cm2
90%_error_low -2.71e-08 -3.34e-08 N/A N/A -1.64e-07 -6.32e-07 erg/cm2
90%_error_hi 2.83e-08 3.26e-08 N/A N/A 1.47e-07 6.23e-07 erg/cm2
Peak flux CPL 1.48e-01 2.50e-01 2.07e-01 7.90e-02 6.62e-01 6.84e-01 ph/cm2/s
90%_error_low -9.44e-02 -7.12e-02 -6.12e-02 -7.90e-02 -1.79e-01 -1.98e-01 ph/cm2/s
90%_error_hi 1.01e-01 7.71e-02 6.35e-02 2.39e-01 1.75e-01 3.07e-01 ph/cm2/s
======================================================================
Image
Pre-slew 15.0-350.0 keV image (Event data)
#   RAcent    DECcent   POSerr    Theta     Phi              Peak Cts       SNR   Name
   85.2174   -13.3995   0.0165    12.7357    -4.6855         1.6747031     11.711 TRIG_00967774

Foreground time interval of the image:
-47.592  41.509 (delta_t =  89.101 [sec])
Background time interval of the image:
-239.592 -47.592 (delta_t = 192.000 [sec])
Light Curves
Note: The mask-weighted lightcurves have units of either count/det or counts/sec/det, where a det is 0.4 x 0.4 = 0.16 sq cm.
Full-time range; 1 s binning
Other quick-look light curves:
- 64 ms binning (zoomed)
- 16 ms binning (zoomed)
- 8 ms binning (zoomed)
- 2 ms binning (zoomed)
- SN=5 or 10 s binning (full-time range)
- Raw light curve
Spectra
- 64 ms binning (zoomed)
- 16 ms binning (zoomed)
- 8 ms binning (zoomed)
- 2 ms binning (zoomed)
- SN=5 or 10 s binning (full-time range)
- Raw light curve
Spectra
Notes:
- 1) The fitting includes the systematic errors.
- 2) When the burst includes telescope slew time periods, the fitting uses an average response file made from multiple 5-s response files through out the slew time plus single time preiod for the non-slew times, and weighted by the total counts in the corresponding time period using addrmf. An average response file is needed becuase a spectral fit using the pre-slew DRM will introduce some errors in both a spectral shape and a normalization if the PHA file contains a lot of the slew/post-slew time interval.
- 3) For fits to more complicated models (e.g. a power-law over a cutoff power-law), the BAT team has decided to require a chi-square improvement of more than 6 for each extra dof.
Time averaged spectrum fit using the average DRM
Power-law model
Time interval is from  -47.592 sec. to   58.408 sec.
XSPEC12>exit
 XSPEC: quit


Photon index: -1.30127     ( -0.210257   0.212919 )
------------------------------------------------------------
Parameters  : value       lower 90%   higher 90%
Photon index: 1.30127     ( -0.212919   0.210257 )
Norm@50keV  : 1.16557E-03    ( -0.00012879   0.000128443 )
------------------------------------------------------------

Photon flux (15-150 keV)    in 106 sec: 0.139090 ( -0.015557  0.015591 ) ph/cm2/s
Energy fluence (15-150 keV)             : 1.22066e-06 ( -1.54741e-07  1.56564e-07 ) ergs/cm2
Cutoff power-law model

Time interval is from  -47.592 sec. to   58.408 sec.
 XSPEC: quit


Photon index: -1.29838     ( -0.198501   0.228851 )
------------------------------------------------------------
Parameters  : value       lower 90%   higher 90%
Photon index: 1.29838     ( -0.228851   0.198501 )
Epeak [keV] : 1.00000E+04      ( -10000 -10000 )
Norm@50keV  : 1.17029E-03    ( -0.000129566   0.000127976 )
------------------------------------------------------------

Photon flux (15-150 keV)    in 106 sec: 0.139069 ( -0.015555  0.01558 ) ph/cm2/s
Energy fluence (15-150 keV)             : 1.22972e-06 ( -1.64431e-07  1.46751e-07 ) ergs/cm2
1-s peak spectrum fit
Power-law model
Time interval is from    2.408 sec. to    3.408 sec.
XSPEC12>exit
 XSPEC: quit


Photon index: -1.24304     ( -0.384041   0.396401 )
------------------------------------------------------------
Parameters  : value       lower 90%   higher 90%
Photon index: 1.24304     ( -0.396401   0.384041 )
Norm@50keV  : 5.93265E-03    ( -0.0013803   0.0013785 )
------------------------------------------------------------

Photon flux (15-150 keV)    in 1 sec: 0.700893 ( -0.164948  0.165423 ) ph/cm2/s
Energy fluence (15-150 keV)             : 5.94895e-08 ( -1.52918e-08  1.56209e-08 ) ergs/cm2
Cutoff power-law model
Time interval is from    2.408 sec. to    3.408 sec.
 XSPEC: quit


Photon index: 0.104781     ( -1.51493   2.01906 )
------------------------------------------------------------
Parameters  : value       lower 90%   higher 90%
Photon index: -0.104781     ( -2.01906   1.51493 )
Epeak [keV] : 78.6378      ( -25.9373 -78.6362 )
Norm@50keV  : 2.77494E-02    ( -0.0277518   0.798008 )
------------------------------------------------------------

Photon flux (15-150 keV)    in 1 sec: 0.662496 ( -0.179121  0.175135 ) ph/cm2/s
Energy fluence (15-150 keV)             : 5.34663e-08 ( -1.62323e-08  1.76747e-08 ) ergs/cm2
Time-resolved spectra
Distribution
T90 vs. Hardness ratio plot
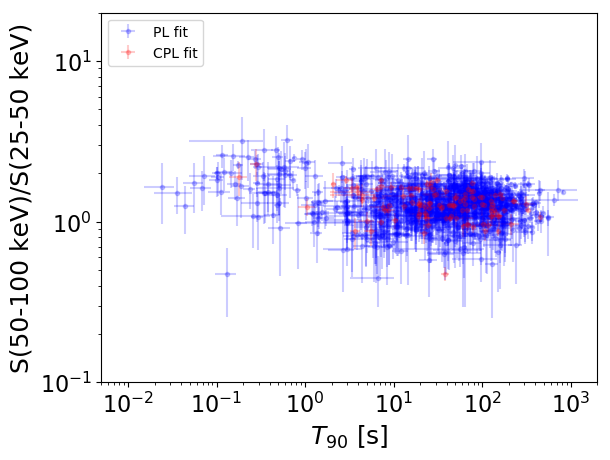
T90                                   = N/A sec.
Hardness ratio (energy fluence ratio) = N/A
S(15-50 keV) vs. S(50-150 keV) plot
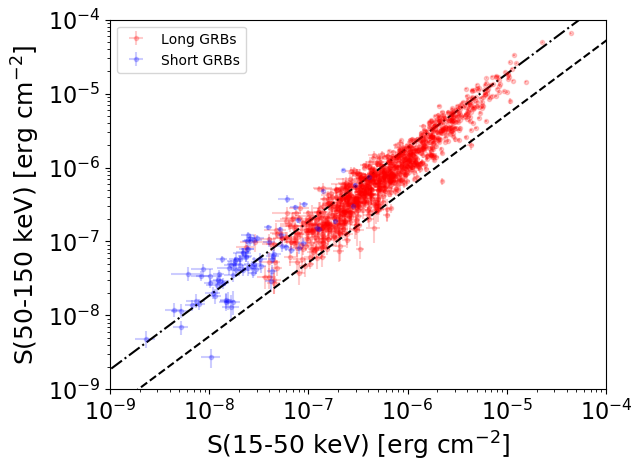
S(15-50 keV)  = N/A
S(50-150 keV) = N/A
The dash-dotted line and the dashed line traces the fluences calculated from the Band function with Epeak = 15 and 150 keV, respectively. Both lines assume a canonical values of alpha = -1 and beta = -2.5.
Mask shadow pattern
IMX = 2.252587250891085E-01, IMY = 1.846227611429985E-02
Spacecraft aspect plot
Bright source in the pre-burst/pre-slew/post-slew images
Pre-burst image of 15-350 keV band
Time interval of the image:
-239.592000 -47.592000

# RAcent  DECcent POSerr Theta    Phi  PeakCts   SNR AngSep     Name
#  [deg]    [deg]    ['] [deg]  [deg]                   [']
 83.6453  22.0169    0.8  47.5  -21.0   7.7340  13.8    0.7	Crab
 37.1865 -75.8316    2.8  54.8  167.3   5.5299   4.5 ------	UNKNOWN
 36.8019 -75.5928    3.3  54.7  167.6   5.4765   4.7 ------	UNKNOWN
 82.9026 -37.0546    2.5  11.8  147.1   1.0661   4.7 ------	UNKNOWN
Pre-slew background subtracted image of 15-350 keV band
Time interval of the image:
-47.592000 41.508600

# RAcent  DECcent POSerr Theta    Phi  PeakCts   SNR AngSep     Name
#  [deg]    [deg]    ['] [deg]  [deg]                   [']
 83.6601  21.8542    4.4  47.4  -21.0  -0.7848  -2.6    9.7	Crab
 85.2174 -13.3995    1.0  12.7   -4.7   1.6746  11.7 ------	UNKNOWN
 63.1650  -9.5315    2.0  23.1  -74.2   1.1038   5.7 ------	UNKNOWN
Post-slew image of 15-350 keV band
Time interval of the image:
74.908590 836.008600

# RAcent  DECcent POSerr Theta    Phi  PeakCts   SNR AngSep     Name
#  [deg]    [deg]    ['] [deg]  [deg]                   [']
 83.6595  22.0283    0.4  35.5  -27.5  31.5149  27.0    1.7	Crab
 60.0373 -65.5238    2.8  54.8  167.5  17.8436   4.1 ------	UNKNOWN
101.1035  -7.4516    3.0  16.7   45.5   3.3315   3.8 ------	UNKNOWN
 72.3363  27.1959    3.0  42.5  -42.1   5.4644   3.8 ------	UNKNOWN
 86.2690  43.4097    2.2  56.9  -24.1  18.8715   5.2 ------	UNKNOWN
 32.3706 -24.2060    3.3  50.9 -135.4  15.5089   3.5 ------	UNKNOWN