Analysis Summary
Notes:
- 1) No attempt has been made to eliminate the non-significant decimal places.
- 2) This batgrbproduct analysis is done using the HEASARC data.
- 3) This batgrbproduct analysis is using the flight position for the mask-weighting calculation.
======================================================================
                  BAT GRB EVENT DATA PROCESSING REPORT
    Process Script Ver: batgrbproduct v2.47
    Process Start Time: Mon Jun 29 15:05:11 EDT 2020
             Host Name: bat1
   Current Working Dir: /local/data/bat1/alien/Swift_3rdBATcatalog/event/batevent_reproc/trigger970886
======================================================================

  Trigger: 00970886      Segment: 000

  BAT Trigger Time: 610699662.336   [s; MET]
      Trigger Stop: 610699666.432   [s; MET]
               UTC: 2020-05-09T06:47:17.426340    [includes UTCF correction]
       Where From?: TDRSS position message

  BAT
    RA: 116.449929380473   Dec: -4.64135929017309  [deg; J2000]

     Catalogged Source?: NO
     Point Source?:      YES
     GRB Indicated?:     YES    [ by BAT flight software ]
     Image S/N Ratio:    10.2
     Image Trigger?:     NO
     Rate S/N Ratio:     13.1529464379659  [ if not an image trigger ]
     Image S/N Ratio:    10.2

  Analysis Position:   [ source = BAT ]
    RA: 116.449929380473   Dec: -4.64135929017309  [deg; J2000]

  Refined Position:   [ source = BAT pre-slew burst ]
    RA: 116.414946348068   Dec: -4.63401519229606  [deg; J2000]
        { 07h 45m 39.6s , -04d 38' 02.5" }
         +/- 1.70519975245069 [arcmin] (estimated 90% radius based on SNR)
         +/- 0.802992935622336 [arcmin] (formal 1-sigma fit error)
    SNR: 14.1909302149057

  Angular difference between the analysis and refined position is 2.138011 arcmin

  Partial Coding Fraction: 0.3984375    [ including projection effects ]

  Duration
     T90: 828.227999925613 +/- 13.3825565010765
        Measured from: 3.36400008201599
                   to: 831.592000007629     [s; relative to TRIGTIME]
     T50: 607.999999880791 +/- 209.406043122585
        Measured from: 206.236000061035
                   to: 814.235999941826     [s; relative to TRIGTIME]


  Fluence
     Peak Flux  (peak 1 second)
        Measured from: 822.692000031471
                   to: 823.692000031471     [s; relative to TRIGTIME]
     Total Fluence
        Measured from: -0.796000003814697
                   to: 848.991999983788     [s; relative to TRIGTIME]

             Band 1     Band 2     Band 3     Band 4
              15-25      25-50     50-100    100-350     keV
 Total     3.081621   4.197761   3.242221   0.845820
           0.180387   0.187450   0.166827   0.152894 [error]
 Peak      0.064290   0.049961   0.039725   0.013032
           0.006603   0.006943   0.006016   0.005086 [error]

     [ fluence units of on-axis counts / fully illuminated detector ]

======================================================================


====== Table of the duration information =============================

        Value   tstart    tstop
T100  849.788   -0.796  848.992
T90   828.228    3.364  831.592
T50   608.000  206.236  814.236
Peak    1.000  822.692  823.692


====== Spectral Analysis Summary =====================================

Model      : spectral model: simple power-law (PL) and cutoff power-law (CPL)
Ph_index   : photon index: E^{Ph_index}
Ph_90err   : 90% error of the photon index
Epeak      : Epeak in keV
Epeak_90err: 90% error of Epeak
Norm       : normalization at 50 keV in both the PL model and CPL model
Nomr_90err : 90% error of the normalization
chi2       : Chi-Squared
dof        : degree of freedo

=== Time-averaged spectral analysis ===
(Best model with acceptable fit: PL)

Model Ph_index Ph_90err_low Ph_90err_hi  Epeak  Epeak_90err_low  Epeak_90err_hi  Norm       Nomr_90err_low    Norm_90err_hi    chi2    dof
PL      -1.512    -0.092      0.091       -           -               -         8.54e-04     -4.41e-05          4.40e-05      42.000   57
CPL     -1.186    -0.351      0.382      124.898     -42.720      -124.898      1.24e-03     -4.02e-04          6.72e-04      39.510   56


=== 1-s peak spectral analysis ===
(Best model with acceptable fit: PL)

Model Ph_index Ph_90err_low Ph_90err_hi  Epeak  Epeak_90err_low  Epeak_90err_hi  Norm       Nomr_90err_low    Norm_90err_hi    chi2    dof
PL      -1.826     -0.260     0.243       -           -               -         9.08e-03     -1.44e-03          1.39e-03      47.320   57
CPL     -2.059     -0.181     0.685       24.828      N/A           N/A         6.83e-03        N/A               N/A         46.820   56


=== Fluence/Peak Flux Summary ===

              Model    Band1     Band2     Band3     Band4     Band5     Total
                       15-25     25-50    50-100    100-350    15-150    15-350    keV
Fluence         PL   9.37e-07  1.71e-06  2.40e-06  7.04e-06  6.87e-06  1.21e-05   erg/cm2
      90%_error_low -8.26e-08 -9.14e-08 -1.62e-07 -9.84e-07 -3.88e-07 -1.11e-06   erg/cm2
      90%_error_hi   8.48e-08  9.12e-08  1.62e-07  1.09e-06  3.91e-07  1.20e-06   erg/cm2
Peak flux       PL   5.11e-01  4.25e-01  2.40e-01  2.00e-01  1.26e+00  1.38e+00   ph/cm2/s
      90%_error_low -9.78e-02 -5.35e-02 -5.05e-02 -7.25e-02 -1.59e-01 -1.77e-01   ph/cm2/s
      90%_error_hi   1.02e-01  5.35e-02  5.04e-02  9.36e-02  1.59e-01  1.79e-01   ph/cm2/s

Fluence        CPL   8.85e-07  1.76e-06  2.44e-06  4.30e-06  6.68e-06  9.38e-06   erg/cm2
      90%_error_low -9.92e-08 -1.08e-07 -1.72e-07 -1.68e-06 -4.42e-07 -1.73e-06   erg/cm2
      90%_error_hi   1.01e-07  1.10e-07  1.74e-07  3.02e-06  4.41e-07  3.04e-06   erg/cm2
Peak flux      CPL   5.16e-01  4.23e-01  2.38e-01  2.01e-01  1.26e+00  1.38e+00   ph/cm2/s
      90%_error_low -1.03e-01     N/A       N/A   -7.14e-02 -1.59e-01 -2.00e-01   ph/cm2/s
      90%_error_hi   1.05e-01     N/A       N/A    9.14e-02  1.59e-01  1.74e-01   ph/cm2/s

======================================================================
Image
Pre-slew 15.0-350.0 keV image (Event data)
#   RAcent    DECcent   POSerr    Theta     Phi              Peak Cts       SNR   Name
  116.4149    -4.6340   0.0136    46.5133  -171.0355         2.1330344     14.191 TRIG_00970886

Foreground time interval of the image:
 -0.796  39.965 (delta_t =  40.761 [sec])
Background time interval of the image:
-239.336  -0.796 (delta_t = 238.540 [sec])
Light Curves
Note: The mask-weighted lightcurves have units of either count/det or counts/sec/det, where a det is 0.4 x 0.4 = 0.16 sq cm.
Full-time range; 1 s binning
Other quick-look light curves:
- 64 ms binning (zoomed)
- 16 ms binning (zoomed)
- 8 ms binning (zoomed)
- 2 ms binning (zoomed)
- SN=5 or 10 s binning (full-time range)
- Raw light curve
Spectra
- 64 ms binning (zoomed)
- 16 ms binning (zoomed)
- 8 ms binning (zoomed)
- 2 ms binning (zoomed)
- SN=5 or 10 s binning (full-time range)
- Raw light curve
Spectra
Notes:
- 1) The fitting includes the systematic errors.
- 2) When the burst includes telescope slew time periods, the fitting uses an average response file made from multiple 5-s response files through out the slew time plus single time preiod for the non-slew times, and weighted by the total counts in the corresponding time period using addrmf. An average response file is needed becuase a spectral fit using the pre-slew DRM will introduce some errors in both a spectral shape and a normalization if the PHA file contains a lot of the slew/post-slew time interval.
- 3) For fits to more complicated models (e.g. a power-law over a cutoff power-law), the BAT team has decided to require a chi-square improvement of more than 6 for each extra dof.
Time averaged spectrum fit using the average DRM
Power-law model
Time interval is from   -0.796 sec. to  848.992 sec.
XSPEC12>exit
 XSPEC: quit


Photon index: -1.5117     ( -0.0917008   0.0913393 )
------------------------------------------------------------
Parameters  : value       lower 90%   higher 90%
Photon index: 1.51170     ( -0.0913393   0.0917008 )
Norm@50keV  : 8.53962E-04    ( -4.4143e-05   4.40329e-05 )
------------------------------------------------------------

Photon flux (15-150 keV)    in 849.8 sec: 0.106950 ( -0.005556  0.005563 ) ph/cm2/s
Energy fluence (15-150 keV)             : 6.87221e-06 ( -3.88308e-07  3.90798e-07 ) ergs/cm2
Cutoff power-law model
Time interval is from   -0.796 sec. to  848.992 sec.
 XSPEC: quit


Photon index: -1.18648     ( -0.351304   0.382472 )
------------------------------------------------------------
Parameters  : value       lower 90%   higher 90%
Photon index: 1.18648     ( -0.382472   0.351304 )
Epeak [keV] : 124.898      ( -42.7204 -124.898 )
Norm@50keV  : 1.24433E-03    ( -0.000401619   0.00067245 )
------------------------------------------------------------

Photon flux (15-150 keV)    in 849.8 sec: 0.105032 ( -0.0059234  0.005921 ) ph/cm2/s
Energy fluence (15-150 keV)             : 6.68031e-06 ( -4.41574e-07  4.4111e-07 ) ergs/cm2
1-s peak spectrum fit
Power-law model
Time interval is from  822.692 sec. to  823.692 sec.
XSPEC12>exit
 XSPEC: quit


Photon index: -1.82604     ( -0.260085   0.243149 )
------------------------------------------------------------
Parameters  : value       lower 90%   higher 90%
Photon index: 1.82604     ( -0.243149   0.260085 )
Norm@50keV  : 9.07916E-03    ( -0.00144488   0.00138654 )
------------------------------------------------------------

Photon flux (15-150 keV)    in 1 sec: 1.26401 ( -0.15936  0.15938 ) ph/cm2/s
Energy fluence (15-150 keV)             : 8.35314e-08 ( -1.31302e-08  1.34146e-08 ) ergs/cm2
Cutoff power-law model
Time interval is from  822.692 sec. to  823.692 sec.
 XSPEC: quit


Photon index: -2.18577     ( -0.0533727   0.811955 )
------------------------------------------------------------
Parameters  : value       lower 90%   higher 90%
Photon index: 2.18577     ( -0.811955   0.0533727 )
Epeak [keV] : 73.1238      (   )
Norm@50keV  : 5.95765E-03    (     )
------------------------------------------------------------

Photon flux (15-150 keV)    in 1 sec: 1.26400 ( -0.15915  0.1593 ) ph/cm2/s
Energy fluence (15-150 keV)             : 0 ( 0  0 ) ergs/cm2
Time-resolved spectra
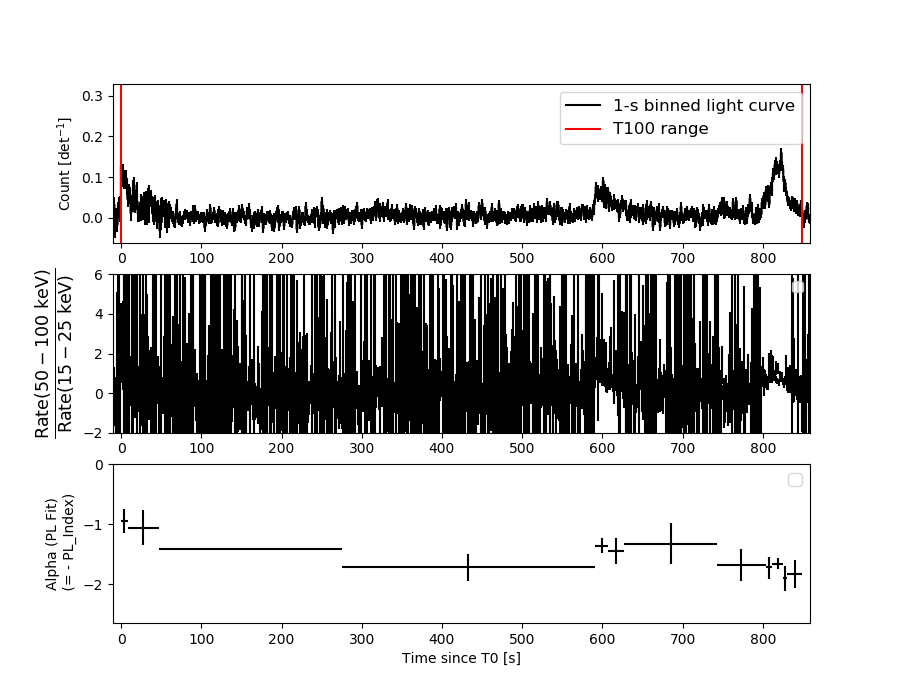
Distribution
T90 vs. Hardness ratio plot

T90                                   = 828.228 sec.
Hardness ratio (energy fluence ratio) = 1.40281350647
S(15-50 keV) vs. S(50-150 keV) plot
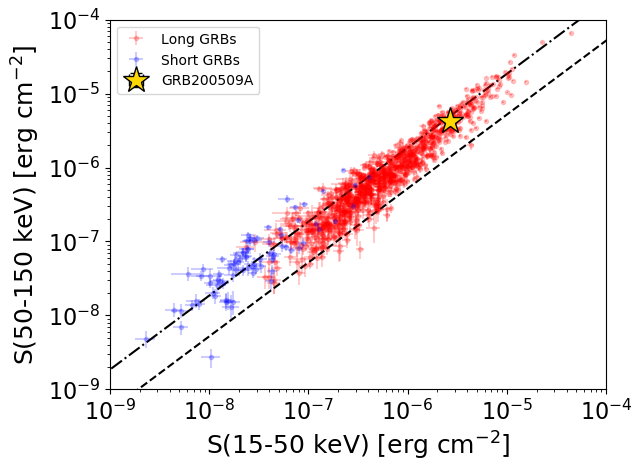
S(15-50 keV)  = 2.6461196e-06
S(50-150 keV) = 4.226105e-06
The dash-dotted line and the dashed line traces the fluences calculated from the Band function with Epeak = 15 and 150 keV, respectively. Both lines assume a canonical values of alpha = -1 and beta = -2.5.
Mask shadow pattern
IMX = -1.041394159813912E+00, IMY = 1.642787071514176E-01
Spacecraft aspect plot
Bright source in the pre-burst/pre-slew/post-slew images
Pre-burst image of 15-350 keV band
Time interval of the image:
-239.336000 -0.796000

# RAcent  DECcent POSerr Theta    Phi  PeakCts   SNR AngSep     Name
#  [deg]    [deg]    ['] [deg]  [deg]                   [']
159.4542  56.3866    2.8  24.3   21.2   0.9667   4.2 ------	UNKNOWN
Pre-slew background subtracted image of 15-350 keV band
Time interval of the image:
-0.796000 39.964590

# RAcent  DECcent POSerr Theta    Phi  PeakCts   SNR AngSep     Name
#  [deg]    [deg]    ['] [deg]  [deg]                   [']
178.5205  26.9259    2.2  39.2   79.3   1.6334   5.2 ------	UNKNOWN
160.2602  20.2422    1.8  29.7  106.8   0.8031   6.5 ------	UNKNOWN
234.5574  74.7139    2.3  55.3    3.4   2.0756   5.1 ------	UNKNOWN
116.4150  -4.6340    0.8  46.5 -171.0   2.1329  14.2 ------	UNKNOWN
113.0757  -8.8286    2.1  51.6 -168.7   1.1000   5.4 ------	UNKNOWN
Post-slew image of 15-350 keV band
Time interval of the image:
103.564590 962.695500

# RAcent  DECcent POSerr Theta    Phi  PeakCts   SNR AngSep     Name
#  [deg]    [deg]    ['] [deg]  [deg]                   [']
 83.6420  22.0442    0.9  41.8  -68.8  32.3780  13.2    1.8	Crab
135.7697 -40.4341    0.0  39.8  137.0   2.4381   1.5   13.2	Vela X-1
155.1002  19.8850    2.9  45.2   36.0   6.7025   3.9 ------	UNKNOWN
116.4361  -4.6201    0.8   0.0  -89.7   9.5437  14.8 ------	UNKNOWN
114.5282  20.1132    4.7  24.8  -24.2   1.6826   2.5 ------	UNKNOWN
123.1386  42.9233    2.9  47.9  -13.3   4.9637   4.0 ------	UNKNOWN
 65.5489 -29.5584    2.5  54.1 -143.4  15.2471   4.6 ------	UNKNOWN