Analysis Summary
Notes:
- 1) No attempt has been made to eliminate the non-significant decimal places.
- 2) This batgrbproduct analysis is done using the HEASARC data.
- 3) This batgrbproduct analysis is using the flight position for the mask-weighting calculation.
======================================================================
                  BAT GRB EVENT DATA PROCESSING REPORT
    Process Script Ver: batgrbproduct v2.47
    Process Start Time: Mon Jun 29 14:53:54 EDT 2020
             Host Name: bat1
   Current Working Dir: /local/data/bat1/alien/Swift_3rdBATcatalog/event/batevent_reproc/trigger974827
======================================================================

  Trigger: 00974827      Segment: 000

  BAT Trigger Time: 612354468.864   [s; MET]
      Trigger Stop: 612354469.376   [s; MET]
               UTC: 2020-05-28T10:27:23.846900    [includes UTCF correction]
       Where From?: TDRSS position message

  BAT
    RA: 176.636774868885   Dec: 58.1471189930449  [deg; J2000]

     Catalogged Source?: NO
     Point Source?:      YES
     GRB Indicated?:     YES    [ by BAT flight software ]
     Image S/N Ratio:    9.17
     Image Trigger?:     NO
     Rate S/N Ratio:     15.3948043183407  [ if not an image trigger ]
     Image S/N Ratio:    9.17

  Analysis Position:   [ source = BAT ]
    RA: 176.636774868885   Dec: 58.1471189930449  [deg; J2000]

  Refined Position:   [ source = BAT pre-slew burst ]
    RA: 176.635874179899   Dec: 58.1849494187847  [deg; J2000]
        { 11h 46m 32.6s , +58d 11' 05.8" }
         +/- 0.686444883629976 [arcmin] (estimated 90% radius based on SNR)
         +/- 0.229830573673835 [arcmin] (formal 1-sigma fit error)
    SNR: 52.064157854471

  Angular difference between the analysis and refined position is 2.270005 arcmin

  Partial Coding Fraction: 0.625    [ including projection effects ]

  Duration
     T90: 59.9839999675751 +/- 1.92381702054219
        Measured from: 4.74000000953674
                   to: 64.7239999771118     [s; relative to TRIGTIME]
     T50: 24.6319999694824 +/- 0.417612353072037
        Measured from: 28.0600000619888
                   to: 52.6920000314713     [s; relative to TRIGTIME]


  Fluence
     Peak Flux  (peak 1 second)
        Measured from: 33.8159999847412
                   to: 34.8159999847412     [s; relative to TRIGTIME]
     Total Fluence
        Measured from: -0.73199999332428
                   to: 132.34399998188     [s; relative to TRIGTIME]

             Band 1     Band 2     Band 3     Band 4
              15-25      25-50     50-100    100-350     keV
 Total    12.531114  13.062307   6.699846   0.944570
           0.091608   0.093892   0.077326   0.059484 [error]
 Peak      0.607270   0.762010   0.512094   0.097064
           0.013934   0.015551   0.013292   0.007421 [error]

     [ fluence units of on-axis counts / fully illuminated detector ]

======================================================================


====== Table of the duration information =============================

        Value   tstart    tstop
T100  133.076   -0.732  132.344
T90    59.984    4.740   64.724
T50    24.632   28.060   52.692
Peak    1.000   33.816   34.816


====== Spectral Analysis Summary =====================================

Model      : spectral model: simple power-law (PL) and cutoff power-law (CPL)
Ph_index   : photon index: E^{Ph_index}
Ph_90err   : 90% error of the photon index
Epeak      : Epeak in keV
Epeak_90err: 90% error of Epeak
Norm       : normalization at 50 keV in both the PL model and CPL model
Nomr_90err : 90% error of the normalization
chi2       : Chi-Squared
dof        : degree of freedo

=== Time-averaged spectral analysis ===
(Best model with acceptable fit: CPL)

Model Ph_index Ph_90err_low Ph_90err_hi  Epeak  Epeak_90err_low  Epeak_90err_hi  Norm       Nomr_90err_low    Norm_90err_hi    chi2    dof
PL      -2.100    -0.032      0.032       -           -               -         1.42e-02     -2.23e-04          2.23e-04      64.330   57
CPL     -1.616    -0.139      0.143       43.143      -6.094         4.350      2.34e-02     -3.09e-03          3.67e-03      26.680   56


=== 1-s peak spectral analysis ===
(Best model with acceptable fit: CPL)

Model Ph_index Ph_90err_low Ph_90err_hi  Epeak  Epeak_90err_low  Epeak_90err_hi  Norm       Nomr_90err_low    Norm_90err_hi    chi2    dof
PL      -1.678     -0.049     0.049       -           -               -         1.24e-01     -3.36e-03          3.36e-03      54.660   57
CPL     -1.173     -0.210     0.220       87.722     -11.939        25.083      2.15e-01     -4.27e-02          5.63e-02      36.870   56


=== Fluence/Peak Flux Summary ===

              Model    Band1     Band2     Band3     Band4     Band5     Total
                       15-25     25-50    50-100    100-350    15-150    15-350    keV
Fluence         PL   4.24e-06  5.42e-06  5.06e-06  8.29e-06  1.75e-05  2.30e-05   erg/cm2
      90%_error_low -1.40e-07 -1.02e-07 -9.94e-08 -3.68e-07 -2.78e-07 -4.27e-07   erg/cm2
      90%_error_hi   1.42e-07  1.02e-07  9.91e-08  3.80e-07  2.78e-07  4.32e-07   erg/cm2
Peak flux       PL   6.07e+00  5.50e+00  3.44e+00  3.28e+00  1.64e+01  1.83e+01   ph/cm2/s
      90%_error_low -3.05e-01 -1.67e-01 -1.14e-01 -2.24e-01 -4.83e-01 -4.92e-01   ph/cm2/s
      90%_error_hi   3.12e-01  1.66e-01  1.14e-01  2.34e-01  4.85e-01  4.92e-01   ph/cm2/s

Fluence        CPL   3.73e-06  5.50e-06  5.21e-06  4.91e-06  1.68e-05  1.93e-05   erg/cm2
      90%_error_low -1.89e-07 -1.07e-07 -1.11e-07 -6.23e-07 -3.33e-07 -7.44e-07   erg/cm2
      90%_error_hi   1.93e-07  1.07e-07  1.11e-07  7.37e-07  3.33e-07  8.44e-07   erg/cm2
Peak flux      CPL   5.38e+00  5.65e+00  3.60e+00  2.06e+00  1.58e+01  1.67e+01   ph/cm2/s
      90%_error_low -3.96e-01 -1.82e-01 -1.34e-01 -3.46e-01 -5.30e-01 -6.78e-01   ph/cm2/s
      90%_error_hi   4.05e-01  1.82e-01  1.35e-01  4.26e-01  5.33e-01  7.19e-01   ph/cm2/s

======================================================================
Image
Pre-slew 15.0-350.0 keV image (Event data)
#   RAcent    DECcent   POSerr    Theta     Phi              Peak Cts       SNR   Name
  176.6359    58.1849   0.0037    27.6737  -131.8887         4.0130465     52.064 TRIG_00974827

Foreground time interval of the image:
 -0.732  10.637 (delta_t =  11.369 [sec])
Background time interval of the image:
-239.864  -0.732 (delta_t = 239.132 [sec])
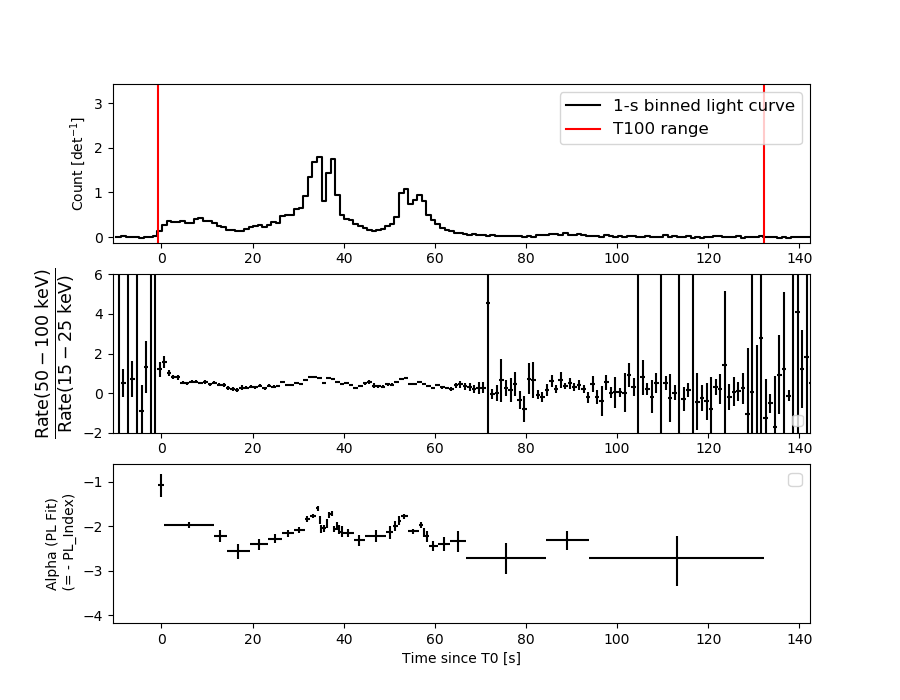
Light Curves
Note: The mask-weighted lightcurves have units of either count/det or counts/sec/det, where a det is 0.4 x 0.4 = 0.16 sq cm.
Full-time range; 1 s binning
Other quick-look light curves:
Spectra
Notes:
- 1) The fitting includes the systematic errors.
- 2) When the burst includes telescope slew time periods, the fitting uses an average response file made from multiple 5-s response files through out the slew time plus single time preiod for the non-slew times, and weighted by the total counts in the corresponding time period using addrmf. An average response file is needed becuase a spectral fit using the pre-slew DRM will introduce some errors in both a spectral shape and a normalization if the PHA file contains a lot of the slew/post-slew time interval.
- 3) For fits to more complicated models (e.g. a power-law over a cutoff power-law), the BAT team has decided to require a chi-square improvement of more than 6 for each extra dof.
Time averaged spectrum fit using the average DRM
Power-law model
Time interval is from   -0.732 sec. to  132.344 sec.
XSPEC12>exit
 XSPEC: quit


Photon index: -2.10012     ( -0.0316912   0.0316467 )
------------------------------------------------------------
Parameters  : value       lower 90%   higher 90%
Photon index: 2.10012     ( -0.0316467   0.0316912 )
Norm@50keV  : 1.41594E-02    ( -0.000223325   0.000223313 )
------------------------------------------------------------

Photon flux (15-150 keV)    in 133.1 sec: 2.22797 ( -0.0479  0.04824 ) ph/cm2/s
Energy fluence (15-150 keV)             : 1.75137e-05 ( -2.78429e-07  2.78437e-07 ) ergs/cm2
Cutoff power-law model
Time interval is from   -0.732 sec. to  132.344 sec.
 XSPEC: quit


Photon index: -1.61564     ( -0.139017   0.14307 )
------------------------------------------------------------
Parameters  : value       lower 90%   higher 90%
Photon index: 1.61564     ( -0.14307   0.139017 )
Epeak [keV] : 43.1431      ( -6.09422 4.34973 )
Norm@50keV  : 2.34425E-02    ( -0.00308822   0.00367097 )
------------------------------------------------------------

Photon flux (15-150 keV)    in 133.1 sec: 2.09906 ( -0.05753  0.05822 ) ph/cm2/s
Energy fluence (15-150 keV)             : 1.68282e-05 ( -3.32634e-07  3.32589e-07 ) ergs/cm2
1-s peak spectrum fit
Power-law model
Time interval is from   33.816 sec. to   34.816 sec.
XSPEC12>exit
 XSPEC: quit


Photon index: -1.67787     ( -0.049271   0.0490161 )
------------------------------------------------------------
Parameters  : value       lower 90%   higher 90%
Photon index: 1.67787     ( -0.0490161   0.049271 )
Norm@50keV  : 0.124363    ( -0.0033584   0.00335639 )
------------------------------------------------------------

Photon flux (15-150 keV)    in 1 sec: 16.3918 ( -0.4832  0.4846 ) ph/cm2/s
Energy fluence (15-150 keV)             : 1.15375e-06 ( -3.2274e-08  3.23191e-08 ) ergs/cm2
Cutoff power-law model
Time interval is from   33.816 sec. to   34.816 sec.
 XSPEC: quit


Photon index: -1.17312     ( -0.210198   0.220288 )
------------------------------------------------------------
Parameters  : value       lower 90%   higher 90%
Photon index: 1.17312     ( -0.220288   0.210198 )
Epeak [keV] : 87.7220      ( -11.9391 25.0829 )
Norm@50keV  : 0.214595    ( -0.0426834   0.0563396 )
------------------------------------------------------------

Photon flux (15-150 keV)    in 1 sec: 15.8069 ( -0.5302  0.5327 ) ph/cm2/s
Energy fluence (15-150 keV)             : 1.1183e-06 ( -3.56452e-08  3.55783e-08 ) ergs/cm2
Time-resolved spectra
Distribution
T90 vs. Hardness ratio plot
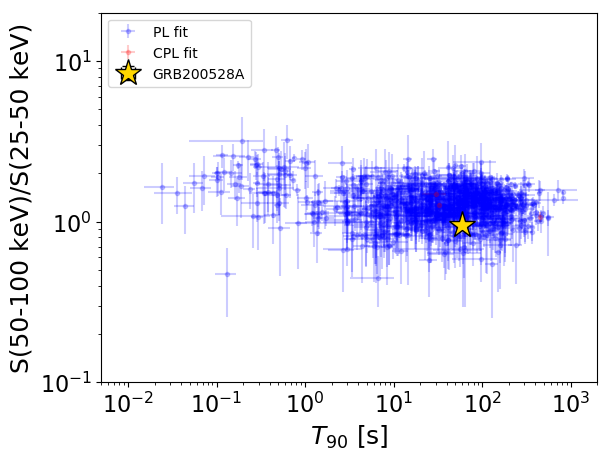
T90                                   = 59.984 sec.
Hardness ratio (energy fluence ratio) = 0.947785353973
S(15-50 keV) vs. S(50-150 keV) plot
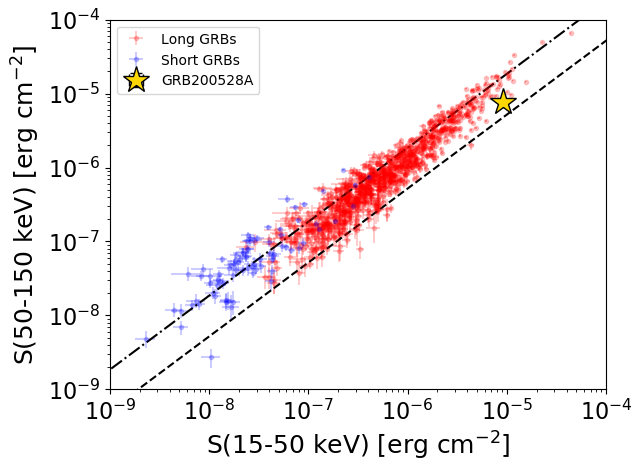
S(15-50 keV)  = 9.224761e-06
S(50-150 keV) = 7.603281e-06
The dash-dotted line and the dashed line traces the fluences calculated from the Band function with Epeak = 15 and 150 keV, respectively. Both lines assume a canonical values of alpha = -1 and beta = -2.5.
Mask shadow pattern
IMX = -3.501517289823179E-01, IMY = 3.904046968426518E-01
Spacecraft aspect plot
Bright source in the pre-burst/pre-slew/post-slew images
Pre-burst image of 15-350 keV band
Time interval of the image:
-239.864000 -0.732000

# RAcent  DECcent POSerr Theta    Phi  PeakCts   SNR AngSep     Name
#  [deg]    [deg]    ['] [deg]  [deg]                   [']
254.4659  35.2841   10.6  27.2   61.8   0.3412   1.1    3.5	Her X-1
299.5775  35.2117    3.2  50.9   15.1   2.2155   3.6    0.9	Cyg X-1
308.1563  41.0460    9.7  51.3    3.7   0.6557   1.2    6.0	Cyg X-3
345.5676  58.7718    3.1  54.4  -33.1   4.7228   3.7 ------	UNKNOWN
Pre-slew background subtracted image of 15-350 keV band
Time interval of the image:
-0.732000 10.636590

# RAcent  DECcent POSerr Theta    Phi  PeakCts   SNR AngSep     Name
#  [deg]    [deg]    ['] [deg]  [deg]                   [']
254.4576  35.1952   15.9  27.3   62.0  -0.0516  -0.7    8.8	Her X-1
299.3659  35.1754   23.7  50.8   15.3   0.0826   0.5   11.1	Cyg X-1
308.1655  41.0402   10.1  51.3    3.7  -0.1704  -1.2    5.8	Cyg X-3
225.1484  21.3604    4.1  35.0  118.3   0.3105   2.9 ------	UNKNOWN
179.8855  18.6741    2.8  52.4  176.8   0.7232   4.1 ------	UNKNOWN
176.6359  58.1850    0.2  27.7 -131.9   4.0132  52.1 ------	UNKNOWN
Post-slew image of 15-350 keV band
Time interval of the image:
59.036610 305.036600

# RAcent  DECcent POSerr Theta    Phi  PeakCts   SNR AngSep     Name
#  [deg]    [deg]    ['] [deg]  [deg]                   [']
209.8364  36.2615    2.6  30.8   92.1   1.7106   4.4 ------	UNKNOWN
174.4737   5.8048    3.1  52.4  154.2   4.4689   3.8 ------	UNKNOWN
176.5161  58.1907    0.9   0.1  -97.1   2.8264  12.7 ------	UNKNOWN
161.3292  53.6801    2.7   9.7 -139.5   0.9887   4.2 ------	UNKNOWN
144.7173  17.7351    3.0  46.8 -164.7   2.0999   3.9 ------	UNKNOWN
134.5342  20.5968    3.0  48.3 -151.3   2.7289   3.8 ------	UNKNOWN
122.2743  29.0791    3.3  47.1 -132.4   3.7754   3.5 ------	UNKNOWN