Analysis Summary
Notes:
- 1) No attempt has been made to eliminate the non-significant decimal places.
- 2) This batgrbproduct analysis is done using the HEASARC data.
- 3) This batgrbproduct analysis is using the flight position for the mask-weighting calculation.
======================================================================
BAT GRB EVENT DATA PROCESSING REPORT
Process Script Ver: batgrbproduct v2.47
Process Start Time: Mon Jun 29 14:49:44 EDT 2020
Host Name: bat1
Current Working Dir: /local/data/bat1/alien/Swift_3rdBATcatalog/event/batevent_reproc/trigger974942
======================================================================
Trigger: 00974942 Segment: 000
BAT Trigger Time: 612406620.8 [s; MET]
Trigger Stop: 612406632.96 [s; MET]
UTC: 2020-05-29T00:56:35.779500 [includes UTCF correction]
Where From?: TDRSS position message
BAT
RA: 238.751484339386 Dec: -11.0573217127229 [deg; J2000]
Catalogged Source?: NO
Point Source?: YES
GRB Indicated?: YES [ by BAT flight software ]
Image S/N Ratio: 16.33
Image Trigger?: NO
Rate S/N Ratio: 19.2613602842582 [ if not an image trigger ]
Image S/N Ratio: 16.33
Analysis Position: [ source = BAT ]
RA: 238.751484339386 Dec: -11.0573217127229 [deg; J2000]
Refined Position: [ source = BAT pre-slew burst ]
RA: 238.751991759704 Dec: -11.0799161937531 [deg; J2000]
{ 15h 55m 00.5s , -11d 04' 47.7" }
+/- 1.12117824661886 [arcmin] (estimated 90% radius based on SNR)
+/- 0.422392703980751 [arcmin] (formal 1-sigma fit error)
SNR: 25.8317944285249
Angular difference between the analysis and refined position is 1.355998 arcmin
Partial Coding Fraction: 0.5 [ including projection effects ]
Duration
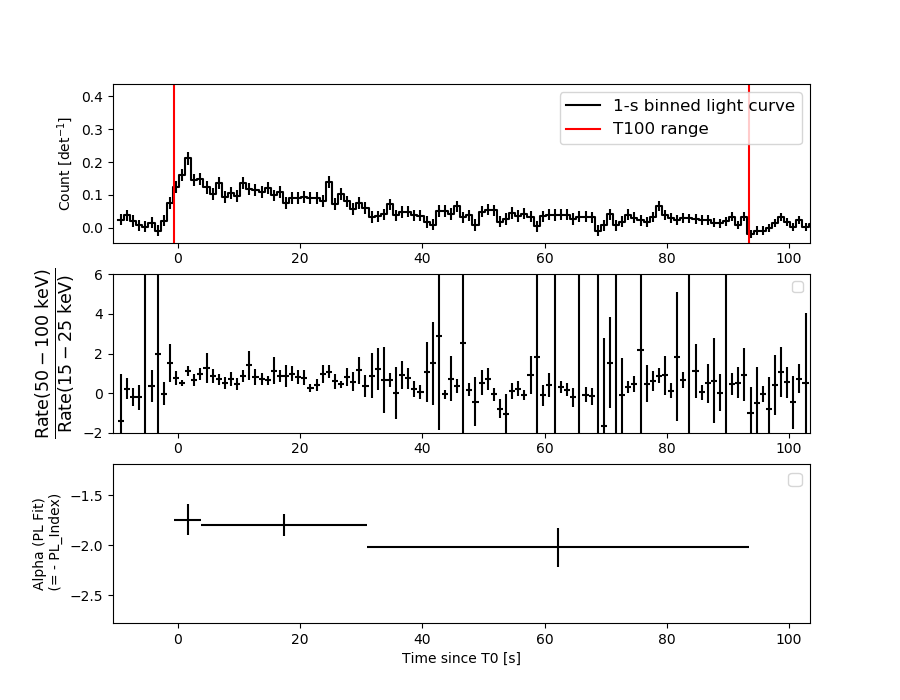
T90: 79.9159998893738 +/- 7.19582355717513
Measured from: 1.09600007534027
to: 81.0119999647141 [s; relative to TRIGTIME]
T50: 36.5799999237061 +/- 5.16854633688639
Measured from: 9.12400007247925
to: 45.7039999961853 [s; relative to TRIGTIME]
Fluence
Peak Flux (peak 1 second)
Measured from: 1.49600005149841
to: 2.49600005149841 [s; relative to TRIGTIME]
Total Fluence
Measured from: -0.687999963760376
to: 93.4280000925064 [s; relative to TRIGTIME]
Band 1 Band 2 Band 3 Band 4
15-25 25-50 50-100 100-350 keV
Total 1.856158 2.056342 1.290997 0.242431
0.100746 0.089365 0.074186 0.061842 [error]
Peak 0.069692 0.078686 0.054535 0.015281
0.011379 0.010275 0.008820 0.006968 [error]
[ fluence units of on-axis counts / fully illuminated detector ]
======================================================================
====== Table of the duration information =============================
Value tstart tstop
T100 94.116 -0.688 93.428
T90 79.916 1.096 81.012
T50 36.580 9.124 45.704
Peak 1.000 1.496 2.496
====== Spectral Analysis Summary =====================================
Model : spectral model: simple power-law (PL) and cutoff power-law (CPL)
Ph_index : photon index: E^{Ph_index}
Ph_90err : 90% error of the photon index
Epeak : Epeak in keV
Epeak_90err: 90% error of Epeak
Norm : normalization at 50 keV in both the PL model and CPL model
Nomr_90err : 90% error of the normalization
chi2 : Chi-Squared
dof : degree of freedo
=== Time-averaged spectral analysis ===
(Best model with acceptable fit: N/A)
Model Ph_index Ph_90err_low Ph_90err_hi Epeak Epeak_90err_low Epeak_90err_hi Norm Nomr_90err_low Norm_90err_hi chi2 dof
PL -1.887 -0.100 0.099 - - - 3.60e-03 -2.03e-04 2.01e-04 71.630 57
CPL -1.585 -0.357 0.413 65.289 -17.319 -65.289 5.16e-03 -1.68e-03 3.20e-03 69.770 56
=== 1-s peak spectral analysis ===
(Best model with acceptable fit: PL)
Model Ph_index Ph_90err_low Ph_90err_hi Epeak Epeak_90err_low Epeak_90err_hi Norm Nomr_90err_low Norm_90err_hi chi2 dof
PL -1.818 -0.275 0.259 - - - 1.35e-02 -2.13e-03 2.07e-03 34.180 57
CPL -1.821 -0.319 0.798 9999.310 N/A N/A 1.34e-02 N/A N/A 34.180 56
=== Fluence/Peak Flux Summary ===
Model Band1 Band2 Band3 Band4 Band5 Total
15-25 25-50 50-100 100-350 15-150 15-350 keV
Fluence PL 6.23e-07 9.05e-07 9.78e-07 1.97e-06 3.11e-06 4.48e-06 erg/cm2
90%_error_low -5.36e-08 -4.73e-08 -7.55e-08 -3.05e-07 -1.74e-07 -3.73e-07 erg/cm2
90%_error_hi 5.51e-08 4.72e-08 7.56e-08 3.42e-07 1.75e-07 3.99e-07 erg/cm2
Peak flux PL 7.53e-01 6.28e-01 3.56e-01 2.99e-01 1.87e+00 2.04e+00 ph/cm2/s
90%_error_low -1.67e-01 -8.92e-02 -7.42e-02 -1.09e-01 -2.66e-01 -2.83e-01 ph/cm2/s
90%_error_hi 1.78e-01 8.87e-02 7.30e-02 1.40e-01 2.67e-01 2.83e-01 ph/cm2/s
Fluence CPL 5.93e-07 9.30e-07 9.85e-07 1.24e-06 3.03e-06 3.75e-06 erg/cm2
90%_error_low -6.48e-08 -5.65e-08 -7.88e-08 -5.19e-07 -2.02e-07 -5.66e-07 erg/cm2
90%_error_hi 6.59e-08 5.74e-08 7.94e-08 8.37e-07 2.02e-07 8.91e-07 erg/cm2
Peak flux CPL 7.56e-01 5.62e-01 2.89e-01 2.50e-01 1.71e+00 1.86e+00 ph/cm2/s
90%_error_low N/A -1.28e-01 -7.29e-02 -1.07e-01 -3.88e-01 N/A ph/cm2/s
90%_error_hi N/A 1.37e-01 5.78e-02 4.54e-02 4.04e-01 N/A ph/cm2/s
======================================================================
Image
Pre-slew 15.0-350.0 keV image (Event data)
#   RAcent    DECcent   POSerr    Theta     Phi              Peak Cts       SNR   Name
  238.7520   -11.0799   0.0074    28.9873    61.4414         4.3214260     25.832 TRIG_00974942

Foreground time interval of the image:
 -0.688  55.701 (delta_t =  56.389 [sec])
Background time interval of the image:
-110.299  -0.688 (delta_t = 109.611 [sec])
Light Curves
Note: The mask-weighted lightcurves have units of either count/det or counts/sec/det, where a det is 0.4 x 0.4 = 0.16 sq cm.
Full-time range; 1 s binning
Other quick-look light curves:
- 64 ms binning (zoomed)
- 16 ms binning (zoomed)
- 8 ms binning (zoomed)
- 2 ms binning (zoomed)
- SN=5 or 10 s binning (full-time range)
- Raw light curve
Spectra
- 64 ms binning (zoomed)
- 16 ms binning (zoomed)
- 8 ms binning (zoomed)
- 2 ms binning (zoomed)
- SN=5 or 10 s binning (full-time range)
- Raw light curve
Spectra
Notes:
- 1) The fitting includes the systematic errors.
- 2) When the burst includes telescope slew time periods, the fitting uses an average response file made from multiple 5-s response files through out the slew time plus single time preiod for the non-slew times, and weighted by the total counts in the corresponding time period using addrmf. An average response file is needed becuase a spectral fit using the pre-slew DRM will introduce some errors in both a spectral shape and a normalization if the PHA file contains a lot of the slew/post-slew time interval.
- 3) For fits to more complicated models (e.g. a power-law over a cutoff power-law), the BAT team has decided to require a chi-square improvement of more than 6 for each extra dof.
Time averaged spectrum fit using the average DRM
Power-law model
Time interval is from   -0.688 sec. to   93.428 sec.
XSPEC12>exit
 XSPEC: quit


Photon index: -1.88715     ( -0.100206   0.0986717 )
------------------------------------------------------------
Parameters  : value       lower 90%   higher 90%
Photon index: 1.88715     ( -0.0986717   0.100206 )
Norm@50keV  : 3.59853E-03    ( -0.000202713   0.000201179 )
------------------------------------------------------------

Photon flux (15-150 keV)    in 94.12 sec: 0.513665 ( -0.027882  0.027972 ) ph/cm2/s
Energy fluence (15-150 keV)             : 3.11409e-06 ( -1.73722e-07  1.74818e-07 ) ergs/cm2
Cutoff power-law model
Time interval is from   -0.688 sec. to   93.428 sec.
 XSPEC: quit


Photon index: -1.58485     ( -0.356785   0.412856 )
------------------------------------------------------------
Parameters  : value       lower 90%   higher 90%
Photon index: 1.58485     ( -0.412856   0.356785 )
Epeak [keV] : 65.2889      ( -17.3191 -65.2889 )
Norm@50keV  : 5.16374E-03    ( -0.00167698   0.00320489 )
------------------------------------------------------------

Photon flux (15-150 keV)    in 94.12 sec: 0.503489 ( -0.030511  0.030588 ) ph/cm2/s
Energy fluence (15-150 keV)             : 3.03049e-06 ( -2.01622e-07  2.02189e-07 ) ergs/cm2
1-s peak spectrum fit
Power-law model
Time interval is from    1.496 sec. to    2.496 sec.
XSPEC12>exit
 XSPEC: quit


Photon index: -1.81829     ( -0.274608   0.25872 )
------------------------------------------------------------
Parameters  : value       lower 90%   higher 90%
Photon index: 1.81829     ( -0.25872   0.274608 )
Norm@50keV  : 1.34578E-02    ( -0.00213472   0.00207061 )
------------------------------------------------------------

Photon flux (15-150 keV)    in 1 sec: 1.86788 ( -0.26555  0.26672 ) ph/cm2/s
Energy fluence (15-150 keV)             : 1.2384e-07 ( -1.95698e-08  1.98214e-08 ) ergs/cm2
Cutoff power-law model
Time interval is from    1.496 sec. to    2.496 sec.
 XSPEC: quit


Photon index: -2.09405     ( -0.0459302   1.07111 )
------------------------------------------------------------
Parameters  : value       lower 90%   higher 90%
Photon index: 2.09405     ( -1.07111   0.0459302 )
Epeak [keV] : 39.7432      (   )
Norm@50keV  : 9.87667E-03    (     )
------------------------------------------------------------

Photon flux (15-150 keV)    in 1 sec: 1.71153 ( -0.38787  0.40356 ) ph/cm2/s
Energy fluence (15-150 keV)             : 1.2436e-07 ( -2.16577e-08  2.05672e-08 ) ergs/cm2
Time-resolved spectra
Distribution
T90 vs. Hardness ratio plot
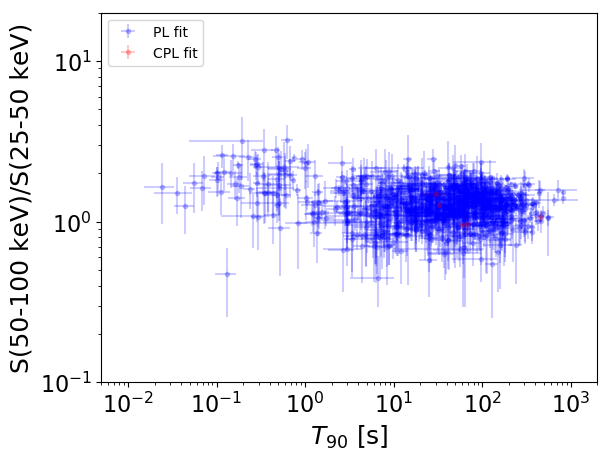
T90                                   = N/A sec.
Hardness ratio (energy fluence ratio) = N/A
S(15-50 keV) vs. S(50-150 keV) plot
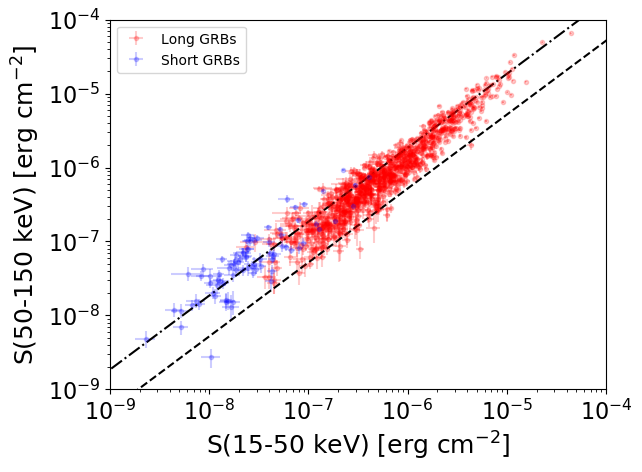
S(15-50 keV)  = N/A
S(50-150 keV) = N/A
The dash-dotted line and the dashed line traces the fluences calculated from the Band function with Epeak = 15 and 150 keV, respectively. Both lines assume a canonical values of alpha = -1 and beta = -2.5.
Mask shadow pattern
IMX = 2.648529634663633E-01, IMY = -4.866102318631486E-01
Spacecraft aspect plot

Bright source in the pre-burst/pre-slew/post-slew images
Pre-burst image of 15-350 keV band
Time interval of the image:
-110.299400 -0.688000

# RAcent  DECcent POSerr Theta    Phi  PeakCts   SNR AngSep     Name
#  [deg]    [deg]    ['] [deg]  [deg]                   [']
244.9767 -15.6343    0.3  21.6   65.7   7.4339  38.2    0.4	Sco X-1
255.9547 -38.0084   20.5   7.1  -39.3   0.1013   0.6   10.0	4U 1700-377
256.4285 -36.5817    6.5   5.7  -34.6   0.3006   1.8    9.5	GX 349+2
263.0896 -24.8776   26.6   7.5  128.3   0.0736   0.4    9.1	GX 1+4
264.7664 -44.3509    5.4  12.8  -83.7   0.3907   2.2    6.0	4U 1735-44
268.3696  -1.4490  127.1  31.4  125.3   0.0253   0.1    0.2	SW J1753.5-0127
270.4031 -25.1921    7.5  11.0  164.4   0.2466   1.6    9.4	GX 5-1
270.3063 -25.7543    2.9  10.6  166.5   0.6844   4.3    0.7	GRS 1758-258
273.8378 -13.9519    7.6  21.8  147.2   0.2760   1.5   11.0	GX 17+2
275.9233 -30.3722   91.1  13.3 -162.9  -0.0218  -0.1    0.3	H1820-303
285.0348 -24.9180   90.3  22.6 -171.9  -0.0225  -0.1    0.2	HT1900.1-2455
288.7891  10.9239   22.0  50.7  147.0   0.4285   0.5    1.4	GRS 1915+105
262.8627 -33.7574    4.1   2.6 -117.6   0.4445   2.8    7.8	GX 354-0
230.3407 -17.6144    2.2  30.8   40.7   1.1595   5.4 ------	UNKNOWN
248.2253 -74.9584    3.1  43.4  -65.3   3.0746   3.7 ------	UNKNOWN
Pre-slew background subtracted image of 15-350 keV band
Time interval of the image:
-0.688000 55.700610

# RAcent  DECcent POSerr Theta    Phi  PeakCts   SNR AngSep     Name
#  [deg]    [deg]    ['] [deg]  [deg]                   [']
244.9128 -15.5957    2.1  21.7   65.6  -0.8636  -5.6    4.7	Sco X-1
255.9841 -38.0011    8.6   7.1  -39.4  -0.1498  -1.3    9.4	4U 1700-377
256.3243 -36.2947    6.2   5.5  -32.1   0.2028   1.8    9.4	GX 349+2
263.1567 -24.6792    9.7   7.7  128.3   0.1385   1.2    9.0	GX 1+4
264.9989 -44.5063    3.5  13.0  -84.3  -0.4162  -3.3   11.5	4U 1735-44
268.5286  -1.5501    5.7  31.4  125.6   0.3861   2.0   11.3	SW J1753.5-0127
270.5038 -25.1504    0.0  11.1  164.6  -0.1613  -1.5   12.7	GX 5-1
270.2206 -25.9392    0.0  10.4  167.0  -0.3135  -2.9   12.6	GRS 1758-258
274.0176 -14.1842    5.4  21.7  147.9   0.2758   2.1    8.9	GX 17+2
275.8265 -30.2466    6.0  13.2 -163.5   0.2229   1.9    8.8	H1820-303
284.9264 -25.0455    8.1  22.5 -171.7   0.1775   1.4    9.6	HT1900.1-2455
288.8110  10.9695    6.8  50.8  147.0  -1.1621  -1.7    1.6	GRS 1915+105
262.9457 -33.8553    3.8   2.8 -117.0  -0.3360  -3.0    2.5	GX 354-0
238.7520 -11.0799    0.4  29.0   61.4   4.3211  25.8 ------	UNKNOWN
288.8260   3.6689    1.7  44.7  152.4   1.9563   6.8 ------	UNKNOWN
311.3018 -12.8661    2.3  50.2 -170.2   1.3890   4.9 ------	UNKNOWN
294.0941 -45.5359    2.1  29.2 -122.5   0.8320   5.4 ------	UNKNOWN
262.7658 -74.2951    2.3  42.3  -70.8   2.1783   5.1 ------	UNKNOWN
Post-slew image of 15-350 keV band
Time interval of the image:
193.500640 359.400600

# RAcent  DECcent POSerr Theta    Phi  PeakCts   SNR AngSep     Name
#  [deg]    [deg]    ['] [deg]  [deg]                   [']
244.9833 -15.6403    0.2   7.5   72.1  10.1213  50.7    0.2	Sco X-1
254.4627  35.3498 1522.2  48.7  -39.1  -0.0047  -0.0    0.5	Her X-1
255.9140 -37.9728   18.3  31.0   97.2  -0.2228  -0.6    8.4	4U 1700-377
256.6420 -36.4286   10.3  30.0   94.5   0.3957   1.1   10.0	GX 349+2
263.1162 -24.7608    4.7  26.8   67.9  -0.7368  -2.5    5.9	GX 1+4
264.7140 -44.5619    6.2  40.2   95.1   1.6028   1.9    6.8	4U 1735-44
268.5003  -1.4569    8.1  31.0   17.9  -0.3731  -1.4    7.9	SW J1753.5-0127
270.4404 -25.0445    6.2  33.0   63.3   0.7757   1.9    8.7	GX 5-1
270.2431 -25.6947    8.7  33.1   64.5   0.5653   1.3    4.3	GRS 1758-258
274.0536 -13.8655    9.3  34.5   42.3  -0.4488  -1.2   10.6	GX 17+2
275.7776 -30.2927    4.2  39.3   68.8  -1.9136  -2.8    8.8	H1820-303
288.8230  10.9039    8.2  54.3   11.7   1.1867   1.4    2.9	GRS 1915+105
263.0715 -33.7199   22.9  31.7   83.4  -0.1966  -0.5    8.0	GX 354-0
279.1838 -28.2253    2.8  41.4   64.3   3.0768   4.0 ------	UNKNOWN
280.9971 -18.3649    2.6  41.3   49.2   2.3186   4.5 ------	UNKNOWN
281.4431  14.2368    2.3  49.2    3.9   2.2085   5.1 ------	UNKNOWN
191.1914 -20.9229    3.5  46.7 -164.5   1.6320   3.3 ------	UNKNOWN
193.3505   4.8585    2.4  48.0 -129.1   5.9674   4.9 ------	UNKNOWN