Analysis Summary
Notes:
- 1) No attempt has been made to eliminate the non-significant decimal places.
- 2) This batgrbproduct analysis is done using the HEASARC data.
- 3) This batgrbproduct analysis is using the flight position for the mask-weighting calculation.
======================================================================
                  BAT GRB EVENT DATA PROCESSING REPORT
    Process Script Ver: batgrbproduct v2.47
    Process Start Time: Mon Jun 29 14:47:28 EDT 2020
             Host Name: bat1
   Current Working Dir: /local/data/bat1/alien/Swift_3rdBATcatalog/event/batevent_reproc/trigger976692
======================================================================

  Trigger: 00976692      Segment: 000

  BAT Trigger Time: 613330144   [s; MET]
      Trigger Stop: 613330208   [s; MET]
               UTC: 2020-06-08T17:28:38.919540    [includes UTCF correction]
       Where From?: TDRSS position message

  BAT
    RA: 309.628863589921   Dec: -31.1682990251738  [deg; J2000]

     Catalogged Source?: NO
     Point Source?:      YES
     GRB Indicated?:     YES    [ by BAT flight software ]
     Image S/N Ratio:    8.43
     Image Trigger?:     YES
     Rate S/N Ratio:     0  [ if not an image trigger ]
     Image S/N Ratio:    8.43

  Analysis Position:   [ source = BAT ]
    RA: 309.628863589921   Dec: -31.1682990251738  [deg; J2000]

  Refined Position:   [ source = BAT pre-slew burst ]
    RA: 309.624692527112   Dec: -31.1904932972864  [deg; J2000]
        { 20h 38m 29.9s , -31d 11' 25.8" }
         +/- 2.43695300538833 [arcmin] (estimated 90% radius based on SNR)
         +/- 1.14280529885613 [arcmin] (formal 1-sigma fit error)
    SNR: 8.52078462810548

  Angular difference between the analysis and refined position is 1.348760 arcmin

  Partial Coding Fraction: 0.5390625    [ including projection effects ]

  Duration
     T90: 121.552000045776 +/- 33.0062664770605
        Measured from: 20.6480000019073
                   to: 142.200000047684     [s; relative to TRIGTIME]
     T50: 53.37600004673 +/- 17.7610739340572
        Measured from: 31.4479999542236
                   to: 84.8240000009537     [s; relative to TRIGTIME]


  Fluence
     Peak Flux  (peak 1 second)
        Measured from: 67.8040000200272
                   to: 68.8040000200272     [s; relative to TRIGTIME]
     Total Fluence
        Measured from: 18.3279999494553
                   to: 161.175999999046     [s; relative to TRIGTIME]

             Band 1     Band 2     Band 3     Band 4
              15-25      25-50     50-100    100-350     keV
 Total     0.919689   1.033562   0.521118   0.083763
           0.123890   0.113356   0.095174   0.081632 [error]
 Peak      0.043293   0.032764   0.008715   0.007435
           0.010858   0.009966   0.007870   0.006556 [error]

     [ fluence units of on-axis counts / fully illuminated detector ]

======================================================================


====== Table of the duration information =============================

        Value   tstart    tstop
T100  142.848   18.328  161.176
T90   121.552   20.648  142.200
T50    53.376   31.448   84.824
Peak    1.000   67.804   68.804


====== Spectral Analysis Summary =====================================

Model      : spectral model: simple power-law (PL) and cutoff power-law (CPL)
Ph_index   : photon index: E^{Ph_index}
Ph_90err   : 90% error of the photon index
Epeak      : Epeak in keV
Epeak_90err: 90% error of Epeak
Norm       : normalization at 50 keV in both the PL model and CPL model
Nomr_90err : 90% error of the normalization
chi2       : Chi-Squared
dof        : degree of freedo

=== Time-averaged spectral analysis ===
(Best model with acceptable fit: PL)

Model Ph_index Ph_90err_low Ph_90err_hi  Epeak  Epeak_90err_low  Epeak_90err_hi  Norm       Nomr_90err_low    Norm_90err_hi    chi2    dof
PL      -2.037    -0.237      0.224       -           -               -         1.08e-03     -1.71e-04          1.68e-04      63.750   57
CPL     -0.607    -1.091      1.421       39.936     -11.958        12.386      7.30e-03     -7.30e-03          4.21e-02      58.400   56


=== 1-s peak spectral analysis ===
(Best model with acceptable fit: N/A)

Model Ph_index Ph_90err_low Ph_90err_hi  Epeak  Epeak_90err_low  Epeak_90err_hi  Norm       Nomr_90err_low    Norm_90err_hi    chi2    dof
PL      -2.443     -0.689     0.571       -           -               -         4.15e-03     -1.96e-03          1.99e-03      44.390   57
CPL     -1.000      N/A       N/A          80.000      N/A           N/A         1.01e-02        N/A               N/A         50.000   56


=== Fluence/Peak Flux Summary ===

              Model    Band1     Band2     Band3     Band4     Band5     Total
                       15-25     25-50    50-100    100-350    15-150    15-350    keV
Fluence         PL   3.28e-07  4.35e-07  4.24e-07  7.39e-07  1.43e-06  1.93e-06   erg/cm2
      90%_error_low -5.85e-08 -5.62e-08 -8.82e-08 -2.64e-07 -2.09e-07 -3.78e-07   erg/cm2
      90%_error_hi   6.04e-08  5.61e-08  9.05e-08  3.47e-07  2.14e-07  4.37e-07   erg/cm2
Peak flux       PL   4.26e-01  2.47e-01  9.07e-02  4.40e-02  7.87e-01  8.08e-01   ph/cm2/s
      90%_error_low -1.70e-01 -8.74e-02 -5.02e-02 -4.40e-02 -2.63e-01 -2.70e-01   ph/cm2/s
      90%_error_hi   1.78e-01  8.61e-02  5.99e-02  6.80e-02  2.63e-01  2.70e-01   ph/cm2/s

Fluence        CPL   2.89e-07  5.08e-07  3.88e-07  1.05e-07  1.27e-06  1.29e-06   erg/cm2
      90%_error_low -6.85e-08 -7.84e-08 -1.18e-07 -8.31e-08 -2.09e-07 -2.27e-07   erg/cm2
      90%_error_hi   6.86e-08  8.10e-08  1.11e-07  3.15e-07  2.33e-07  3.71e-07   erg/cm2
Peak flux      CPL   4.09e-01  3.23e-01  1.70e-02  8.46e-06  7.50e-01  7.50e-01   ph/cm2/s
      90%_error_low -1.88e-01     N/A   -1.70e-02 -8.46e-06 -2.56e-01 -2.57e-01   ph/cm2/s
      90%_error_hi   2.03e-01     N/A    9.65e-02  2.53e-02  2.57e-01  2.57e-01   ph/cm2/s

======================================================================
Image
Pre-slew 15.0-350.0 keV image (Event data)
#   RAcent    DECcent   POSerr    Theta     Phi              Peak Cts       SNR   Name
  309.6247   -31.1905   0.0224    35.7172  -145.3465         2.2556127      8.521 TRIG_00976692

Foreground time interval of the image:
 18.328 161.176 (delta_t = 142.848 [sec])
Background time interval of the image:
-239.000  18.328 (delta_t = 257.328 [sec])
Light Curves
Note: The mask-weighted lightcurves have units of either count/det or counts/sec/det, where a det is 0.4 x 0.4 = 0.16 sq cm.
Full-time range; 1 s binning
Other quick-look light curves:
- 64 ms binning (zoomed)
- 16 ms binning (zoomed)
- 8 ms binning (zoomed)
- 2 ms binning (zoomed)
- SN=5 or 10 s binning (full-time range)
- Raw light curve
Spectra
- 64 ms binning (zoomed)
- 16 ms binning (zoomed)
- 8 ms binning (zoomed)
- 2 ms binning (zoomed)
- SN=5 or 10 s binning (full-time range)
- Raw light curve
Spectra
Notes:
- 1) The fitting includes the systematic errors.
- 2) When the burst includes telescope slew time periods, the fitting uses an average response file made from multiple 5-s response files through out the slew time plus single time preiod for the non-slew times, and weighted by the total counts in the corresponding time period using addrmf. An average response file is needed becuase a spectral fit using the pre-slew DRM will introduce some errors in both a spectral shape and a normalization if the PHA file contains a lot of the slew/post-slew time interval.
- 3) For fits to more complicated models (e.g. a power-law over a cutoff power-law), the BAT team has decided to require a chi-square improvement of more than 6 for each extra dof.
Time averaged spectrum fit using the average DRM
Power-law model
Time interval is from   18.328 sec. to  161.176 sec.
XSPEC12>exit
 XSPEC: quit


Photon index: -2.03697     ( -0.236498   0.22386 )
------------------------------------------------------------
Parameters  : value       lower 90%   higher 90%
Photon index: 2.03697     ( -0.22386   0.236498 )
Norm@50keV  : 1.08313E-03    ( -0.000171268   0.000167917 )
------------------------------------------------------------

Photon flux (15-150 keV)    in 142.8 sec: 0.165308 ( -0.02151  0.021534 ) ph/cm2/s
Energy fluence (15-150 keV)             : 1.42981e-06 ( -2.0948e-07  2.13567e-07 ) ergs/cm2
Cutoff power-law model
Time interval is from   18.328 sec. to  161.176 sec.
 XSPEC: quit


Photon index: -0.607194     ( -1.09281   1.41895 )
------------------------------------------------------------
Parameters  : value       lower 90%   higher 90%
Photon index: 0.607194     ( -1.41895   1.09281 )
Epeak [keV] : 39.9361      ( -11.9574 12.3865 )
Norm@50keV  : 7.30349E-03    ( -0.00732737   0.0420911 )
------------------------------------------------------------

Photon flux (15-150 keV)    in 142.8 sec: 0.157351 ( -0.022172  0.022262 ) ph/cm2/s
Energy fluence (15-150 keV)             : 1.27036e-06 ( -2.09455e-07  2.32771e-07 ) ergs/cm2
1-s peak spectrum fit
Power-law model
Time interval is from   67.804 sec. to   68.804 sec.
XSPEC12>exit
 XSPEC: quit


Photon index: -2.44294     ( -0.686031   0.574285 )
------------------------------------------------------------
Parameters  : value       lower 90%   higher 90%
Photon index: 2.44294     ( -0.574285   0.686031 )
Norm@50keV  : 4.14740E-03    ( -0.00195517   0.00199545 )
------------------------------------------------------------

Photon flux (15-150 keV)    in 1 sec: 0.787236 ( -0.262658  0.262734 ) ph/cm2/s
Energy fluence (15-150 keV)             : 4.0846e-08 ( -1.52619e-08  1.64481e-08 ) ergs/cm2
Cutoff power-law model
Time interval is from   67.804 sec. to   68.804 sec.
 XSPEC: quit


Photon index: -1     (       )
------------------------------------------------------------
Parameters  : value       lower 90%   higher 90%
Photon index: 1.00000     (     )
Epeak [keV] : 80.0000      (   )
Norm@50keV  : 1.00528E-02    (     )
------------------------------------------------------------

Photon flux (15-150 keV)    in 1 sec: 0.749639 ( -0.255805  0.257441 ) ph/cm2/s
Energy fluence (15-150 keV)             : 0 ( 0  0 ) ergs/cm2
Time-resolved spectra
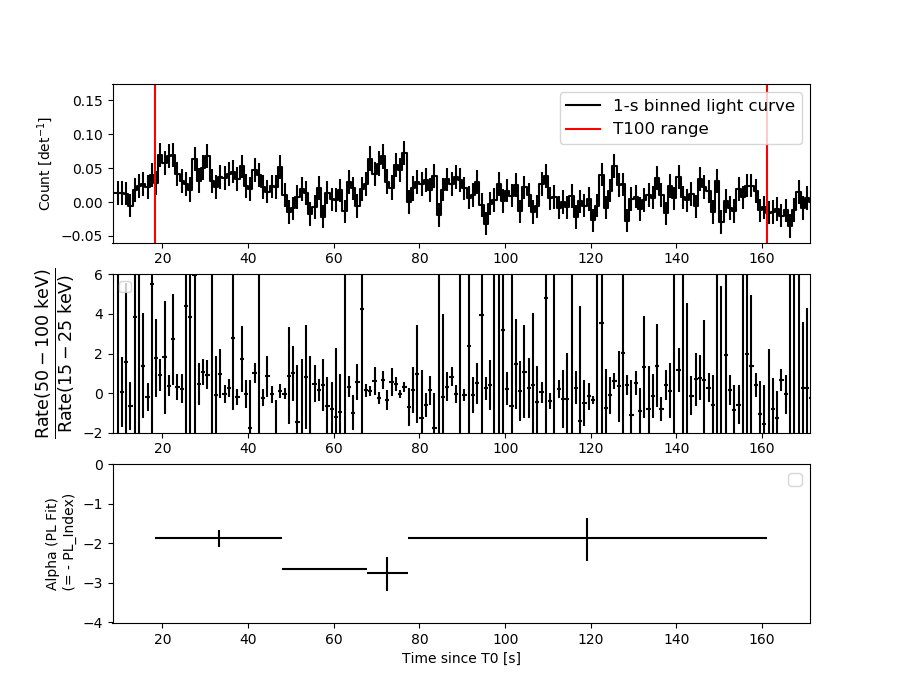
Distribution
T90 vs. Hardness ratio plot
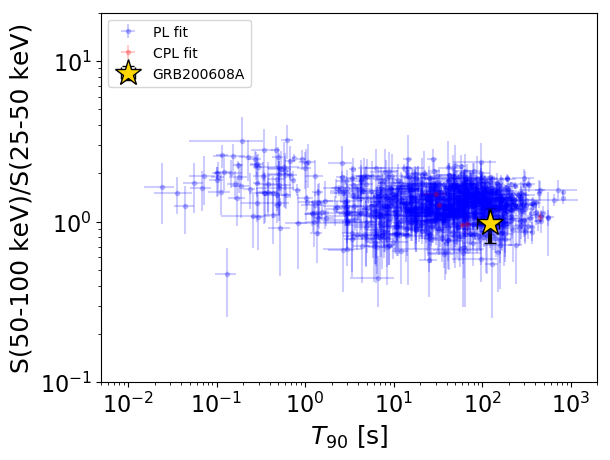
T90                                   = 121.552 sec.
Hardness ratio (energy fluence ratio) = 0.974720274471
S(15-50 keV) vs. S(50-150 keV) plot
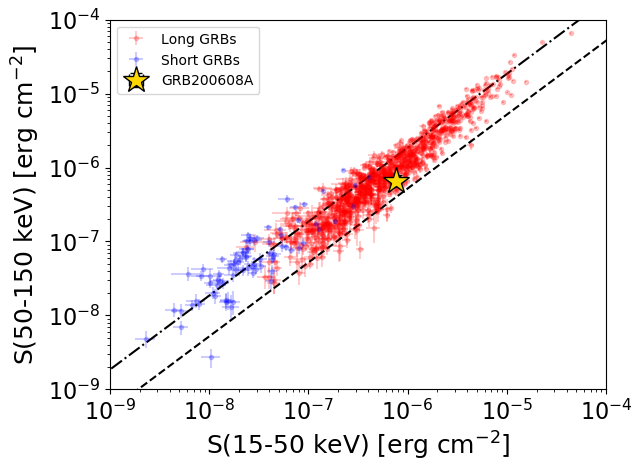
S(15-50 keV)  = 7.62811e-07
S(50-150 keV) = 6.67016e-07
The dash-dotted line and the dashed line traces the fluences calculated from the Band function with Epeak = 15 and 150 keV, respectively. Both lines assume a canonical values of alpha = -1 and beta = -2.5.
Mask shadow pattern
IMX = -5.914756500014403E-01, IMY = 4.088477922777994E-01
Spacecraft aspect plot
Bright source in the pre-burst/pre-slew/post-slew images
Pre-burst image of 15-350 keV band
Time interval of the image:
-239.000000 18.328000

# RAcent  DECcent POSerr Theta    Phi  PeakCts   SNR AngSep     Name
#  [deg]    [deg]    ['] [deg]  [deg]                   [']
244.9690 -15.6300    0.5  25.0   43.5   8.1741  22.4    0.9	Sco X-1
255.7603 -37.7311    0.0  14.6  -26.9  -0.0098  -0.0   12.7	4U 1700-377
256.4051 -36.3967    2.7  13.3  -23.8   1.3059   4.3    2.2	GX 349+2
262.8682 -24.8406   10.8   5.9   48.6   0.3082   1.1    9.6	GX 1+4
264.9534 -44.4993   11.8  16.9  -62.1   0.3355   1.0    9.5	4U 1735-44
268.3050  -1.3167   12.9  26.5  108.6  -0.3897  -0.9    9.0	SW J1753.5-0127
270.2839 -25.2070    3.3   3.1  140.2   1.2697   4.6    7.7	GX 5-1
270.3203 -25.6216    4.3   2.8  145.2   1.1134   4.0    7.4	GRS 1758-258
274.0358 -14.0873    4.9  14.7  130.6   0.7603   2.4    3.5	GX 17+2
276.0858 -30.3115    6.1   7.0 -138.7   0.5690   1.9    9.0	H1820-303
284.8184 -24.8577    0.0  14.9 -168.8   0.1412   0.5   12.4	HT1900.1-2455
288.9036  10.9057   10.3  43.5  138.9   1.1250   1.1    6.6	GRS 1915+105
262.9626 -33.8535    2.9   7.7  -33.8   1.1872   4.0    1.7	GX 354-0
325.7689 -40.8739    4.6  48.1 -129.6   3.6132   2.5 ------	UNKNOWN
229.0550 -69.2031    3.9  47.2  -53.0   4.2150   3.0 ------	UNKNOWN
Pre-slew background subtracted image of 15-350 keV band
Time interval of the image:
18.328000 161.176000

# RAcent  DECcent POSerr Theta    Phi  PeakCts   SNR AngSep     Name
#  [deg]    [deg]    ['] [deg]  [deg]                   [']
244.8146 -15.5305    0.0  25.2   43.5  -0.2664  -1.2   11.6	Sco X-1
256.0015 -37.7038    3.4  14.4  -27.3  -0.6106  -3.4    8.4	4U 1700-377
256.3135 -36.5937   18.6  13.5  -24.3  -0.1101  -0.6   11.8	GX 349+2
262.8899 -24.6219   19.1   6.0   50.5  -0.1070  -0.6    9.9	GX 1+4
264.9949 -44.5345    4.5  16.9  -62.2  -0.5050  -2.6   11.9	4U 1735-44
268.2003  -1.3954    3.0  26.5  108.4   0.9210   3.9   10.6	SW J1753.5-0127
270.4621 -25.0838    6.6   3.3  141.6  -0.3037  -1.7    9.7	GX 5-1
270.4604 -25.7598    3.9   2.7  149.0  -0.5276  -3.1    8.6	GRS 1758-258
274.1014 -13.8735    7.2  14.9  130.6  -0.3059  -1.6   11.2	GX 17+2
275.8009 -30.2500    6.1   6.8 -138.6   0.3345   1.9    9.5	H1820-303
284.9560 -24.7947   13.8  15.0 -168.9   0.1424   0.8    8.7	HT1900.1-2455
288.8523  10.9092    7.4  43.5  138.8  -0.8100  -1.6    3.9	GRS 1915+105
262.8434 -33.9532    4.7   7.8  -33.7  -0.4336  -2.5   10.2	GX 354-0
245.5332   6.5816    3.0  41.0   72.8   3.1336   3.9 ------	UNKNOWN
205.6401 -32.7550    2.2  53.7   -2.7   2.5547   5.2 ------	UNKNOWN
309.6247 -31.1905    1.3  35.7 -145.3   2.2557   8.5 ------	UNKNOWN
328.7283 -17.4228    1.9  56.0 -157.9   5.3357   6.2 ------	UNKNOWN
Post-slew image of 15-350 keV band
Time interval of the image:
845.200600 963.119700

# RAcent  DECcent POSerr Theta    Phi  PeakCts   SNR AngSep     Name
#  [deg]    [deg]    ['] [deg]  [deg]                   [']
170.4932 -60.6823    4.4  55.9   -3.6  -1.5119  -2.6    6.3	Cen X-3
186.6515 -62.7561    3.2  50.1    3.1   1.4181   3.6    0.9	GX 301-2
255.9677 -37.6858   14.3  36.9   73.0   0.3531   0.8    9.5	4U 1700-377
256.3659 -36.4348  208.2  37.7   74.7   0.0264   0.1    3.4	GX 349+2
264.7359 -44.4501   89.9  27.5   73.1   0.0331   0.1    0.3	4U 1735-44
270.2867 -25.2593    0.0  40.4  100.4   0.8070   1.3   10.8	GX 5-1
270.2895 -25.6527    5.4  40.0  100.1   1.3505   2.2    5.5	GRS 1758-258
275.9087 -30.3081    9.4  33.6  104.0   0.3672   1.2    3.6	H1820-303
284.9624 -24.8830   19.3  35.7  120.7  -0.2104  -0.6    4.6	HT1900.1-2455
262.9000 -33.8796   12.7  36.4   84.3   0.3828   0.9    5.2	GX 354-0
252.5182 -35.3359    2.9  40.5   72.0   2.5451   4.0 ------	UNKNOWN
289.2890 -27.4603    2.2  32.1  126.1   1.3232   5.1 ------	UNKNOWN
173.6185 -60.6377    2.8  55.2   -1.9   2.0952   4.1 ------	UNKNOWN
164.6679 -83.2990    2.5  37.4  -21.8   0.9415   4.6 ------	UNKNOWN
352.2885 -48.6910    2.8  29.6 -115.8   0.9714   4.2 ------	UNKNOWN