Analysis Summary
Notes:
- 1) No attempt has been made to eliminate the non-significant decimal places.
- 2) This batgrbproduct analysis is done using the HEASARC data.
- 3) This batgrbproduct analysis is using the flight position for the mask-weighting calculation.
======================================================================
BAT GRB EVENT DATA PROCESSING REPORT
Process Script Ver: batgrbproduct v2.47
Process Start Time: Mon Jun 29 14:37:13 EDT 2020
Host Name: bat1
Current Working Dir: /local/data/bat1/alien/Swift_3rdBATcatalog/event/batevent_reproc/trigger977310
======================================================================
Trigger: 00977310 Segment: 000
BAT Trigger Time: 613629602.24 [s; MET]
Trigger Stop: 613629604.288 [s; MET]
UTC: 2020-06-12T04:39:37.140020 [includes UTCF correction]
Where From?: TDRSS position message
BAT
RA: 302.681184324407 Dec: -45.3569592690613 [deg; J2000]
Catalogged Source?: NO
Point Source?: YES
GRB Indicated?: YES [ by BAT flight software ]
Image S/N Ratio: 8.04
Image Trigger?: NO
Rate S/N Ratio: 10.0995049383621 [ if not an image trigger ]
Image S/N Ratio: 8.04
Analysis Position: [ source = BAT ]
RA: 302.681184324407 Dec: -45.3569592690613 [deg; J2000]
Refined Position: [ source = BAT pre-slew burst ]
RA: 302.704308896624 Dec: -45.3484016389431 [deg; J2000]
{ 20h 10m 49.0s , -45d 20' 54.2" }
+/- 1.26302697009246 [arcmin] (estimated 90% radius based on SNR)
+/- 0.419621573438143 [arcmin] (formal 1-sigma fit error)
SNR: 21.7892961828355
Angular difference between the analysis and refined position is 1.101967 arcmin
Partial Coding Fraction: 0.96875 [ including projection effects ]
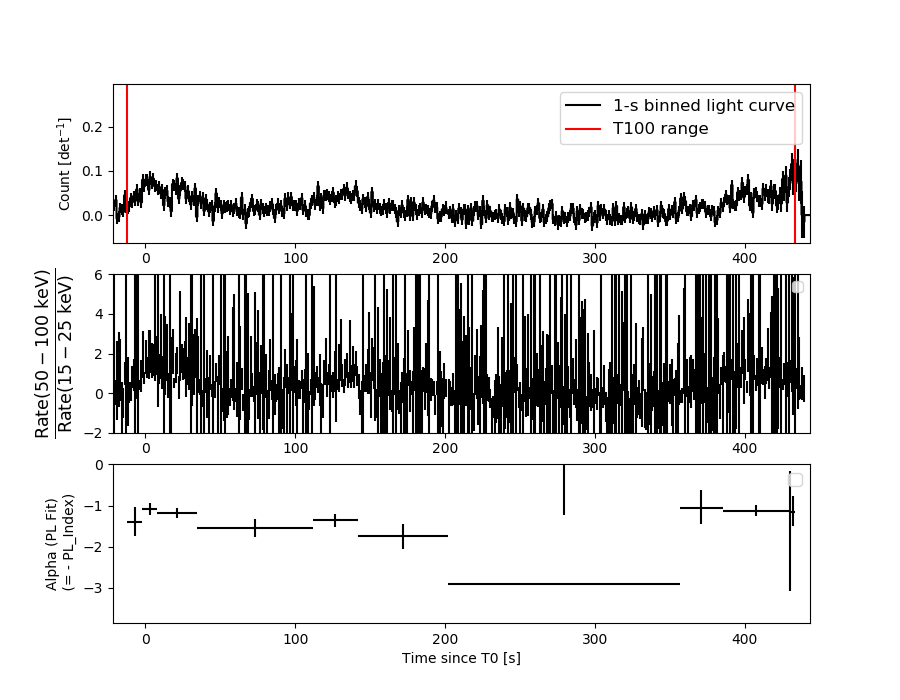
Duration
T90: 425.923999905586 +/- 7.26613241710644
Measured from: -1.2039999961853
to: 424.719999909401 [s; relative to TRIGTIME]
T50: 362.324000000954 +/- 20.3069293365221
Measured from: 28.2639999389648
to: 390.587999939919 [s; relative to TRIGTIME]
Fluence
Peak Flux (peak 1 second)
Measured from: 432.432000041008
to: 433.432000041008 [s; relative to TRIGTIME]
Total Fluence
Measured from: -11.9160000085831
to: 433.432000041008 [s; relative to TRIGTIME]
Band 1 Band 2 Band 3 Band 4
15-25 25-50 50-100 100-350 keV
Total 2.326088 3.093774 2.730671 0.667872
0.137391 0.140713 0.127178 0.123017 [error]
Peak 0.012598 0.064282 0.041598 0.030899
0.014024 0.015774 0.014400 0.014362 [error]
[ fluence units of on-axis counts / fully illuminated detector ]
======================================================================
====== Table of the duration information =============================
Value tstart tstop
T100 445.348 -11.916 433.432
T90 425.924 -1.204 424.720
T50 362.324 28.264 390.588
Peak 1.000 432.432 433.432
====== Spectral Analysis Summary =====================================
Model : spectral model: simple power-law (PL) and cutoff power-law (CPL)
Ph_index : photon index: E^{Ph_index}
Ph_90err : 90% error of the photon index
Epeak : Epeak in keV
Epeak_90err: 90% error of Epeak
Norm : normalization at 50 keV in both the PL model and CPL model
Nomr_90err : 90% error of the normalization
chi2 : Chi-Squared
dof : degree of freedo
=== Time-averaged spectral analysis ===
(Best model with acceptable fit: PL)
Model Ph_index Ph_90err_low Ph_90err_hi Epeak Epeak_90err_low Epeak_90err_hi Norm Nomr_90err_low Norm_90err_hi chi2 dof
PL -1.386 -0.091 0.090 - - - 1.29e-03 -6.34e-05 6.33e-05 52.680 57
CPL -1.051 -0.330 0.383 148.171 -52.737 -148.171 1.87e-03 -5.93e-04 9.52e-04 50.050 56
=== 1-s peak spectral analysis ===
(Best model with acceptable fit: PL)
Model Ph_index Ph_90err_low Ph_90err_hi Epeak Epeak_90err_low Epeak_90err_hi Norm Nomr_90err_low Norm_90err_hi chi2 dof
PL -1.216 -0.583 0.613 - - - 8.38e-03 -2.98e-03 2.98e-03 46.200 57
CPL 0.131 -7.360 5.112 82.741 N/A N/A 3.77e-02 N/A N/A 45.320 56
=== Fluence/Peak Flux Summary ===
Model Band1 Band2 Band3 Band4 Band5 Total
15-25 25-50 50-100 100-350 15-150 15-350 keV
Fluence PL 6.57e-07 1.30e-06 1.98e-06 6.63e-06 5.55e-06 1.06e-05 erg/cm2
90%_error_low -5.93e-08 -6.94e-08 -1.25e-07 -8.94e-07 -3.05e-07 -9.84e-07 erg/cm2
90%_error_hi 6.11e-08 6.91e-08 1.25e-07 9.90e-07 3.07e-07 1.06e-06 erg/cm2
Peak flux PL 2.63e-01 3.13e-01 2.70e-01 3.96e-01 9.86e-01 1.24e+00 ph/cm2/s
90%_error_low -1.51e-01 -1.31e-01 -1.09e-01 -2.46e-01 -3.60e-01 -4.41e-01 ph/cm2/s
90%_error_hi 1.86e-01 1.28e-01 1.07e-01 4.11e-01 3.63e-01 4.68e-01 ph/cm2/s
Fluence CPL 6.13e-07 1.33e-06 2.03e-06 4.09e-06 5.40e-06 8.06e-06 erg/cm2
90%_error_low -7.42e-08 -7.86e-08 -1.36e-07 -1.53e-06 -3.44e-07 -1.56e-06 erg/cm2
90%_error_hi 7.55e-08 7.98e-08 1.38e-07 2.49e-06 3.44e-07 2.56e-06 erg/cm2
Peak flux CPL 2.00e-01 3.49e-01 3.05e-01 1.27e-01 9.43e-01 9.79e-01 ph/cm2/s
90%_error_low -2.00e-01 -1.56e-01 N/A -1.27e-01 -3.63e-01 -3.97e-01 ph/cm2/s
90%_error_hi 2.15e-01 1.75e-01 N/A 3.94e-01 3.72e-01 5.43e-01 ph/cm2/s
======================================================================
Image
Pre-slew 15.0-350.0 keV image (Event data)
#   RAcent    DECcent   POSerr    Theta     Phi              Peak Cts       SNR   Name
  302.7043   -45.3484   0.0088    15.5949    33.1390         1.8240761     21.789 TRIG_00977310

Foreground time interval of the image:
-11.916  23.861 (delta_t =  35.777 [sec])
Background time interval of the image:
-234.939 -11.916 (delta_t = 223.023 [sec])
Light Curves
Note: The mask-weighted lightcurves have units of either count/det or counts/sec/det, where a det is 0.4 x 0.4 = 0.16 sq cm.
Full-time range; 1 s binning
Other quick-look light curves:
- 64 ms binning (zoomed)
- 16 ms binning (zoomed)
- 8 ms binning (zoomed)
- 2 ms binning (zoomed)
- SN=5 or 10 s binning (full-time range)
- Raw light curve
Spectra
- 64 ms binning (zoomed)
- 16 ms binning (zoomed)
- 8 ms binning (zoomed)
- 2 ms binning (zoomed)
- SN=5 or 10 s binning (full-time range)
- Raw light curve
Spectra
Notes:
- 1) The fitting includes the systematic errors.
- 2) When the burst includes telescope slew time periods, the fitting uses an average response file made from multiple 5-s response files through out the slew time plus single time preiod for the non-slew times, and weighted by the total counts in the corresponding time period using addrmf. An average response file is needed becuase a spectral fit using the pre-slew DRM will introduce some errors in both a spectral shape and a normalization if the PHA file contains a lot of the slew/post-slew time interval.
- 3) For fits to more complicated models (e.g. a power-law over a cutoff power-law), the BAT team has decided to require a chi-square improvement of more than 6 for each extra dof.
Time averaged spectrum fit using the average DRM
Power-law model
Multiple GTIs in the spectrum
tstart tstop
-11.916000 200.328000
201.760000 433.432000
XSPEC12>exit
 XSPEC: quit


Photon index: -1.38569     ( -0.0905225   0.0904758 )
------------------------------------------------------------
Parameters  : value       lower 90%   higher 90%
Photon index: 1.38569     ( -0.0904758   0.0905225 )
Norm@50keV  : 1.29071E-03    ( -6.34442e-05   6.33405e-05 )
------------------------------------------------------------

Photon flux (15-150 keV)    in 443.9 sec: 0.156685 ( -0.007882  0.007894 ) ph/cm2/s
Energy fluence (15-150 keV)             : 5.55337e-06 ( -3.04746e-07  3.066e-07 ) ergs/cm2
Cutoff power-law model
Multiple GTIs in the spectrum
tstart tstop
-11.916000 200.328000
201.760000 433.432000
 XSPEC: quit


Photon index: -1.05098     ( -0.330061   0.383139 )
------------------------------------------------------------
Parameters  : value       lower 90%   higher 90%
Photon index: 1.05098     ( -0.383139   0.330061 )
Epeak [keV] : 148.171      ( -52.7373 -148.171 )
Norm@50keV  : 1.86957E-03    ( -0.000593355   0.00095221 )
------------------------------------------------------------

Photon flux (15-150 keV)    in 443.9 sec: 0.153479 ( -0.008563  0.008547 ) ph/cm2/s
Energy fluence (15-150 keV)             : 5.40164e-06 ( -3.445e-07  3.44485e-07 ) ergs/cm2
1-s peak spectrum fit
Power-law model
Time interval is from  432.432 sec. to  433.432 sec.
XSPEC12>exit
 XSPEC: quit


Photon index: -1.21595     ( -0.582462   0.613349 )
------------------------------------------------------------
Parameters  : value       lower 90%   higher 90%
Photon index: 1.21595     ( -0.613349   0.582462 )
Norm@50keV  : 8.38064E-03    ( -0.00297593   0.00297969 )
------------------------------------------------------------

Photon flux (15-150 keV)    in 1 sec: 0.986008 ( -0.36006  0.363382 ) ph/cm2/s
Energy fluence (15-150 keV)             : 8.46525e-08 ( -3.20919e-08  3.27832e-08 ) ergs/cm2
Cutoff power-law model
Time interval is from  432.432 sec. to  433.432 sec.
 XSPEC: quit


Photon index: 0.131218     ( -7.36045   5.11153 )
------------------------------------------------------------
Parameters  : value       lower 90%   higher 90%
Photon index: -0.131218     ( -5.11153   7.36045 )
Epeak [keV] : 82.7414      (   )
Norm@50keV  : 3.76766E-02    (     )
------------------------------------------------------------

Photon flux (15-150 keV)    in 1 sec: 0.943266 ( -0.363306  0.371504 ) ph/cm2/s
Energy fluence (15-150 keV)             : 7.82438e-08 ( -3.50133e-08  3.53514e-08 ) ergs/cm2
Time-resolved spectra
Distribution
T90 vs. Hardness ratio plot
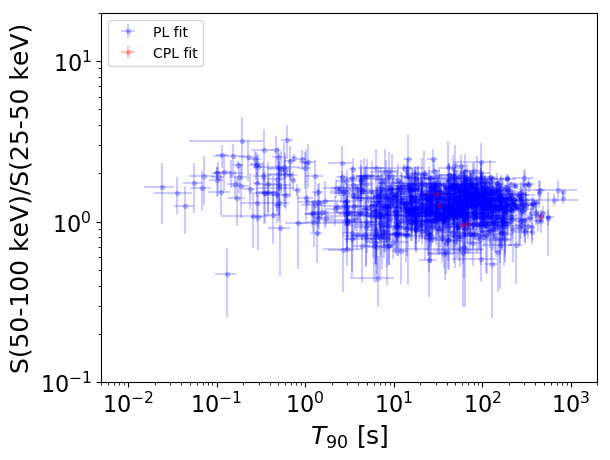
T90                                   = N/A sec.
Hardness ratio (energy fluence ratio) = N/A
S(15-50 keV) vs. S(50-150 keV) plot
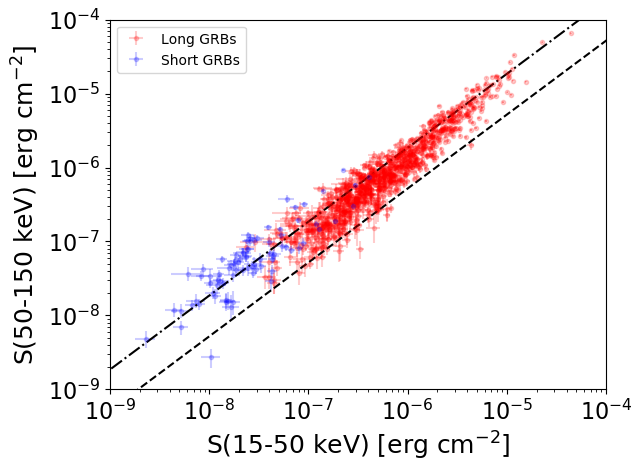
S(15-50 keV)  = N/A
S(50-150 keV) = N/A
The dash-dotted line and the dashed line traces the fluences calculated from the Band function with Epeak = 15 and 150 keV, respectively. Both lines assume a canonical values of alpha = -1 and beta = -2.5.
Mask shadow pattern
IMX = 2.337107950976979E-01, IMY = -1.525807502577834E-01
Spacecraft aspect plot
Bright source in the pre-burst/pre-slew/post-slew images
Pre-burst image of 15-350 keV band
Time interval of the image:
-234.939410 -11.916000

# RAcent  DECcent POSerr Theta    Phi  PeakCts   SNR AngSep     Name
#  [deg]    [deg]    ['] [deg]  [deg]                   [']
264.5296 -44.4666    4.5  37.8   70.0   1.9923   2.5    9.2	4U 1735-44
270.2293 -24.9710    7.1  35.3  103.7   1.0128   1.6    7.1	GX 5-1
270.4327 -25.8641    4.5  34.9  102.3  -1.5424  -2.6   10.1	GRS 1758-258
274.0279 -14.0057   40.4  36.9  123.1   0.2012   0.3    2.2	GX 17+2
275.8213 -30.4624    7.1  29.2   96.0   0.7055   1.6    7.8	H1820-303
284.8728 -24.9423   25.2  22.8  112.9   0.1659   0.5    9.0	HT1900.1-2455
288.6924  10.8958   10.1  46.4  164.9   0.8710   1.1    6.9	GRS 1915+105
263.0062 -33.7600    3.8  39.4   87.1   3.4886   3.0    4.6	GX 354-0
256.7581 -74.0997    2.7  50.7   30.6   4.8549   4.2 ------	UNKNOWN
352.5999 -82.6056    2.4  53.9    8.0   4.1884   4.8 ------	UNKNOWN
 32.4585 -72.6478    2.4  58.6   -6.1   7.3592   4.8 ------	UNKNOWN
334.9011 -48.2769    3.4  25.9  -26.1   1.0208   3.4 ------	UNKNOWN
 12.9987 -63.5998    2.8  50.9  -16.6   2.4542   4.1 ------	UNKNOWN
339.6037 -21.6047    2.6  28.1  -87.6   1.8384   4.4 ------	UNKNOWN
  6.8600 -36.1815    3.4  47.2  -53.2   4.4558   3.4 ------	UNKNOWN
Pre-slew background subtracted image of 15-350 keV band
Time interval of the image:
-11.916000 23.860600

# RAcent  DECcent POSerr Theta    Phi  PeakCts   SNR AngSep     Name
#  [deg]    [deg]    ['] [deg]  [deg]                   [']
264.7550 -44.5756    6.0  37.7   69.8  -0.4178  -1.9    7.6	4U 1735-44
270.4409 -25.1408    7.6  35.1  103.5  -0.2847  -1.5    9.3	GX 5-1
270.4135 -25.8719    4.1  34.9  102.3   0.5261   2.9    9.8	GRS 1758-258
273.9949 -14.1584    7.4  36.8  122.9   0.3054   1.6    7.4	GX 17+2
275.7438 -30.4485   11.0  29.2   96.0  -0.1445  -1.0   10.6	H1820-303
284.9413 -24.7989    9.0  22.8  113.3   0.1329   1.3    8.9	HT1900.1-2455
288.7137  10.8024    6.0  46.3  164.9  -0.3974  -1.9    9.9	GRS 1915+105
263.0284 -33.9611    4.7  39.3   86.8  -0.8049  -2.4    7.8	GX 354-0
302.7043 -45.3484    0.5  15.6   33.1   1.8241  21.8 ------	UNKNOWN
347.3586 -22.7962    1.9  34.3  -80.0   1.0861   6.0 ------	UNKNOWN
Post-slew image of 15-350 keV band
Time interval of the image:
75.460600 200.328000
201.760000 376.260600

# RAcent  DECcent POSerr Theta    Phi  PeakCts   SNR AngSep     Name
#  [deg]    [deg]    ['] [deg]  [deg]                   [']
256.1157 -37.7680   13.5  35.1   66.8   0.5412   0.8    7.6	4U 1700-377
256.3908 -36.3921    8.4  35.6   69.0   0.9475   1.4    2.8	GX 349+2
262.7991 -24.7307    0.0  38.0   90.3   0.9960   0.8   11.5	GX 1+4
264.7418 -44.2383    0.0  26.7   59.8   0.7658   1.7   12.7	4U 1735-44
270.1329 -25.1345   11.3  33.0   97.8   0.6183   1.0    8.9	GX 5-1
270.2730 -25.7226    2.9  32.5   97.2   2.3458   4.0    2.0	GRS 1758-258
274.0597 -14.2022    0.0  39.4  114.1  -1.6330  -1.6   10.4	GX 17+2
275.9183 -30.3335  176.0  25.7   97.6   0.0294   0.1    2.0	H1820-303
285.0346 -25.0764    6.2  24.8  120.2  -0.8109  -1.9    9.4	HT1900.1-2455
262.8213 -33.8451    4.8  32.4   77.8   1.4238   2.4    8.4	GX 354-0
198.5501 -68.3262    2.3  53.3    7.6   4.6341   5.1 ------	UNKNOWN
231.0129 -70.1071    3.0  41.9   10.0   1.8009   3.8 ------	UNKNOWN
302.7263 -45.3407    1.0   0.1 -134.3   3.6836  12.0 ------	UNKNOWN
347.3675 -74.3233    2.9  34.9  -38.3   1.7623   3.9 ------	UNKNOWN
340.1052  -4.8362    3.1  52.0 -148.6   4.3260   3.7 ------	UNKNOWN
358.2000 -52.5495    2.9  36.2  -76.9   3.1855   4.0 ------	UNKNOWN
352.7056 -32.8906    3.9  40.1 -109.1   3.3991   2.9 ------	UNKNOWN
345.5041  -8.1948    3.3  52.3 -140.6   5.5062   3.5 ------	UNKNOWN