Analysis Summary
Notes:
- 1) No attempt has been made to eliminate the non-significant decimal places.
- 2) This batgrbproduct analysis is done using the HEASARC data.
- 3) This batgrbproduct analysis is using the flight position for the mask-weighting calculation.
======================================================================
                  BAT GRB EVENT DATA PROCESSING REPORT
    Process Script Ver: batgrbproduct v2.47
    Process Start Time: Wed Jul 22 21:56:44 EDT 2020
             Host Name: bat1
   Current Working Dir: /local/data/bat1/alien/Swift_3rdBATcatalog/event/batevent_reproc/trigger980421
======================================================================

  Trigger: 00980421      Segment: 000

  BAT Trigger Time: 615300444.288   [s; MET]
      Trigger Stop: 615300446.336   [s; MET]
               UTC: 2020-07-01T12:46:59.079040    [includes UTCF correction]
       Where From?: TDRSS position message

  BAT
    RA: 123.554730695954   Dec: -14.4938413543113  [deg; J2000]

     Catalogged Source?: NO
     Point Source?:      YES
     GRB Indicated?:     YES    [ by BAT flight software ]
     Image S/N Ratio:    7.22
     Image Trigger?:     NO
     Rate S/N Ratio:     9  [ if not an image trigger ]
     Image S/N Ratio:    7.22

  Analysis Position:   [ source = BAT ]
    RA: 123.554730695954   Dec: -14.4938413543113  [deg; J2000]

  Refined Position:   [ source = BAT pre-slew burst ]
    RA: 123.566684878342   Dec: -14.5336398394491  [deg; J2000]
        { 08h 14m 16.0s , -14d 32' 01.1" }
         +/- 1.5225831988995 [arcmin] (estimated 90% radius based on SNR)
         +/- 0.703721835831624 [arcmin] (formal 1-sigma fit error)
    SNR: 16.6835448249642

  Angular difference between the analysis and refined position is 2.486815 arcmin

  Partial Coding Fraction: 0.7734375    [ including projection effects ]

  Duration
     T90: 38.7799999713898 +/- 8.71284933029988
        Measured from: -5.12000000476837
                   to: 33.6599999666214     [s; relative to TRIGTIME]
     T50: 14.2719999551773 +/- 4.4944823660938
        Measured from: 0.00800001621246338
                   to: 14.2799999713898     [s; relative to TRIGTIME]


  Fluence
     Peak Flux  (peak 1 second)
        Measured from: -1.72000002861023
                   to: -0.720000028610229     [s; relative to TRIGTIME]
     Total Fluence
        Measured from: -6.80799996852875
                   to: 42.1679999828339     [s; relative to TRIGTIME]

             Band 1     Band 2     Band 3     Band 4
              15-25      25-50     50-100    100-350     keV
 Total     0.635745   0.723826   0.320723   0.084487
           0.052164   0.053219   0.045229   0.039122 [error]
 Peak      0.029909   0.038926   0.017303   0.018803
           0.007807   0.007707   0.006855   0.005735 [error]

     [ fluence units of on-axis counts / fully illuminated detector ]

======================================================================


====== Table of the duration information =============================

        Value   tstart    tstop
T100   48.976   -6.808   42.168
T90    38.780   -5.120   33.660
T50    14.272    0.008   14.280
Peak    1.000   -1.720   -0.720


====== Spectral Analysis Summary =====================================

Model      : spectral model: simple power-law (PL) and cutoff power-law (CPL)
Ph_index   : photon index: E^{Ph_index}
Ph_90err   : 90% error of the photon index
Epeak      : Epeak in keV
Epeak_90err: 90% error of Epeak
Norm       : normalization at 50 keV in both the PL model and CPL model
Nomr_90err : 90% error of the normalization
chi2       : Chi-Squared
dof        : degree of freedo

=== Time-averaged spectral analysis ===
(Best model with acceptable fit: PL)

Model Ph_index Ph_90err_low Ph_90err_hi  Epeak  Epeak_90err_low  Epeak_90err_hi  Norm       Nomr_90err_low    Norm_90err_hi    chi2    dof
PL      -1.938    -0.168      0.162       -           -               -         2.06e-03     -2.28e-04          2.24e-04      67.110   57
CPL     -1.519    -0.644      0.834       45.743      N/A           N/A         3.66e-03        N/A               N/A         65.960   56


=== 1-s peak spectral analysis ===
(Best model with acceptable fit: PL)

Model Ph_index Ph_90err_low Ph_90err_hi  Epeak  Epeak_90err_low  Epeak_90err_hi  Norm       Nomr_90err_low    Norm_90err_hi    chi2    dof
PL      -1.652     -0.443     0.435       -           -               -         5.65e-03     -1.56e-03          1.50e-03      57.290   57
CPL     -1.651      N/A       N/A        9999.250      N/A           N/A         5.66e-03        N/A               N/A         57.300   56


=== Fluence/Peak Flux Summary ===

              Model    Band1     Band2     Band3     Band4     Band5     Total
                       15-25     25-50    50-100    100-350    15-150    15-350    keV
Fluence         PL   1.94e-07  2.74e-07  2.86e-07  5.48e-07  9.26e-07  1.30e-06   erg/cm2
      90%_error_low -2.42e-08 -2.42e-08 -4.28e-08 -1.47e-07 -9.85e-08 -1.98e-07   erg/cm2
      90%_error_hi   2.47e-08  2.42e-08  4.36e-08  1.81e-07  1.01e-07  2.24e-07   erg/cm2
Peak flux       PL   2.69e-01  2.47e-01  1.58e-01  1.54e-01  7.38e-01  8.28e-01   ph/cm2/s
      90%_error_low -9.79e-02 -6.06e-02 -5.47e-02 -8.40e-02 -1.79e-01 -2.05e-01   ph/cm2/s
      90%_error_hi   1.03e-01  6.03e-02  5.56e-02  1.35e-01  1.79e-01  2.09e-01   ph/cm2/s

Fluence        CPL   1.89e-07  2.88e-07  2.76e-07  2.41e-07  8.77e-07  9.95e-07   erg/cm2
      90%_error_low -2.60e-08 -3.25e-08 -5.57e-08 -1.76e-07 -1.24e-07 -2.23e-07   erg/cm2
      90%_error_hi   2.60e-08  3.51e-08  4.86e-08  3.94e-07  1.26e-07  4.57e-07   erg/cm2
Peak flux      CPL   2.73e-01  2.45e-01  1.57e-01  1.55e-01  7.38e-01  8.19e-01   ph/cm2/s
      90%_error_low -1.02e-01 -5.74e-02 -5.41e-02 -9.76e-02 -1.78e-01 -3.38e-01   ph/cm2/s
      90%_error_hi   9.95e-02  7.26e-02  5.63e-02  6.26e-02  1.79e-01  2.14e-01   ph/cm2/s

======================================================================
Image
Pre-slew 15.0-350.0 keV image (Event data)
#   RAcent    DECcent   POSerr    Theta     Phi              Peak Cts       SNR   Name
  123.5667   -14.5336   0.0116    19.5769   -65.1888         1.7623687     16.684 TRIG_00980421

Foreground time interval of the image:
 -6.808  42.168 (delta_t =  48.976 [sec])
Background time interval of the image:
-239.288  -6.808 (delta_t = 232.480 [sec])
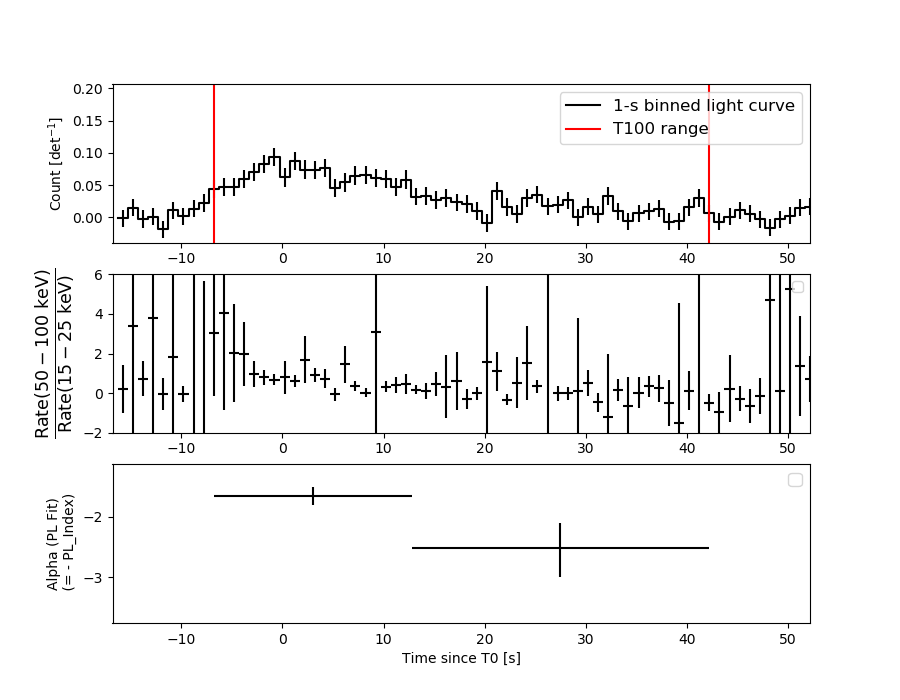
Light Curves
Note: The mask-weighted lightcurves have units of either count/det or counts/sec/det, where a det is 0.4 x 0.4 = 0.16 sq cm.
Full-time range; 1 s binning
Other quick-look light curves:
- 64 ms binning (zoomed)
- 16 ms binning (zoomed)
- 8 ms binning (zoomed)
- 2 ms binning (zoomed)
- SN=5 or 10 s binning (full-time range)
- Raw light curve
Spectra
- 64 ms binning (zoomed)
- 16 ms binning (zoomed)
- 8 ms binning (zoomed)
- 2 ms binning (zoomed)
- SN=5 or 10 s binning (full-time range)
- Raw light curve
Spectra
Notes:
- 1) The fitting includes the systematic errors.
- 2) When the burst includes telescope slew time periods, the fitting uses an average response file made from multiple 5-s response files through out the slew time plus single time preiod for the non-slew times, and weighted by the total counts in the corresponding time period using addrmf. An average response file is needed becuase a spectral fit using the pre-slew DRM will introduce some errors in both a spectral shape and a normalization if the PHA file contains a lot of the slew/post-slew time interval.
- 3) For fits to more complicated models (e.g. a power-law over a cutoff power-law), the BAT team has decided to require a chi-square improvement of more than 6 for each extra dof.
Time averaged spectrum fit using the average DRM
Power-law model
Time interval is from   -6.808 sec. to   42.168 sec.

Spectral model in power-law:
------------------------------------------------------------
Parameters  : value       lower 90%   higher 90%
Photon index: -1.93816     ( -0.168107   0.162118 )
Norm@50keV  : 2.05555E-03    ( -0.000228242   0.000224231 )
------------------------------------------------------------
#Fit statistic  : Chi-Squared                   67.11     using 59 bins.
 Reduced chi-squared = 1.13746
# Null hypothesis probability of 1.69e-01 with 57 degrees of freedom

Photon flux (15-150 keV)    in 48.98 sec: 0.299908 ( -0.026494  0.026498 ) ph/cm2/s
Energy fluence (15-150 keV)             : 9.26403e-07 ( -9.85203e-08  1.00499e-07 ) ergs/cm2
Cutoff power-law model
Time interval is from   -6.808 sec. to   42.168 sec.
Spectral model in the cutoff power-law:
------------------------------------------------------------
Parameters  : value       lower 90%   higher 90%
Photon index: -1.5193     ( -0.644622   0.833739 )
Epeak [keV] : 45.7428      (   )
Norm@50keV  : 3.65961E-03    (     )
------------------------------------------------------------
#Fit statistic  : Chi-Squared                   67.11     using 59 bins.
 Reduced chi-squared = 1.13746
# Null hypothesis probability of 1.69e-01 with 57 degrees of freedom

Photon flux (15-150 keV)    in 48.98 sec: 0.295118 ( -0.027622  0.027512 ) ph/cm2/s
Energy fluence (15-150 keV)             : 8.76757e-07 ( -1.24322e-07  1.26053e-07 ) ergs/cm2
1-s peak spectrum fit
Power-law model
Time interval is from   -1.720 sec. to   -0.720 sec.

Spectral model in power-law:
------------------------------------------------------------
Parameters  : value       lower 90%   higher 90%
Photon index: -1.65155     ( -0.443277   0.434506 )
Norm@50keV  : 5.64772E-03    ( -0.00155838   0.00150348 )
------------------------------------------------------------
#Fit statistic  : Chi-Squared                   57.29     using 59 bins.
 Reduced chi-squared = 0.971017
# Null hypothesis probability of 4.64e-01 with 57 degrees of freedom

Photon flux (15-150 keV)    in 1 sec: 0.737859 ( -0.178583  0.178649 ) ph/cm2/s
Energy fluence (15-150 keV)             : 5.25255e-08 ( -1.49184e-08  1.56048e-08 ) ergs/cm2
Cutoff power-law model
Time interval is from   -1.720 sec. to   -0.720 sec.
Spectral model in the cutoff power-law:
------------------------------------------------------------
Parameters  : value       lower 90%   higher 90%
Photon index: -1.65122     (       )
Epeak [keV] : 9999.25      (   )
Norm@50keV  : 5.65708E-03    (     )
------------------------------------------------------------
#Fit statistic  : Chi-Squared                   57.29     using 59 bins.
 Reduced chi-squared = 0.971017
# Null hypothesis probability of 4.64e-01 with 57 degrees of freedom

Photon flux (15-150 keV)    in 1 sec: 0.737533 ( -0.178277  0.178915 ) ph/cm2/s
Energy fluence (15-150 keV)             : 5.28689e-08 ( -3.09318e-08  1.12609e-08 ) ergs/cm2
Time-resolved spectra
Distribution
T90 vs. Hardness ratio plot
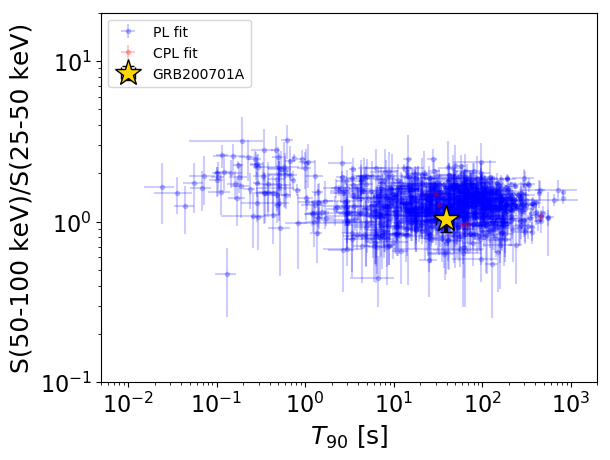
T90                                   = 38.78 sec.
Hardness ratio (energy fluence ratio) = 1.04383048596
S(15-50 keV) vs. S(50-150 keV) plot
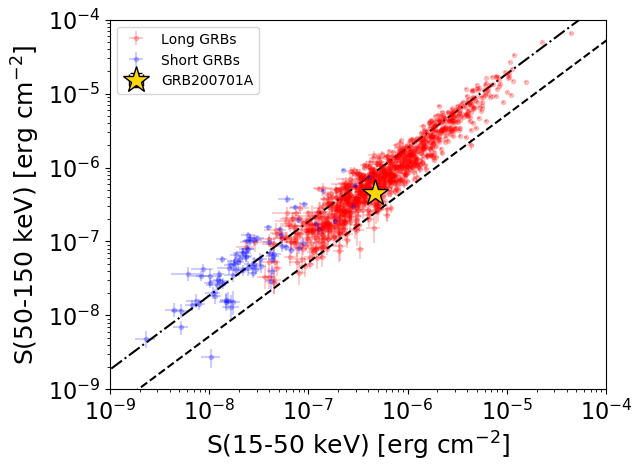
S(15-50 keV)  = 4.679251e-07
S(50-150 keV) = 4.584579e-07
The dash-dotted line and the dashed line traces the fluences calculated from the Band function with Epeak = 15 and 150 keV, respectively. Both lines assume a canonical values of alpha = -1 and beta = -2.5.
Mask shadow pattern
IMX = 1.492325795130763E-01, IMY = 3.228025150966413E-01
Spacecraft aspect plot
Bright source in the pre-burst/pre-slew/post-slew images
Pre-burst image of 15-350 keV band
Time interval of the image:
-239.288000 -6.808000

# RAcent  DECcent POSerr Theta    Phi  PeakCts   SNR AngSep     Name
#  [deg]    [deg]    ['] [deg]  [deg]                   [']
135.5332 -40.5224    1.7  12.0   58.5   1.6769   6.7    2.0	Vela X-1
170.3772 -60.5624    3.6  40.3   78.3  -3.0512  -3.1    4.1	Cen X-3
 50.0305 -39.5708    2.2  56.9  174.0   6.8091   5.2 ------	UNKNOWN
114.6271  -2.1311    2.1  32.9  -82.6   2.6502   5.4 ------	UNKNOWN
103.1459   2.2681    2.5  40.8  -98.4   5.0658   4.6 ------	UNKNOWN
Pre-slew background subtracted image of 15-350 keV band
Time interval of the image:
-6.808000 42.168000

# RAcent  DECcent POSerr Theta    Phi  PeakCts   SNR AngSep     Name
#  [deg]    [deg]    ['] [deg]  [deg]                   [']
135.5135 -40.7351    7.0  12.1   59.4   0.1553   1.6   10.8	Vela X-1
170.5818 -60.6611    5.7  40.4   78.4  -0.8609  -2.0    8.2	Cen X-3
 49.0126 -51.9635    3.0  54.2  159.2   2.0074   3.9 ------	UNKNOWN
103.8431 -23.1050    2.7  19.9 -128.9   0.4489   4.3 ------	UNKNOWN
123.5667 -14.5336    0.7  19.6  -65.2   1.7622  16.7 ------	UNKNOWN
Post-slew image of 15-350 keV band
Time interval of the image:
590.112600 653.006800
660.712000 717.566700
720.712000 775.392000
780.712000 962.794100

# RAcent  DECcent POSerr Theta    Phi  PeakCts   SNR AngSep     Name
#  [deg]    [deg]    ['] [deg]  [deg]                   [']
135.5293 -40.5619    1.9  41.9  -36.9   3.6957   6.1    0.4	Vela X-1
170.4810 -60.7565   11.9  34.9   10.0  -0.4746  -1.0    9.4	Cen X-3
186.3904 -62.6854   12.1  37.2   22.6  -0.5449  -1.0    8.9	GX 301-2
216.6249 -58.3041    3.5  46.9   40.5   3.4598   3.3 ------	UNKNOWN
157.7845 -47.6645    2.9  42.5  -10.8   2.0729   4.0 ------	UNKNOWN
113.4718 -49.5520    2.6  27.4  -55.7   2.0462   4.4 ------	UNKNOWN
109.3178 -47.6921    2.3  28.1  -62.7   2.4819   5.0 ------	UNKNOWN