Analysis Summary
Notes:
- 1) No attempt has been made to eliminate the non-significant decimal places.
- 2) This batgrbproduct analysis is done using the HEASARC data.
- 3) This batgrbproduct analysis is using the flight position for the mask-weighting calculation.
======================================================================
BAT GRB EVENT DATA PROCESSING REPORT
Process Script Ver: batgrbproduct v2.48
Process Start Time: Wed Sep 9 23:02:24 EDT 2020
Host Name: bat1
Current Working Dir: /local/data/bat1/alien/Swift_3rdBATcatalog/event/batevent_reproc/trigger981957
======================================================================
Trigger: 00981957 Segment: 000
BAT Trigger Time: 616158301.76 [s; MET]
Trigger Stop: 616158302.784 [s; MET]
UTC: 2020-07-11T11:04:36.495000 [includes UTCF correction]
Where From?: TDRSS position message
BAT
RA: 285.976650447479 Dec: -0.136296528746014 [deg; J2000]
Catalogged Source?: NO
Point Source?: YES
GRB Indicated?: YES [ by BAT flight software ]
Image S/N Ratio: 6.78
Image Trigger?: NO
Rate S/N Ratio: 65.9621103361619 [ if not an image trigger ]
Image S/N Ratio: 6.78
Analysis Position: [ source = BAT ]
RA: 285.976650447479 Dec: -0.136296528746014 [deg; J2000]
Refined Position: [ source = BAT pre-slew burst ]
RA: 285.974051212983 Dec: -0.134789313063288 [deg; J2000]
{ 19h 03m 53.8s , -00d 08' 05.2" }
+/- 1.47543784963379 [arcmin] (estimated 90% radius based on SNR)
+/- 0.755725633300015 [arcmin] (formal 1-sigma fit error)
SNR: 17.4502952571786
Angular difference between the analysis and refined position is 0.180277 arcmin
Partial Coding Fraction: 0.08691406 [ including projection effects ]
Duration
T90: 29.3600000143051 +/- 3.07170836177462
Measured from: -3.26399993896484
to: 26.0960000753403 [s; relative to TRIGTIME]
T50: 16.960000038147 +/- 1.53101285943251
Measured from: -0.25600004196167
to: 16.7039999961853 [s; relative to TRIGTIME]
Fluence
Peak Flux (peak 1 second)
Measured from: 0.195999979972839
to: 1.19599997997284 [s; relative to TRIGTIME]
Total Fluence
Measured from: -4.72000002861023
to: 29.7280000448227 [s; relative to TRIGTIME]
Band 1 Band 2 Band 3 Band 4
15-25 25-50 50-100 100-350 keV
Total 1.959453 2.864675 2.427948 0.678822
0.153755 0.161666 0.144052 0.117082 [error]
Peak 0.146726 0.390617 0.345471 0.135351
0.036365 0.041097 0.042464 0.035365 [error]
[ fluence units of on-axis counts / fully illuminated detector ]
======================================================================
====== Table of the duration information =============================
Value tstart tstop
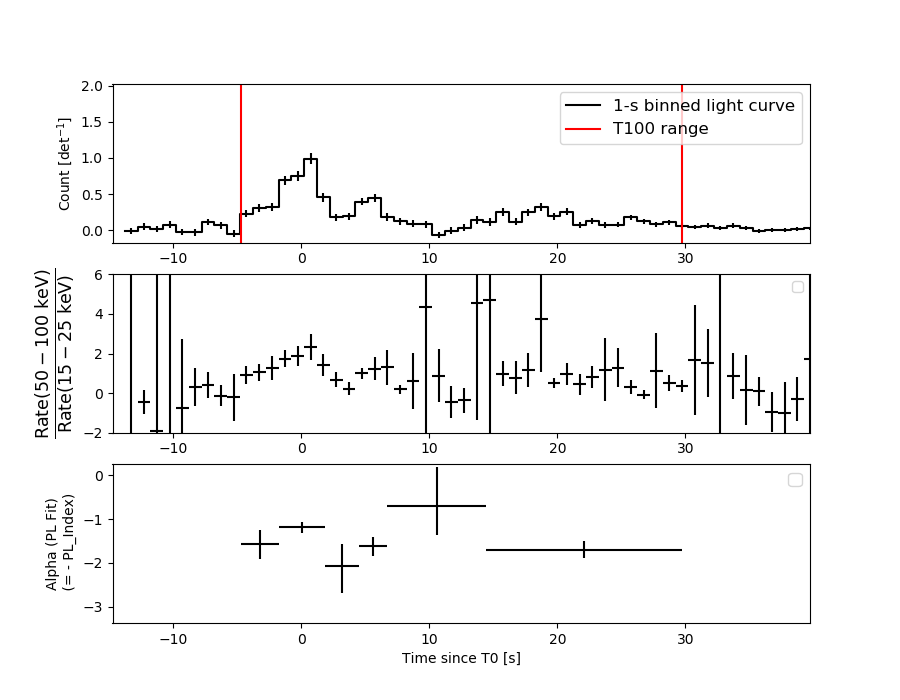
T100 34.448 -4.720 29.728
T90 29.360 -3.264 26.096
T50 16.960 -0.256 16.704
Peak 1.000 0.196 1.196
====== Spectral Analysis Summary =====================================
Model : spectral model: simple power-law (PL) and cutoff power-law (CPL)
Ph_index : photon index: E^{Ph_index}
Ph_90err : 90% error of the photon index
Epeak : Epeak in keV
Epeak_90err: 90% error of Epeak
Norm : normalization at 50 keV in both the PL model and CPL model
Nomr_90err : 90% error of the normalization
chi2 : Chi-Squared
dof : degree of freedo
=== Time-averaged spectral analysis ===
(Best model with acceptable fit: PL)
Model Ph_index Ph_90err_low Ph_90err_hi Epeak Epeak_90err_low Epeak_90err_hi Norm Nomr_90err_low Norm_90err_hi chi2 dof
PL -1.414 -0.104 0.104 - - - 1.59e-02 -9.51e-04 9.50e-04 55.780 57
CPL -1.094 -0.363 0.440 152.810 -59.314 -152.810 2.25e-02 -7.12e-03 1.34e-02 53.940 56
=== 1-s peak spectral analysis ===
(Best model with acceptable fit: N/A)
Model Ph_index Ph_90err_low Ph_90err_hi Epeak Epeak_90err_low Epeak_90err_hi Norm Nomr_90err_low Norm_90err_hi chi2 dof
PL -1.123 -0.206 0.209 - - - 6.63e-02 -8.48e-03 8.48e-03 62.810 57
CPL -0.121 -0.876 1.117 99.876 -27.865 267.911 2.01e-01 -1.23e-01 4.77e-01 58.890 56
=== Fluence/Peak Flux Summary ===
Model Band1 Band2 Band3 Band4 Band5 Total
15-25 25-50 50-100 100-350 15-150 15-350 keV
Fluence PL 6.45e-07 1.25e-06 1.88e-06 6.09e-06 5.28e-06 9.86e-06 erg/cm2
90%_error_low -7.02e-08 -8.35e-08 -1.37e-07 -9.26e-07 -3.40e-07 -1.03e-06 erg/cm2
90%_error_hi 7.28e-08 8.31e-08 1.37e-07 1.03e-06 3.41e-07 1.11e-06 erg/cm2
Peak flux PL 4.51e-04 6.92e-03 7.63e-02 6.81e+00 2.61e-01 6.82e+00 ph/cm2/s
90%_error_low 3.32e-05 -9.08e-04 -8.49e-03 -9.03e-01 4.62e-02 -8.40e-01 ph/cm2/s
90%_error_hi 3.72e-04 2.76e-03 2.95e-02 1.64e+00 2.09e-01 1.76e+00 ph/cm2/s
Fluence CPL 5.18e-07 7.17e-07 7.68e-07 1.88e-06 2.51e-06 3.88e-06 erg/cm2
90%_error_low -3.31e-08 -3.17e-07 -1.36e-07 -1.73e-07 -4.60e-07 -5.51e-07 erg/cm2
90%_error_hi 7.55e-08 7.21e-08 1.25e-07 1.75e-07 4.49e-06 4.98e-07 erg/cm2
Peak flux CPL 1.54e+00 2.60e+00 2.44e+00 1.42e+00 7.48e+00 8.00e+00 ph/cm2/s
90%_error_low -4.99e-01 -4.20e-01 -3.89e-01 -7.91e-01 -1.02e+00 -1.31e+00 ph/cm2/s
90%_error_hi 5.44e-01 4.38e-01 4.02e-01 1.72e+00 1.02e+00 1.84e+00 ph/cm2/s
======================================================================
Image
Pre-slew 15.0-350.0 keV image (Event data)
#   RAcent    DECcent   POSerr    Theta     Phi              Peak Cts       SNR   Name
  285.9741    -0.1348   0.0111    38.8815    99.0328         5.6639932     17.450 TRIG_00981957

Foreground time interval of the image:
 -4.720  12.541 (delta_t =  17.261 [sec])
Background time interval of the image:
-239.760  -4.720 (delta_t = 235.040 [sec])
Light Curves
Note: The mask-weighted lightcurves have units of either count/det or counts/sec/det, where a det is 0.4 x 0.4 = 0.16 sq cm.
Full-time range; 1 s binning
Other quick-look light curves:
- 64 ms binning (zoomed)
- 16 ms binning (zoomed)
- 8 ms binning (zoomed)
- 2 ms binning (zoomed)
- SN=5 or 10 s binning (full-time range)
- Raw light curve
Spectra
- 64 ms binning (zoomed)
- 16 ms binning (zoomed)
- 8 ms binning (zoomed)
- 2 ms binning (zoomed)
- SN=5 or 10 s binning (full-time range)
- Raw light curve
Spectra
Notes:
- 1) The fitting includes the systematic errors.
- 2) When the burst includes telescope slew time periods, the fitting uses an average response file made from multiple 5-s response files through out the slew time plus single time preiod for the non-slew times, and weighted by the total counts in the corresponding time period using addrmf. An average response file is needed becuase a spectral fit using the pre-slew DRM will introduce some errors in both a spectral shape and a normalization if the PHA file contains a lot of the slew/post-slew time interval.
- 3) For fits to more complicated models (e.g. a power-law over a cutoff power-law), the BAT team has decided to require a chi-square improvement of more than 6 for each extra dof.
Time averaged spectrum fit using the average DRM
Power-law model
Time interval is from   -4.720 sec. to   29.728 sec.

Spectral model in power-law:
------------------------------------------------------------
Parameters  : value       lower 90%   higher 90%
Photon index: -1.41368     ( -0.104275   0.10433 )
Norm@50keV  : 1.58911E-02    ( -0.000950656   0.000950244 )
------------------------------------------------------------
#Fit statistic  : Chi-Squared                   55.78     using 59 bins.
 Reduced chi-squared = 0.978596
# Null hypothesis probability of 5.21e-01 with 57 degrees of freedom

Photon flux (15-150 keV)    in 34.45 sec: 1.94137 ( -0.12232  0.12259 ) ph/cm2/s
Energy fluence (15-150 keV)             : 5.27595e-06 ( -3.39675e-07  3.40726e-07 ) ergs/cm2
Cutoff power-law model
Time interval is from   -4.720 sec. to   29.728 sec.
Spectral model in the cutoff power-law:
------------------------------------------------------------
Parameters  : value       lower 90%   higher 90%
Photon index: -1.0936     ( -0.362882   0.439506 )
Epeak [keV] : 152.810      ( -59.3132 -152.81 )
Norm@50keV  : 2.25422E-02    ( -0.00712475   0.0133557 )
------------------------------------------------------------
#Fit statistic  : Chi-Squared                   53.94     using 59 bins.
 Reduced chi-squared = 0.963214
# Null hypothesis probability of 5.53e-01 with 56 degrees of freedom

Photon flux (15-150 keV)    in 34.45 sec: 1.91208 ( -0.12759  0.12774 ) ph/cm2/s
Energy fluence (15-150 keV)             : 2.50639e-06 ( -4.60187e-07  4.49476e-06 ) ergs/cm2
1-s peak spectrum fit
Power-law model
Time interval is from    0.196 sec. to    1.196 sec.

Spectral model in power-law:
------------------------------------------------------------
Parameters  : value       lower 90%   higher 90%
Photon index: -1.12337     ( -0.205951   0.208574 )
Norm@50keV  : 6.62785E-02    ( -0.00847921   0.00847891 )
------------------------------------------------------------
#Fit statistic  : Chi-Squared                   62.81     using 59 bins.
 Reduced chi-squared = 1.10193
# Null hypothesis probability of 2.78e-01 with 57 degrees of freedom

Photon flux (15-150 keV)    in 1 sec: 0.260764 ( 0.046159  0.209152 ) ph/cm2/s
Energy fluence (15-150 keV)             : 6.87939e-07 ( -9.72621e-08  9.80745e-08 ) ergs/cm2
Cutoff power-law model
Time interval is from    0.196 sec. to    1.196 sec.
Spectral model in the cutoff power-law:
------------------------------------------------------------
Parameters  : value       lower 90%   higher 90%
Photon index: -0.120707     ( -0.875767   1.11745 )
Epeak [keV] : 99.8760      ( -27.8643 267.911 )
Norm@50keV  : 0.200694    ( -0.122786   0.477005 )
------------------------------------------------------------
#Fit statistic  : Chi-Squared                   58.89     using 59 bins.
 Reduced chi-squared = 1.05161
# Null hypothesis probability of 3.70e-01 with 56 degrees of freedom

Photon flux (15-150 keV)    in 1 sec: 7.47820 ( -1.02255  1.02361 ) ph/cm2/s
Energy fluence (15-150 keV)             : 6.49935e-07 ( -1.07659e-07  1.0648e-07 ) ergs/cm2
Time-resolved spectra
Distribution
T90 vs. Hardness ratio plot
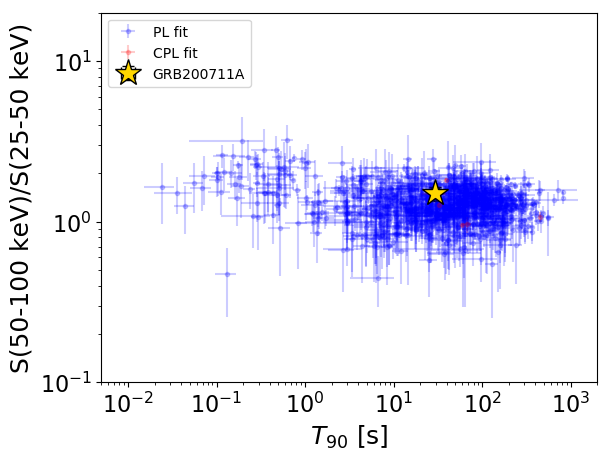
T90                                   = 29.36 sec.
Hardness ratio (energy fluence ratio) = 1.50144680142
S(15-50 keV) vs. S(50-150 keV) plot
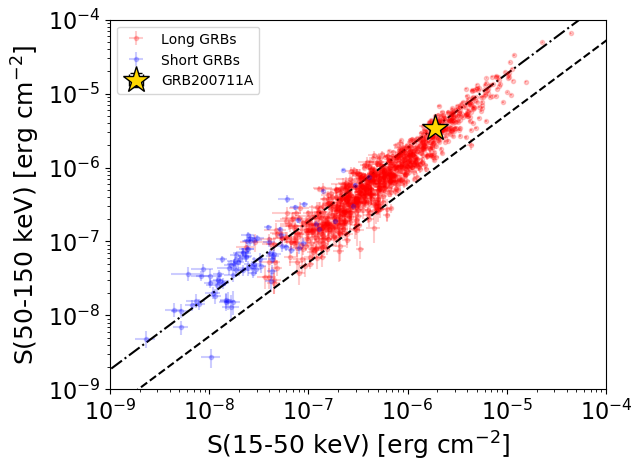
S(15-50 keV)  = 1.8936941e-06
S(50-150 keV) = 3.382167e-06
The dash-dotted line and the dashed line traces the fluences calculated from the Band function with Epeak = 15 and 150 keV, respectively. Both lines assume a canonical values of alpha = -1 and beta = -2.5.
Mask shadow pattern
IMX = -1.265991246325264E-01, IMY = -7.963656060771516E-01
Spacecraft aspect plot
Bright source in the pre-burst/pre-slew/post-slew images
Pre-burst image of 15-350 keV band
Time interval of the image:
-239.760000 -4.720000

# RAcent  DECcent POSerr Theta    Phi  PeakCts   SNR AngSep     Name
#  [deg]    [deg]    ['] [deg]  [deg]                   [']
255.9618 -37.8590    1.5  44.2   25.9   4.4540   7.8    1.5	4U 1700-377
256.4958 -36.4453    4.3  44.1   28.0   1.6082   2.7    3.2	GX 349+2
262.8716 -24.6692   16.1  41.8   46.9   0.5026   0.7    8.8	GX 1+4
264.7212 -44.4878    3.4  37.4   16.2  -1.4650  -3.4    2.4	4U 1735-44
270.3692 -25.0877    4.4  35.3   50.0  -1.4456  -2.6    4.7	GX 5-1
270.2699 -25.6981    3.8  35.2   49.0   1.6620   3.1    3.2	GRS 1758-258
273.8809 -14.0736   10.5  37.4   69.2  -0.7643  -1.1    7.6	GX 17+2
276.1363 -30.4093    0.0  29.0   43.0  -0.6930  -1.9   11.2	H1820-303
284.9970 -24.7991    5.6  23.0   60.5   0.6781   2.1    7.6	HT1900.1-2455
263.0172 -33.6867    6.6  39.3   33.6  -0.9356  -1.8    9.0	GX 354-0
356.2436   4.8672    3.4  57.2 -161.6   5.9551   3.4  368.7	UNKNOWN
283.0635 -74.2808    4.0  44.7  -30.4   1.4429   2.9 ------	UNKNOWN
354.7084  -7.0685    2.8  48.3 -151.3   2.9547   4.1  529.3	UNKNOWN
229.2516 -73.6596    2.6  57.2  -21.2   5.3905   4.4 ------	UNKNOWN
353.7833 -26.2063    2.7  38.4 -127.2   2.3398   4.3 ------	UNKNOWN
Pre-slew background subtracted image of 15-350 keV band
Time interval of the image:
-4.720000 12.540600

# RAcent  DECcent POSerr Theta    Phi  PeakCts   SNR AngSep     Name
#  [deg]    [deg]    ['] [deg]  [deg]                   [']
255.9839 -37.8433  352.4  44.2   26.0  -0.0058  -0.0    0.1	4U 1700-377
256.5291 -36.5178    8.8  44.0   28.0   0.2448   1.3    7.3	GX 349+2
262.9366 -24.9522   13.6  41.7   46.5  -0.2056  -0.8   13.0	GX 1+4
264.7011 -44.5463    6.0  37.4   16.1   0.2149   1.9    6.0	4U 1735-44
270.3323 -25.0583    4.3  35.4   50.1   0.3795   2.7    2.9	GX 5-1
270.1944 -25.8568   23.5  35.2   48.7   0.0661   0.5    9.0	GRS 1758-258
273.9918 -14.1788  167.1  37.3   69.1   0.0156   0.1    8.6	GX 17+2
276.0599 -30.4562    6.5  29.0   42.9   0.1682   1.8    8.8	H1820-303
285.0098 -25.1307    0.0  22.9   59.8   0.0919   1.1   12.7	HT1900.1-2455
263.0941 -33.6368    0.0  39.2   33.7  -0.1304  -0.9   13.0	GX 354-0
285.9742  -0.1349    0.7  38.9   99.0   5.6935  17.3 ------	UNKNOWN
266.3600 -52.7351    3.4  37.8    2.6   0.3053   3.4 ------	UNKNOWN
266.5791 -53.3665    3.2  37.8    1.5   0.3193   3.5 ------	UNKNOWN
Post-slew image of 15-350 keV band
Time interval of the image:
147.740600 837.836500
900.240000 962.304300

# RAcent  DECcent POSerr Theta    Phi  PeakCts   SNR AngSep     Name
#  [deg]    [deg]    ['] [deg]  [deg]                   [']
244.9728 -15.6245    0.7  43.4  170.1  29.2401  16.7    1.0	Sco X-1
255.9877 -37.8633    2.9  46.8  135.9  13.7272   4.0    1.2	4U 1700-377
256.5677 -36.5288   10.0  45.5  136.7  -3.4182  -1.1    9.0	GX 349+2
263.0084 -24.7457   10.4  33.2  143.5   1.4592   1.1    0.0	GX 1+4
268.2659  -1.4306    5.3  17.9 -171.2  -1.7655  -2.2    6.3	SW J1753.5-0127
270.2182 -25.2269   13.4  29.4  133.2   1.1342   0.9    9.6	GX 5-1
270.2437 -25.7416    5.5  29.8  132.6   2.9659   2.2    3.2	GRS 1758-258
274.1884 -14.1513   43.3  18.3  142.5  -0.2346  -0.3   12.7	GX 17+2
275.9245 -30.3656    8.2  31.7  119.8   2.0453   1.4    0.1	H1820-303
285.2249 -25.0380    0.0  24.9  104.8  -0.7213  -0.6   12.5	HT1900.1-2455
288.7699  11.0361   24.0  11.5  -63.6   0.4221   0.5    5.7	GRS 1915+105
299.5684  35.2047    3.2  37.5  -58.8   6.3482   3.6    1.1	Cyg X-1
308.1294  40.8152   19.9  45.6  -53.6   2.1930   0.6    8.3	Cyg X-3
262.8325 -33.8611   16.8  40.1  133.5   1.6711   0.7    8.0	GX 354-0
323.8194   4.6316    3.1  38.0    5.3   4.6211   3.7 ------	UNKNOWN
251.0082  29.8059    3.4  44.9 -122.0  11.8314   3.4 ------	UNKNOWN
244.8921  27.0491    3.4  48.0 -129.1  15.4721   3.4 ------	UNKNOWN