Analysis Summary
Notes:
- 1) No attempt has been made to eliminate the non-significant decimal places.
- 2) This batgrbproduct analysis is done using the HEASARC data.
- 3) This batgrbproduct analysis is using the flight position for the mask-weighting calculation.
======================================================================
BAT GRB EVENT DATA PROCESSING REPORT
Process Script Ver: batgrbproduct v2.48
Process Start Time: Mon Nov 16 14:49:29 EST 2020
Host Name: bat1
Current Working Dir: /local/data/bat1/alien/Swift_3rdBATcatalog/event/batevent_reproc/trigger982201
======================================================================
Trigger: 00982201 Segment: 000
BAT Trigger Time: 616333400 [s; MET]
Trigger Stop: 616333464 [s; MET]
UTC: 2020-07-13T11:42:54.723580 [includes UTCF correction]
Where From?: TDRSS position message
BAT
RA: 76.9619372814151 Dec: -32.8252812192549 [deg; J2000]
Catalogged Source?: NO
Point Source?: YES
GRB Indicated?: YES [ by BAT flight software ]
Image S/N Ratio: 7.86
Image Trigger?: YES
Rate S/N Ratio: 0 [ if not an image trigger ]
Image S/N Ratio: 7.86
Analysis Position: [ source = BAT ]
RA: 76.9619372814151 Dec: -32.8252812192549 [deg; J2000]
Refined Position: [ source = BAT pre-slew burst ]
RA: 76.9329050179147 Dec: -32.841228625877 [deg; J2000]
{ 05h 07m 43.9s , -32d 50' 28.4" }
+/- 2.74733342335603 [arcmin] (estimated 90% radius based on SNR)
+/- 1.59812657370425 [arcmin] (formal 1-sigma fit error)
SNR: 7.17963122286438
Angular difference between the analysis and refined position is 1.748676 arcmin
Partial Coding Fraction: 0.4648438 [ including projection effects ]
Duration
T90: 41.972000002861 +/- 7.98674435078993
Measured from: 21.1399999856949
to: 63.1119999885559 [s; relative to TRIGTIME]
T50: 20.7480000257492 +/- 9.16834908057172
Measured from: 32.2519999742508
to: 53 [s; relative to TRIGTIME]
Fluence
Peak Flux (peak 1 second)
Measured from: 49.9359999895096
to: 50.9359999895096 [s; relative to TRIGTIME]
Total Fluence
Measured from: 18.4479999542236
to: 65.9800000190735 [s; relative to TRIGTIME]
Band 1 Band 2 Band 3 Band 4
15-25 25-50 50-100 100-350 keV
Total 0.619338 0.661064 0.211871 0.019283
0.079062 0.082224 0.074164 0.074768 [error]
Peak 0.030504 0.027028 0.026173 0.018690
0.011932 0.011876 0.010932 0.011007 [error]
[ fluence units of on-axis counts / fully illuminated detector ]
======================================================================
====== Table of the duration information =============================
Value tstart tstop
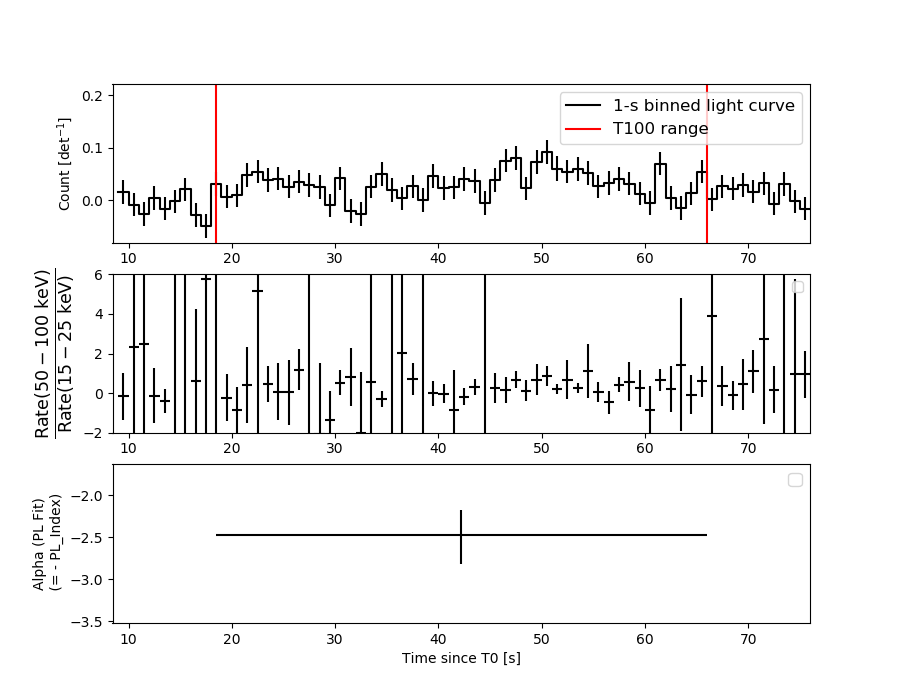
T100 47.532 18.448 65.980
T90 41.972 21.140 63.112
T50 20.748 32.252 53.000
Peak 1.000 49.936 50.936
====== Spectral Analysis Summary =====================================
Model : spectral model: simple power-law (PL) and cutoff power-law (CPL)
Ph_index : photon index: E^{Ph_index}
Ph_90err : 90% error of the photon index
Epeak : Epeak in keV
Epeak_90err: 90% error of Epeak
Norm : normalization at 50 keV in both the PL model and CPL model
Nomr_90err : 90% error of the normalization
chi2 : Chi-Squared
dof : degree of freedo
=== Time-averaged spectral analysis ===
(Best model with acceptable fit: PL)
Model Ph_index Ph_90err_low Ph_90err_hi Epeak Epeak_90err_low Epeak_90err_hi Norm Nomr_90err_low Norm_90err_hi chi2 dof
PL -2.475 -0.340 0.299 - - - 1.71e-03 -4.13e-04 4.08e-04 42.810 57
CPL -1.251 -0.746 2.255 21.530 -18.929 11.323 1.03e-02 -1.03e-02 3.15e-01 40.950 56
=== 1-s peak spectral analysis ===
(Best model with acceptable fit: N/A)
Model Ph_index Ph_90err_low Ph_90err_hi Epeak Epeak_90err_low Epeak_90err_hi Norm Nomr_90err_low Norm_90err_hi chi2 dof
PL -1.628 -0.939 0.813 - - - 5.98e-03 -2.76e-03 2.44e-03 44.710 57
CPL -1.659 -3.092 1.815 9999.360 N/A N/A 5.89e-03 N/A N/A 44.720 56
=== Fluence/Peak Flux Summary ===
Model Band1 Band2 Band3 Band4 Band5 Total
15-25 25-50 50-100 100-350 15-150 15-350 keV
Fluence PL 2.62e-07 2.67e-07 1.92e-07 2.21e-07 8.08e-07 9.43e-07 erg/cm2
90%_error_low -4.64e-08 -4.43e-08 -6.02e-08 -1.09e-07 -1.43e-07 -2.06e-07 erg/cm2
90%_error_hi 4.73e-08 4.31e-08 6.59e-08 1.65e-07 1.50e-07 2.47e-07 erg/cm2
Peak flux PL 2.78e-01 2.60e-01 1.68e-01 1.68e-01 7.75e-01 8.73e-01 ph/cm2/s
90%_error_low -1.75e-01 -1.13e-01 -1.68e-01 -1.68e-01 -3.11e-01 -3.42e-01 ph/cm2/s
90%_error_hi 2.16e-01 1.06e-01 8.95e-02 2.85e-01 3.12e-01 3.45e-01 ph/cm2/s
Fluence CPL 2.49e-07 3.00e-07 1.52e-07 2.76e-08 7.25e-07 7.29e-07 erg/cm2
90%_error_low -5.16e-08 -5.73e-08 -8.58e-08 -2.65e-08 -1.42e-07 -1.46e-07 erg/cm2
90%_error_hi 5.09e-08 6.24e-08 8.68e-08 2.21e-07 1.74e-07 2.58e-07 erg/cm2
Peak flux CPL 2.55e-01 1.91e-01 9.98e-02 8.83e-02 5.82e-01 6.34e-01 ph/cm2/s
90%_error_low -2.55e-01 -1.91e-01 -9.98e-02 -8.83e-02 -5.82e-01 -6.34e-01 ph/cm2/s
90%_error_hi 2.36e-01 1.61e-01 7.96e-02 6.28e-02 4.82e-01 5.14e-01 ph/cm2/s
======================================================================
Image
Pre-slew 15.0-350.0 keV image (Event data)
#   RAcent    DECcent   POSerr    Theta     Phi              Peak Cts       SNR   Name
   76.9329   -32.8412   0.0268    43.6700  -174.1642         1.7990393      7.180 TRIG_00982201

Foreground time interval of the image:
 18.448  65.980 (delta_t =  47.532 [sec])
Background time interval of the image:
-11.699  18.448 (delta_t =  30.147 [sec])
Light Curves
Note: The mask-weighted lightcurves have units of either count/det or counts/sec/det, where a det is 0.4 x 0.4 = 0.16 sq cm.
Full-time range; 1 s binning
Other quick-look light curves:
- 64 ms binning (zoomed)
- 16 ms binning (zoomed)
- 8 ms binning (zoomed)
- 2 ms binning (zoomed)
- SN=5 or 10 s binning (full-time range)
- Raw light curve
Spectra
- 64 ms binning (zoomed)
- 16 ms binning (zoomed)
- 8 ms binning (zoomed)
- 2 ms binning (zoomed)
- SN=5 or 10 s binning (full-time range)
- Raw light curve
Spectra
Notes:
- 1) The fitting includes the systematic errors.
- 2) When the burst includes telescope slew time periods, the fitting uses an average response file made from multiple 5-s response files through out the slew time plus single time preiod for the non-slew times, and weighted by the total counts in the corresponding time period using addrmf. An average response file is needed becuase a spectral fit using the pre-slew DRM will introduce some errors in both a spectral shape and a normalization if the PHA file contains a lot of the slew/post-slew time interval.
- 3) For fits to more complicated models (e.g. a power-law over a cutoff power-law), the BAT team has decided to require a chi-square improvement of more than 6 for each extra dof.
Time averaged spectrum fit using the average DRM
Power-law model
Time interval is from   18.448 sec. to   65.980 sec.

Spectral model in power-law:
------------------------------------------------------------
Parameters  : value       lower 90%   higher 90%
Photon index: -2.47473     ( -0.340055   0.298945 )
Norm@50keV  : 1.71061E-03    ( -0.00041329   0.000407989 )
------------------------------------------------------------
#Fit statistic  : Chi-Squared                   42.81     using 59 bins.
 Reduced chi-squared = 0.751053
# Null hypothesis probability of 9.19e-01 with 57 degrees of freedom

Photon flux (15-150 keV)    in 47.53 sec: 0.330961 ( -0.047237  0.047228 ) ph/cm2/s
Energy fluence (15-150 keV)             : 8.07806e-07 ( -1.4324e-07  1.49913e-07 ) ergs/cm2
Cutoff power-law model
Time interval is from   18.448 sec. to   65.980 sec.
Spectral model in the cutoff power-law:
------------------------------------------------------------
Parameters  : value       lower 90%   higher 90%
Photon index: -1.25114     ( -0.745727   2.25513 )
Epeak [keV] : 21.5296      ( -18.9323 11.3201 )
Norm@50keV  : 1.02970E-02    ( -0.0103021   0.315025 )
------------------------------------------------------------
#Fit statistic  : Chi-Squared                   40.95     using 59 bins.
 Reduced chi-squared = 0.73125
# Null hypothesis probability of 9.34e-01 with 56 degrees of freedom

Photon flux (15-150 keV)    in 47.53 sec: 0.319775 ( -0.048422  0.048897 ) ph/cm2/s
Energy fluence (15-150 keV)             : 7.24647e-07 ( -1.41635e-07  1.74453e-07 ) ergs/cm2
1-s peak spectrum fit
Power-law model
Time interval is from   49.936 sec. to   50.936 sec.

Spectral model in power-law:
------------------------------------------------------------
Parameters  : value       lower 90%   higher 90%
Photon index: -1.62775     ( -0.938474   0.813346 )
Norm@50keV  : 5.97708E-03    ( -0.00276015   0.00244191 )
------------------------------------------------------------
#Fit statistic  : Chi-Squared                   44.71     using 59 bins.
 Reduced chi-squared = 0.784386
# Null hypothesis probability of 8.81e-01 with 57 degrees of freedom

Photon flux (15-150 keV)    in 1 sec: 0.774879 ( -0.311265  0.312291 ) ph/cm2/s
Energy fluence (15-150 keV)             : 5.57237e-08 ( -2.48989e-08  2.5492e-08 ) ergs/cm2
Cutoff power-law model
Time interval is from   49.936 sec. to   50.936 sec.
Spectral model in the cutoff power-law:
------------------------------------------------------------
Parameters  : value       lower 90%   higher 90%
Photon index: -4.1801     ( -0.610028   4.29731 )
Epeak [keV] : 498.736      (   )
Norm@50keV  : 3.97153E-04    (     )
------------------------------------------------------------
#Fit statistic  : Chi-Squared                   44.14     using 59 bins.
 Reduced chi-squared = 0.788214
# Null hypothesis probability of 8.74e-01 with 56 degrees of freedom

Photon flux (15-150 keV)    in 1 sec: 0.582443 ( -0.582443  0.482077 ) ph/cm2/s
Energy fluence (15-150 keV)             : 3.30491e-08 ( -3.25261e-08  2.18637e-07 ) ergs/cm2
Time-resolved spectra
Distribution
T90 vs. Hardness ratio plot
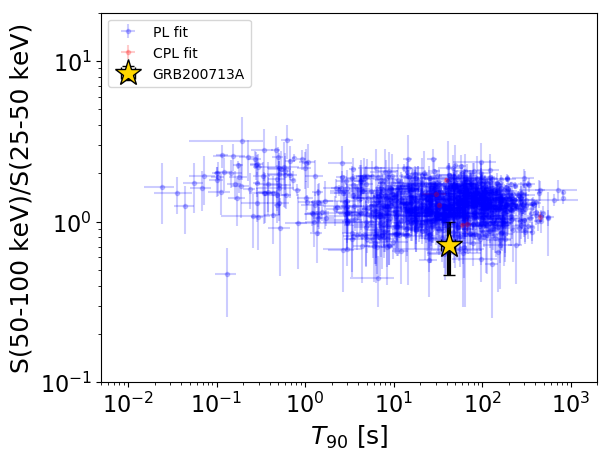
T90                                   = 41.972 sec.
Hardness ratio (energy fluence ratio) = 0.719664422074
S(15-50 keV) vs. S(50-150 keV) plot
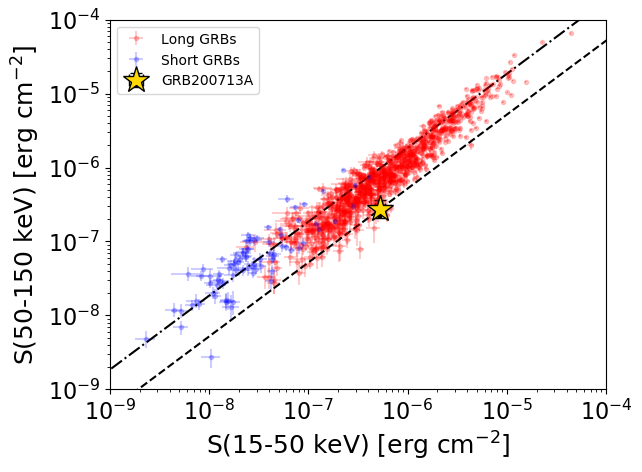
S(15-50 keV)  = 5.289962e-07
S(50-150 keV) = 2.7883007e-07
The dash-dotted line and the dashed line traces the fluences calculated from the Band function with Epeak = 15 and 150 keV, respectively. Both lines assume a canonical values of alpha = -1 and beta = -2.5.
Mask shadow pattern
IMX = -9.496713393525639E-01, IMY = 9.706305275166674E-02
Spacecraft aspect plot
Bright source in the pre-burst/pre-slew/post-slew images
Pre-burst image of 15-350 keV band
Time interval of the image:
-11.699400 18.448000

# RAcent  DECcent POSerr Theta    Phi  PeakCts   SNR AngSep     Name
#  [deg]    [deg]    ['] [deg]  [deg]                   [']
135.4196 -40.7497    0.0   6.8   73.3  -0.0744  -1.0   12.7	Vela X-1
170.0314 -60.5670 1572.0  35.8   76.1   0.0012   0.0    9.0	Cen X-3
 83.4410 -64.4687    2.8  40.3  137.6   0.7672   4.1 ------	UNKNOWN
188.0014 -13.9100    2.6  55.9   11.5   2.1154   4.5 ------	UNKNOWN
Pre-slew background subtracted image of 15-350 keV band
Time interval of the image:
18.448000 65.980000

# RAcent  DECcent POSerr Theta    Phi  PeakCts   SNR AngSep     Name
#  [deg]    [deg]    ['] [deg]  [deg]                   [']
135.6110 -40.3677    5.2   6.6   70.3  -0.3160  -2.2   11.8	Vela X-1
170.5543 -60.7146    5.6  36.1   76.1   0.7400   2.1    8.9	Cen X-3
116.2347 -55.2351    2.1  22.2  130.0   0.8942   5.4 ------	UNKNOWN
 77.8598 -45.6201    2.2  40.4  167.3   1.2084   5.2 ------	UNKNOWN
 76.9329 -32.8412    1.6  43.7 -174.2   1.7992   7.2 ------	UNKNOWN
 87.2181  -5.1812    2.2  49.7 -134.3   3.7215   5.2 ------	UNKNOWN
Post-slew image of 15-350 keV band
Time interval of the image:
138.900600 496.300600

# RAcent  DECcent POSerr Theta    Phi  PeakCts   SNR AngSep     Name
#  [deg]    [deg]    ['] [deg]  [deg]                   [']
135.6075 -40.5298    8.1  46.8  -10.3   1.0544   1.4    3.9	Vela X-1
 38.0071   8.6343    2.6  55.6 -176.2   7.2447   4.4 ------	UNKNOWN
 79.5099  12.8391    2.4  45.8 -123.9   7.5571   4.7 ------	UNKNOWN