Analysis Summary
Notes:
- 1) No attempt has been made to eliminate the non-significant decimal places.
- 2) This batgrbproduct analysis is done using the HEASARC data.
- 3) This batgrbproduct analysis is using the flight position for the mask-weighting calculation.
======================================================================
BAT GRB EVENT DATA PROCESSING REPORT
Process Script Ver: batgrbproduct v2.48
Process Start Time: Wed Sep 9 22:55:30 EDT 2020
Host Name: bat1
Current Working Dir: /local/data/bat1/alien/Swift_3rdBATcatalog/event/batevent_reproc/trigger984929
======================================================================
Trigger: 00984929 Segment: 000
BAT Trigger Time: 617744310.464 [s; MET]
Trigger Stop: 617744318.656 [s; MET]
UTC: 2020-07-29T19:38:05.095420 [includes UTCF correction]
Where From?: TDRSS position message
BAT
RA: 184.374725606312 Dec: 45.5823142434638 [deg; J2000]
Catalogged Source?: NO
Point Source?: YES
GRB Indicated?: YES [ by BAT flight software ]
Image S/N Ratio: 8.81
Image Trigger?: NO
Rate S/N Ratio: 9.59166304662544 [ if not an image trigger ]
Image S/N Ratio: 8.81
Analysis Position: [ source = BAT ]
RA: 184.374725606312 Dec: 45.5823142434638 [deg; J2000]
Refined Position: [ source = BAT pre-slew burst ]
RA: 184.360293791043 Dec: 45.5705349045416 [deg; J2000]
{ 12h 17m 26.5s , +45d 34' 13.9" }
+/- 2.31868852413339 [arcmin] (estimated 90% radius based on SNR)
+/- 1.27353682534939 [arcmin] (formal 1-sigma fit error)
SNR: 9.14836544638276
Angular difference between the analysis and refined position is 0.931057 arcmin
Partial Coding Fraction: 0.4609375 [ including projection effects ]
Duration
T90: 122 +/- 34.2344855372474
Measured from: 1.53600001335144
to: 123.536000013351 [s; relative to TRIGTIME]
T50: 57 +/- 24.8243831746128
Measured from: 7.53600001335144
to: 64.5360000133514 [s; relative to TRIGTIME]
Fluence
Peak Flux (peak 1 second)
Measured from: 5.53600001335144
to: 6.53600001335144 [s; relative to TRIGTIME]
Total Fluence
Measured from: 0.53600001335144
to: 136.536000013351 [s; relative to TRIGTIME]
Band 1 Band 2 Band 3 Band 4
15-25 25-50 50-100 100-350 keV
Total 0.288433 0.584691 0.903058 0.193098
0.106651 0.111376 0.099071 0.087403 [error]
Peak 0.026092 0.023619 0.035718 0.025011
0.011558 0.011721 0.011197 0.009379 [error]
[ fluence units of on-axis counts / fully illuminated detector ]
======================================================================
====== Table of the duration information =============================
Value tstart tstop
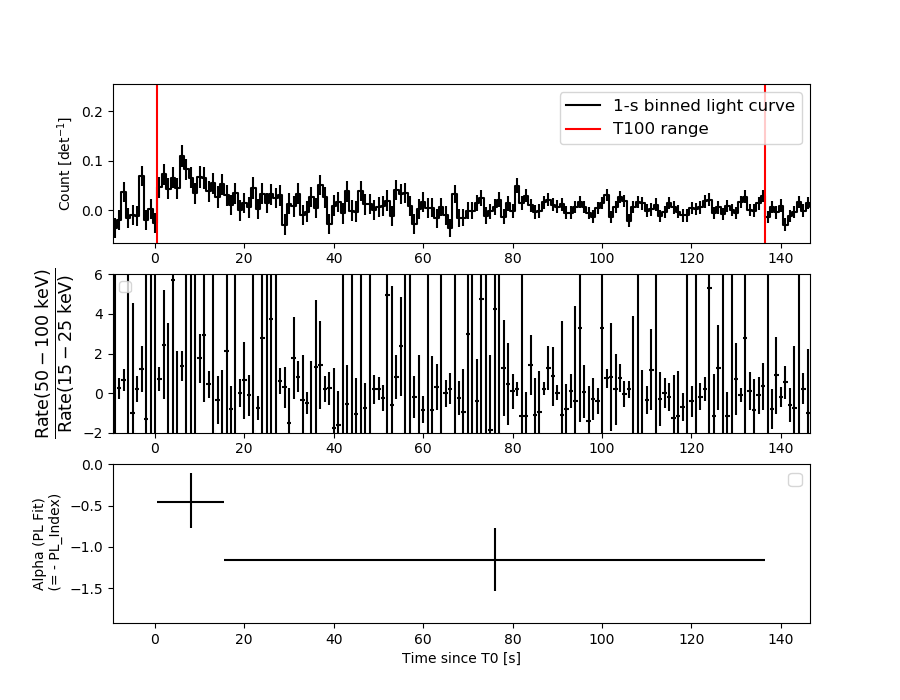
T100 136.000 0.536 136.536
T90 122.000 1.536 123.536
T50 57.000 7.536 64.536
Peak 1.000 5.536 6.536
====== Spectral Analysis Summary =====================================
Model : spectral model: simple power-law (PL) and cutoff power-law (CPL)
Ph_index : photon index: E^{Ph_index}
Ph_90err : 90% error of the photon index
Epeak : Epeak in keV
Epeak_90err: 90% error of Epeak
Norm : normalization at 50 keV in both the PL model and CPL model
Nomr_90err : 90% error of the normalization
chi2 : Chi-Squared
dof : degree of freedo
=== Time-averaged spectral analysis ===
(Best model with acceptable fit: PL)
Model Ph_index Ph_90err_low Ph_90err_hi Epeak Epeak_90err_low Epeak_90err_hi Norm Nomr_90err_low Norm_90err_hi chi2 dof
PL -0.923 -0.260 0.278 - - - 1.05e-03 -1.72e-04 1.69e-04 41.610 57
CPL -0.001 -1.025 1.638 135.977 -48.998 -135.977 2.46e-03 -1.52e-03 7.02e-03 39.860 56
=== 1-s peak spectral analysis ===
(Best model with acceptable fit: PL)
Model Ph_index Ph_90err_low Ph_90err_hi Epeak Epeak_90err_low Epeak_90err_hi Norm Nomr_90err_low Norm_90err_hi chi2 dof
PL -0.721 -0.610 0.773 - - - 6.41e-03 -2.86e-03 2.59e-03 50.150 57
CPL -0.455 0.455 2.663 406.066 -406.066 -406.066 7.97e-03 -4.26e-03 1.36e-01 50.120 56
=== Fluence/Peak Flux Summary ===
Model Band1 Band2 Band3 Band4 Band5 Total
15-25 25-50 50-100 100-350 15-150 15-350 keV
Fluence PL 1.07e-07 2.80e-07 5.91e-07 3.21e-06 1.59e-06 4.19e-06 erg/cm2
90%_error_low -3.41e-08 -5.83e-08 -9.16e-08 -1.01e-06 -2.45e-07 -1.05e-06 erg/cm2
90%_error_hi 3.88e-08 5.73e-08 9.09e-08 1.32e-06 2.45e-07 1.32e-06 erg/cm2
Peak flux PL 1.26e-01 2.02e-01 2.45e-01 5.83e-01 7.40e-01 1.16e+00 ph/cm2/s
90%_error_low -9.02e-02 -1.12e-01 -8.25e-02 -3.26e-01 -2.84e-01 -3.89e-01 ph/cm2/s
90%_error_hi 1.37e-01 1.15e-01 8.23e-02 5.57e-01 2.95e-01 4.56e-01 ph/cm2/s
Fluence CPL 7.94e-08 2.85e-07 6.54e-07 1.32e-06 1.55e-06 2.33e-06 erg/cm2
90%_error_low -4.31e-08 -6.71e-08 -1.10e-07 -8.01e-07 -2.59e-07 -8.30e-07 erg/cm2
90%_error_hi 5.09e-08 6.47e-08 1.25e-07 2.28e-06 2.56e-07 2.29e-06 erg/cm2
Peak flux CPL 1.13e-01 2.00e-01 2.54e-01 5.88e-01 7.32e-01 1.14e+00 ph/cm2/s
90%_error_low -1.13e-01 -2.00e-01 -9.04e-02 -5.88e-01 -2.90e-01 -6.32e-01 ph/cm2/s
90%_error_hi 1.47e-01 1.19e-01 1.13e-01 5.21e-01 2.90e-01 4.18e-01 ph/cm2/s
======================================================================
Image
Pre-slew 15.0-350.0 keV image (Event data)

#   RAcent    DECcent   POSerr    Theta     Phi              Peak Cts       SNR   Name
  184.3603    45.5705   0.0210    41.5424  -158.8771         1.5742161      9.148 TRIG_00984929

Foreground time interval of the image:
  0.536  50.237 (delta_t =  49.701 [sec])
Background time interval of the image:
-239.464   0.536 (delta_t = 240.000 [sec])
Light Curves
Note: The mask-weighted lightcurves have units of either count/det or counts/sec/det, where a det is 0.4 x 0.4 = 0.16 sq cm.
Full-time range; 1 s binning
Other quick-look light curves:
- 64 ms binning (zoomed)
- 16 ms binning (zoomed)
- 8 ms binning (zoomed)
- 2 ms binning (zoomed)
- SN=5 or 10 s binning (full-time range)
- Raw light curve
Spectra
- 64 ms binning (zoomed)
- 16 ms binning (zoomed)
- 8 ms binning (zoomed)
- 2 ms binning (zoomed)
- SN=5 or 10 s binning (full-time range)
- Raw light curve
Spectra
Notes:
- 1) The fitting includes the systematic errors.
- 2) When the burst includes telescope slew time periods, the fitting uses an average response file made from multiple 5-s response files through out the slew time plus single time preiod for the non-slew times, and weighted by the total counts in the corresponding time period using addrmf. An average response file is needed becuase a spectral fit using the pre-slew DRM will introduce some errors in both a spectral shape and a normalization if the PHA file contains a lot of the slew/post-slew time interval.
- 3) For fits to more complicated models (e.g. a power-law over a cutoff power-law), the BAT team has decided to require a chi-square improvement of more than 6 for each extra dof.
Time averaged spectrum fit using the average DRM
Power-law model

Time interval is from    0.536 sec. to  136.536 sec.

Spectral model in power-law:
------------------------------------------------------------
Parameters  : value       lower 90%   higher 90%
Photon index: -0.922876     ( -0.259623   0.278402 )
Norm@50keV  : 1.05344E-03    ( -0.00017188   0.00016851 )
------------------------------------------------------------
#Fit statistic  : Chi-Squared                   41.61     using 59 bins.
 Reduced chi-squared = 0.73
# Null hypothesis probability of 9.37e-01 with 57 degrees of freedom

Photon flux (15-150 keV)    in 136 sec: 0.120948 ( -0.019614  0.01984 ) ph/cm2/s
Energy fluence (15-150 keV)             : 1.59396e-06 ( -2.44535e-07  2.45155e-07 ) ergs/cm2
Cutoff power-law model
Time interval is from    0.536 sec. to  136.536 sec.
Spectral model in the cutoff power-law:
------------------------------------------------------------
Parameters  : value       lower 90%   higher 90%
Photon index: -0.000621513     ( -1.02511   1.6384 )
Epeak [keV] : 135.977      ( -48.9967 -135.976 )
Norm@50keV  : 2.45608E-03    ( -0.00151618   0.0070187 )
------------------------------------------------------------
#Fit statistic  : Chi-Squared                   39.86     using 59 bins.
 Reduced chi-squared = 0.711786
# Null hypothesis probability of 9.49e-01 with 56 degrees of freedom

Photon flux (15-150 keV)    in 136 sec: 0.115562 ( -0.0208783  0.021037 ) ph/cm2/s
Energy fluence (15-150 keV)             : 1.5485e-06 ( -2.59152e-07  2.55805e-07 ) ergs/cm2
1-s peak spectrum fit
Power-law model
Time interval is from    5.536 sec. to    6.536 sec.

Spectral model in power-law:
------------------------------------------------------------
Parameters  : value       lower 90%   higher 90%
Photon index: -0.721122     ( -0.609661   0.773142 )
Norm@50keV  : 6.41471E-03    ( -0.00285567   0.00258868 )
------------------------------------------------------------
#Fit statistic  : Chi-Squared                   50.15     using 59 bins.
 Reduced chi-squared = 0.879825
# Null hypothesis probability of 7.28e-01 with 57 degrees of freedom

Photon flux (15-150 keV)    in 1 sec: 0.740310 ( -0.283578  0.29512 ) ph/cm2/s
Energy fluence (15-150 keV)             : 7.75711e-08 ( -2.61561e-08  2.61626e-08 ) ergs/cm2
Cutoff power-law model
Time interval is from    5.536 sec. to    6.536 sec.
Spectral model in the cutoff power-law:
------------------------------------------------------------
Parameters  : value       lower 90%   higher 90%
Photon index: -0.454702     ( 0.454702   2.66288 )
Epeak [keV] : 406.066      ( -406.066 -406.066 )
Norm@50keV  : 7.97030E-03    ( -0.00426102   0.135579 )
------------------------------------------------------------
#Fit statistic  : Chi-Squared                   50.12     using 59 bins.
 Reduced chi-squared = 0.895
# Null hypothesis probability of 6.96e-01 with 56 degrees of freedom

Photon flux (15-150 keV)    in 1 sec: 0.731593 ( -0.290053  0.290277 ) ph/cm2/s
Energy fluence (15-150 keV)             : 7.75658e-08 ( -2.63115e-08  2.62205e-08 ) ergs/cm2
Time-resolved spectra
Distribution
T90 vs. Hardness ratio plot

T90                                   = 122.0 sec.
Hardness ratio (energy fluence ratio) = 2.10984217424
S(15-50 keV) vs. S(50-150 keV) plot

S(15-50 keV)  = 3.871155e-07
S(50-150 keV) = 1.2068456e-06
The dash-dotted line and the dashed line traces the fluences calculated from the Band function with Epeak = 15 and 150 keV, respectively. Both lines assume a canonical values of alpha = -1 and beta = -2.5.
Mask shadow pattern
IMX = -8.265102105242641E-01, IMY = 3.193040653880231E-01
Spacecraft aspect plot
Bright source in the pre-burst/pre-slew/post-slew images
Pre-burst image of 15-350 keV band
Time interval of the image:
-239.464000 0.536000

# RAcent  DECcent POSerr Theta    Phi  PeakCts   SNR AngSep     Name
#  [deg]    [deg]    ['] [deg]  [deg]                   [']
 83.6321  22.0326    0.9  47.9  -22.6   8.6647  12.7    1.1	Crab
 39.9577  34.6707    3.1  52.4   30.1   5.3551   3.7 ------	UNKNOWN
230.0987  48.7078    2.8  55.6  163.9   7.3923   4.1 ------	UNKNOWN
 65.0791  20.7616    2.8  54.9   -2.3   3.3060   4.2 ------	UNKNOWN
212.5579  38.6620    3.0  58.5 -177.2   7.1978   3.8 ------	UNKNOWN
 84.6986  26.3352    2.6  43.5  -22.2   2.1920   4.4 ------	UNKNOWN
175.9560  41.0103    3.0  41.8 -147.4   2.1749   3.8 ------	UNKNOWN
165.5198  32.7117    2.2  44.8 -130.8   4.4020   5.4 ------	UNKNOWN
Pre-slew background subtracted image of 15-350 keV band
Time interval of the image:
0.536000 50.236600

# RAcent  DECcent POSerr Theta    Phi  PeakCts   SNR AngSep     Name
#  [deg]    [deg]    ['] [deg]  [deg]                   [']
 83.5604  21.8872    5.1  48.0  -22.6  -0.5160  -2.3    8.6	Crab
184.3603  45.5705    1.3  41.5 -158.9   1.5747   9.1 ------	UNKNOWN
 96.2691  31.9509    2.2  35.4  -35.3   0.7478   5.2 ------	UNKNOWN
Post-slew image of 15-350 keV band
Time interval of the image:
123.636600 962.562500

# RAcent  DECcent POSerr Theta    Phi  PeakCts   SNR AngSep     Name
#  [deg]    [deg]    ['] [deg]  [deg]                   [']
230.2480  24.6030    2.2  42.2  116.3  20.6703   5.3 ------	UNKNOWN
230.3736  46.1016    4.1  31.6   84.6   5.1286   2.9 ------	UNKNOWN
165.2533  66.6332    3.1  23.3   -6.8   3.2313   3.7 ------	UNKNOWN
182.8619  -9.1610    2.6  54.8 -165.7  15.1613   4.5 ------	UNKNOWN
172.0530  -0.0563    3.1  47.0 -150.6   8.8938   3.8 ------	UNKNOWN