Analysis Summary
Notes:
- 1) No attempt has been made to eliminate the non-significant decimal places.
- 2) This batgrbproduct analysis is done using the HEASARC data.
- 3) This batgrbproduct analysis is using the flight position for the mask-weighting calculation.
======================================================================
BAT GRB EVENT DATA PROCESSING REPORT
Process Script Ver: batgrbproduct v2.48
Process Start Time: Wed Sep 9 22:53:25 EDT 2020
Host Name: bat1
Current Working Dir: /local/data/bat1/alien/Swift_3rdBATcatalog/event/batevent_reproc/trigger987016
======================================================================
Trigger: 00987016 Segment: 000
BAT Trigger Time: 618420555.328 [s; MET]
Trigger Stop: 618420555.84 [s; MET]
UTC: 2020-08-06T15:28:49.915180 [includes UTCF correction]
Where From?: TDRSS position message
BAT
RA: 52.9051939418572 Dec: 37.0819682887688 [deg; J2000]
Catalogged Source?: NO
Point Source?: YES
GRB Indicated?: YES [ by BAT flight software ]
Image S/N Ratio: 11.05
Image Trigger?: NO
Rate S/N Ratio: 24.576411454889 [ if not an image trigger ]
Image S/N Ratio: 11.05
Analysis Position: [ source = BAT ]
RA: 52.9051939418572 Dec: 37.0819682887688 [deg; J2000]
Refined Position: [ source = BAT pre-slew burst ]
RA: 52.9343733120723 Dec: 37.0784233951319 [deg; J2000]
{ 03h 31m 44.2s , +37d 04' 42.3" }
+/- 0.753807135199884 [arcmin] (estimated 90% radius based on SNR)
+/- 0.246312963908794 [arcmin] (formal 1-sigma fit error)
SNR: 45.5471165804709
Angular difference between the analysis and refined position is 1.412846 arcmin
Partial Coding Fraction: 0.5703125 [ including projection effects ]
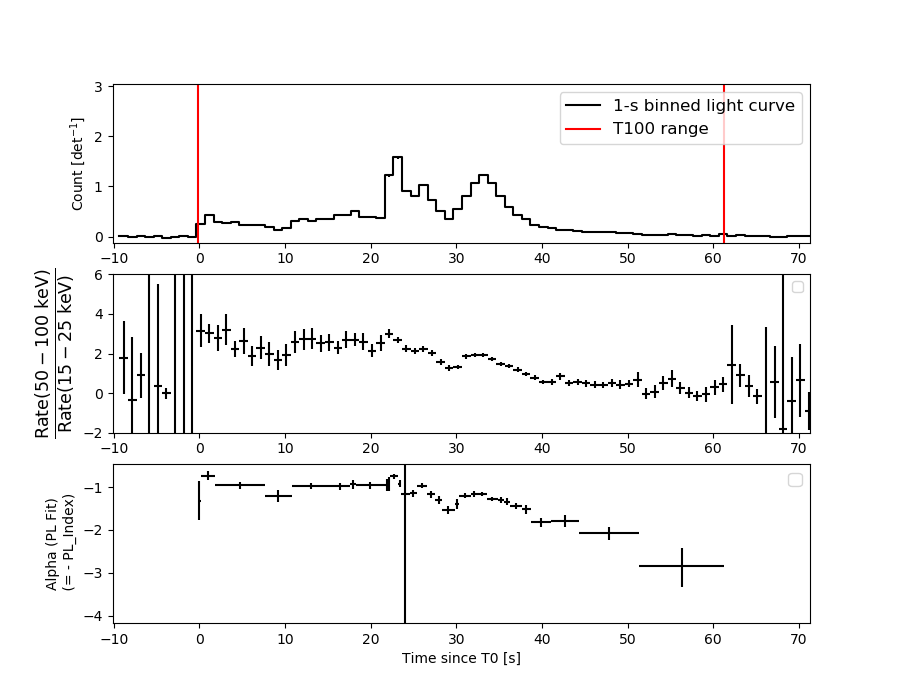
Duration
T90: 38.6879999637604 +/- 1.00406367133862
Measured from: 3.36400008201599
to: 42.0520000457764 [s; relative to TRIGTIME]
T50: 14.5559998750687 +/- 0.331445312419436
Measured from: 18.5680000782013
to: 33.12399995327 [s; relative to TRIGTIME]
Fluence
Peak Flux (peak 1 second)
Measured from: 22.2440000772476
to: 23.2440000772476 [s; relative to TRIGTIME]
Total Fluence
Measured from: -0.131999969482422
to: 61.308000087738 [s; relative to TRIGTIME]
Band 1 Band 2 Band 3 Band 4
15-25 25-50 50-100 100-350 keV
Total 4.397456 7.976800 8.044564 2.269070
0.060592 0.070291 0.068451 0.052215 [error]
Peak 0.243909 0.531837 0.720572 0.296189
0.011351 0.015143 0.017294 0.012728 [error]
[ fluence units of on-axis counts / fully illuminated detector ]
======================================================================
====== Table of the duration information =============================
Value tstart tstop
T100 61.440 -0.132 61.308
T90 38.688 3.364 42.052
T50 14.556 18.568 33.124
Peak 1.000 22.244 23.244
====== Spectral Analysis Summary =====================================
Model : spectral model: simple power-law (PL) and cutoff power-law (CPL)
Ph_index : photon index: E^{Ph_index}
Ph_90err : 90% error of the photon index
Epeak : Epeak in keV
Epeak_90err: 90% error of Epeak
Norm : normalization at 50 keV in both the PL model and CPL model
Nomr_90err : 90% error of the normalization
chi2 : Chi-Squared
dof : degree of freedo
=== Time-averaged spectral analysis ===
(Best model with acceptable fit: CPL)
Model Ph_index Ph_90err_low Ph_90err_hi Epeak Epeak_90err_low Epeak_90err_hi Norm Nomr_90err_low Norm_90err_hi chi2 dof
PL -1.209 -0.025 0.025 - - - 2.64e-02 -3.94e-04 3.94e-04 89.250 57
CPL -0.749 -0.112 0.114 173.320 -21.790 34.328 4.02e-02 -3.79e-03 4.27e-03 36.810 56
=== 1-s peak spectral analysis ===
(Best model with acceptable fit: N/A)
Model Ph_index Ph_90err_low Ph_90err_hi Epeak Epeak_90err_low Epeak_90err_hi Norm Nomr_90err_low Norm_90err_hi chi2 dof
PL -0.756 -0.050 0.051 - - - 1.23e-01 -3.75e-03 3.74e-03 49.500 57
CPL -0.469 -0.202 0.212 339.457 -116.109 595.312 1.60e-01 -2.69e-02 3.36e-02 43.560 56
=== Fluence/Peak Flux Summary ===
Model Band1 Band2 Band3 Band4 Band5 Total
15-25 25-50 50-100 100-350 15-150 15-350 keV
Fluence PL 1.58e-06 3.47e-06 6.01e-06 2.41e-05 1.64e-05 3.52e-05 erg/cm2
90%_error_low -5.03e-08 -6.68e-08 -8.72e-08 -7.99e-07 -2.30e-07 -8.22e-07 erg/cm2
90%_error_hi 5.10e-08 6.68e-08 8.72e-08 8.17e-07 2.30e-07 8.35e-07 erg/cm2
Peak flux PL 1.13e-03 1.39e-02 1.36e-02 1.47e+01 4.09e-01 1.47e+01 ph/cm2/s
90%_error_low 3.79e-05 5.85e-04 N/A -4.26e-01 N/A -2.87e-01 ph/cm2/s
90%_error_hi 1.58e-04 1.91e-03 N/A 5.77e-01 N/A 8.44e-01 ph/cm2/s
Fluence CPL 1.36e-06 3.49e-06 6.35e-06 1.54e-05 1.63e-05 2.66e-05 erg/cm2
90%_error_low -6.81e-08 -7.00e-08 -1.19e-07 -1.47e-06 -2.36e-07 -1.46e-06 erg/cm2
90%_error_hi 6.95e-08 6.99e-08 1.19e-07 1.67e-06 2.36e-07 1.65e-06 erg/cm2
Peak flux CPL 2.27e+00 3.94e+00 4.82e+00 8.29e+00 1.40e+01 1.93e+01 ph/cm2/s
90%_error_low -2.13e-01 -1.63e-01 -1.87e-01 -1.31e+00 -4.25e-01 -1.37e+00 ph/cm2/s
90%_error_hi 2.19e-01 1.62e-01 1.88e-01 1.62e+00 4.25e-01 1.65e+00 ph/cm2/s
======================================================================
Image
Pre-slew 15.0-350.0 keV image (Event data)
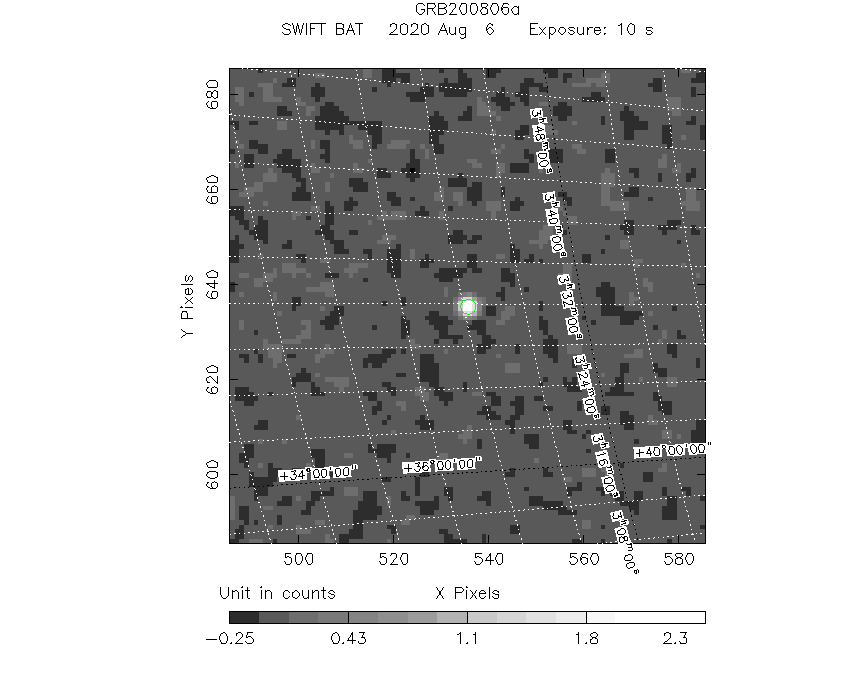
#   RAcent    DECcent   POSerr    Theta     Phi              Peak Cts       SNR   Name
   52.9344    37.0784   0.0042    38.5153   -24.7701         2.7592286     45.547 TRIG_00987016

Foreground time interval of the image:
 -0.132   9.973 (delta_t =  10.105 [sec])
Background time interval of the image:
-239.328  -0.132 (delta_t = 239.196 [sec])
Light Curves
Note: The mask-weighted lightcurves have units of either count/det or counts/sec/det, where a det is 0.4 x 0.4 = 0.16 sq cm.
Full-time range; 1 s binning
Other quick-look light curves:
- 64 ms binning (zoomed)
- 16 ms binning (zoomed)
- 8 ms binning (zoomed)
- 2 ms binning (zoomed)
- SN=5 or 10 s binning (full-time range)
- Raw light curve
Spectra
- 64 ms binning (zoomed)
- 16 ms binning (zoomed)
- 8 ms binning (zoomed)
- 2 ms binning (zoomed)
- SN=5 or 10 s binning (full-time range)
- Raw light curve
Spectra
Notes:
- 1) The fitting includes the systematic errors.
- 2) When the burst includes telescope slew time periods, the fitting uses an average response file made from multiple 5-s response files through out the slew time plus single time preiod for the non-slew times, and weighted by the total counts in the corresponding time period using addrmf. An average response file is needed becuase a spectral fit using the pre-slew DRM will introduce some errors in both a spectral shape and a normalization if the PHA file contains a lot of the slew/post-slew time interval.
- 3) For fits to more complicated models (e.g. a power-law over a cutoff power-law), the BAT team has decided to require a chi-square improvement of more than 6 for each extra dof.
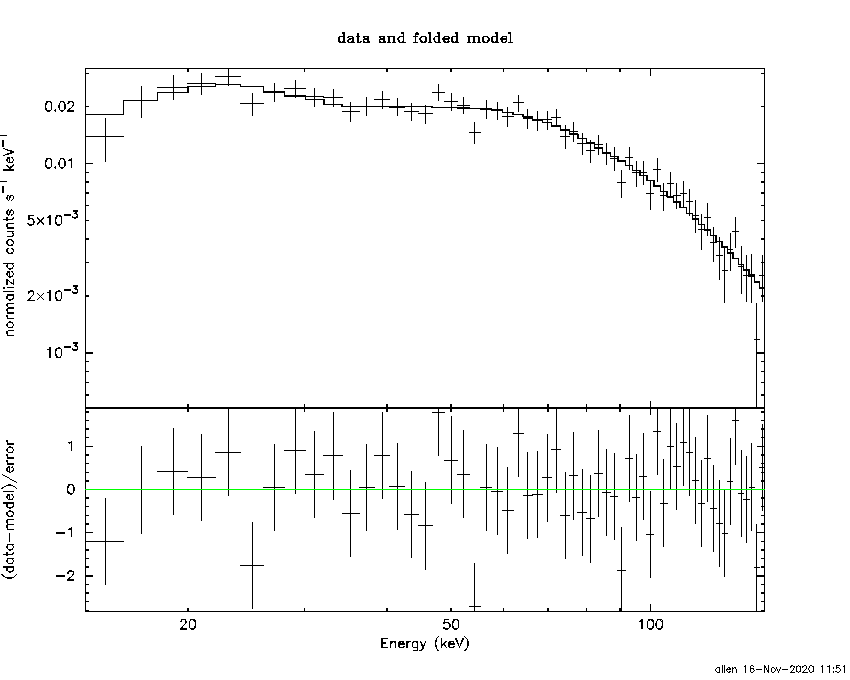
Time averaged spectrum fit using the average DRM
Power-law model
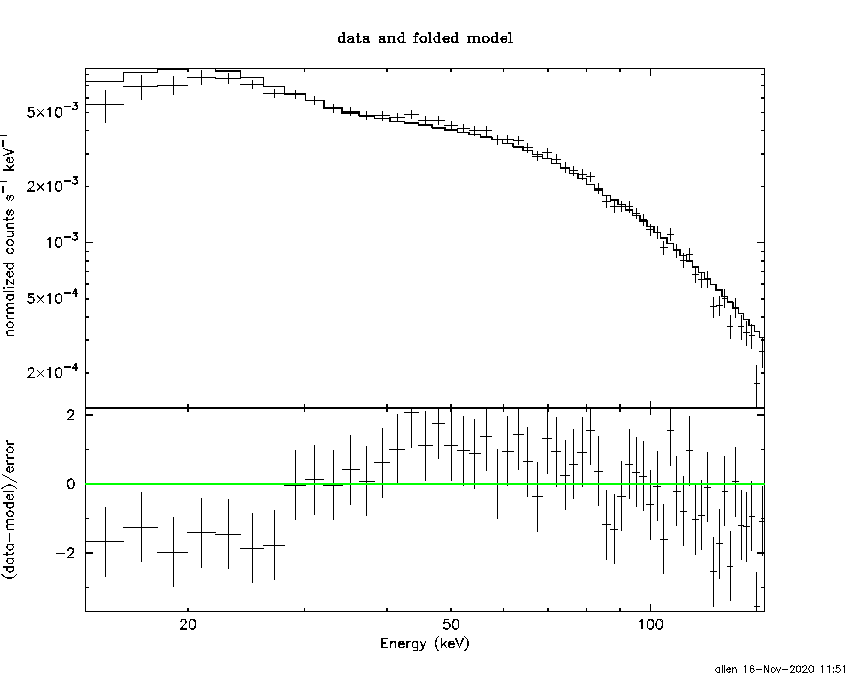
Time interval is from   -0.132 sec. to   61.308 sec.

Spectral model in power-law:
------------------------------------------------------------
Parameters  : value       lower 90%   higher 90%
Photon index: -1.20924     ( -0.0252002   0.0252933 )
Norm@50keV  : 2.64435E-02    ( -0.00039428   0.00039364 )
------------------------------------------------------------
#Fit statistic  : Chi-Squared                   89.25     using 59 bins.
 Reduced chi-squared = 1.56579
# Null hypothesis probability of 4.06e-03 with 57 degrees of freedom

Photon flux (15-150 keV)    in 61.44 sec: 3.10804 ( -0.05144  0.05155 ) ph/cm2/s
Energy fluence (15-150 keV)             : 1.64423e-05 ( -2.30093e-07  2.30253e-07 ) ergs/cm2
Cutoff power-law model
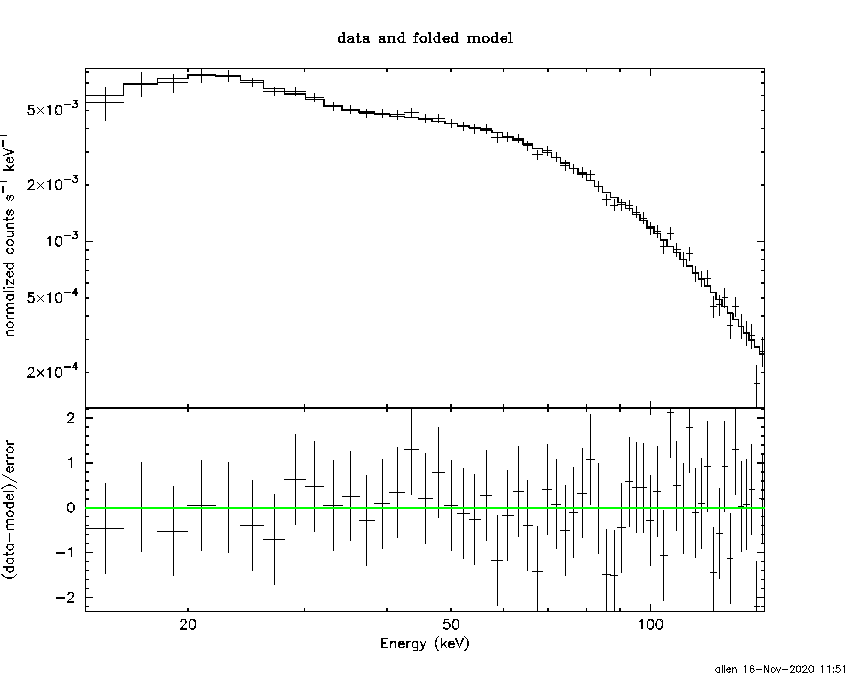
Time interval is from   -0.132 sec. to   61.308 sec.
Spectral model in the cutoff power-law:
------------------------------------------------------------
Parameters  : value       lower 90%   higher 90%
Photon index: -0.748813     ( -0.111717   0.114273 )
Epeak [keV] : 173.320      ( -21.7893 34.3288 )
Norm@50keV  : 4.01955E-02    ( -0.00379233   0.00426817 )
------------------------------------------------------------
#Fit statistic  : Chi-Squared                   36.81     using 59 bins.
 Reduced chi-squared = 0.657321
# Null hypothesis probability of 9.78e-01 with 56 degrees of freedom

Photon flux (15-150 keV)    in 61.44 sec: 3.01090 ( -0.055  0.05528 ) ph/cm2/s
Energy fluence (15-150 keV)             : 1.62578e-05 ( -2.35965e-07  2.35677e-07 ) ergs/cm2
1-s peak spectrum fit
Power-law model
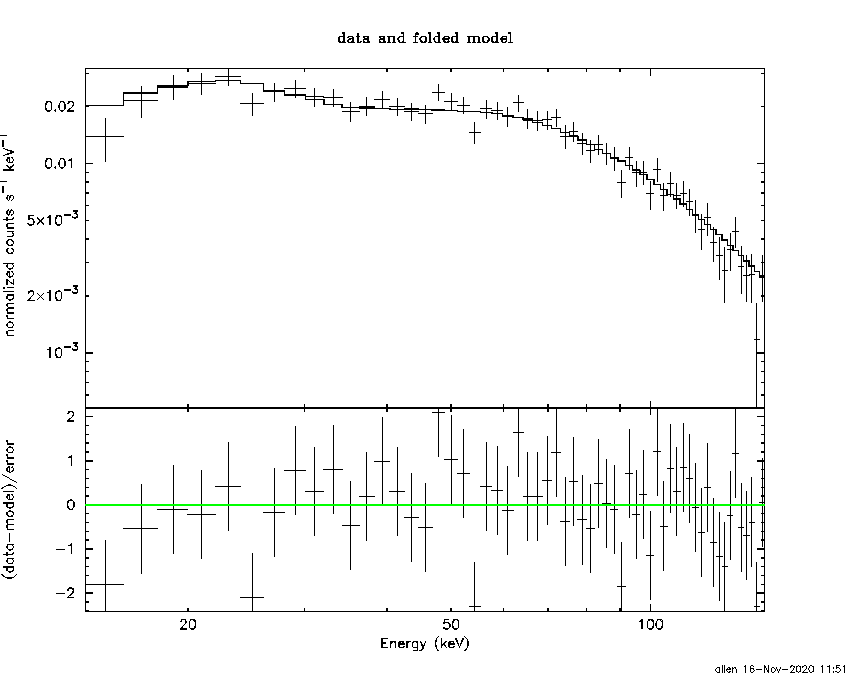
Time interval is from   22.244 sec. to   23.244 sec.

Spectral model in power-law:
------------------------------------------------------------
Parameters  : value       lower 90%   higher 90%
Photon index: -0.755694     ( -0.0503831   0.0508801 )
Norm@50keV  : 0.122785    ( -0.00375056   0.00373701 )
------------------------------------------------------------
#Fit statistic  : Chi-Squared                   49.50     using 59 bins.
 Reduced chi-squared = 0.868421
# Null hypothesis probability of 7.49e-01 with 57 degrees of freedom

Photon flux (15-150 keV)    in 1 sec: 0.409140 (    ) ph/cm2/s
Energy fluence (15-150 keV)             : 1.46241e-06 ( -4.45609e-08  4.46134e-08 ) ergs/cm2
Cutoff power-law model
Time interval is from   22.244 sec. to   23.244 sec.
Spectral model in the cutoff power-law:
------------------------------------------------------------
Parameters  : value       lower 90%   higher 90%
Photon index: -0.46936     ( -0.202146   0.212216 )
Epeak [keV] : 339.457      ( -116.109 595.312 )
Norm@50keV  : 0.160214    ( -0.0268736   0.0336098 )
------------------------------------------------------------
#Fit statistic  : Chi-Squared                   43.56     using 59 bins.
 Reduced chi-squared = 0.777857
# Null hypothesis probability of 8.87e-01 with 56 degrees of freedom

Photon flux (15-150 keV)    in 1 sec: 14.0274 ( -0.4247  0.4251 ) ph/cm2/s
Energy fluence (15-150 keV)             : 1.4566e-06 ( -4.53304e-08  4.52619e-08 ) ergs/cm2
Time-resolved spectra
Distribution
T90 vs. Hardness ratio plot
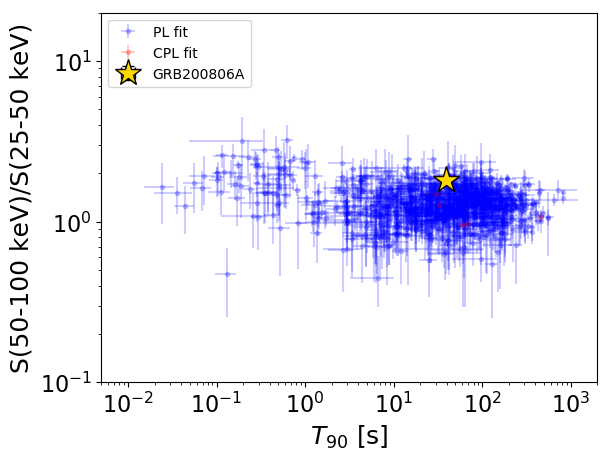
T90                                   = 38.688 sec.
Hardness ratio (energy fluence ratio) = 1.81852799689
S(15-50 keV) vs. S(50-150 keV) plot

S(15-50 keV)  = 4.849851e-06
S(50-150 keV) = 1.140771e-05
The dash-dotted line and the dashed line traces the fluences calculated from the Band function with Epeak = 15 and 150 keV, respectively. Both lines assume a canonical values of alpha = -1 and beta = -2.5.
Mask shadow pattern
IMX = 7.226485954659663E-01, IMY = 3.334527808191839E-01
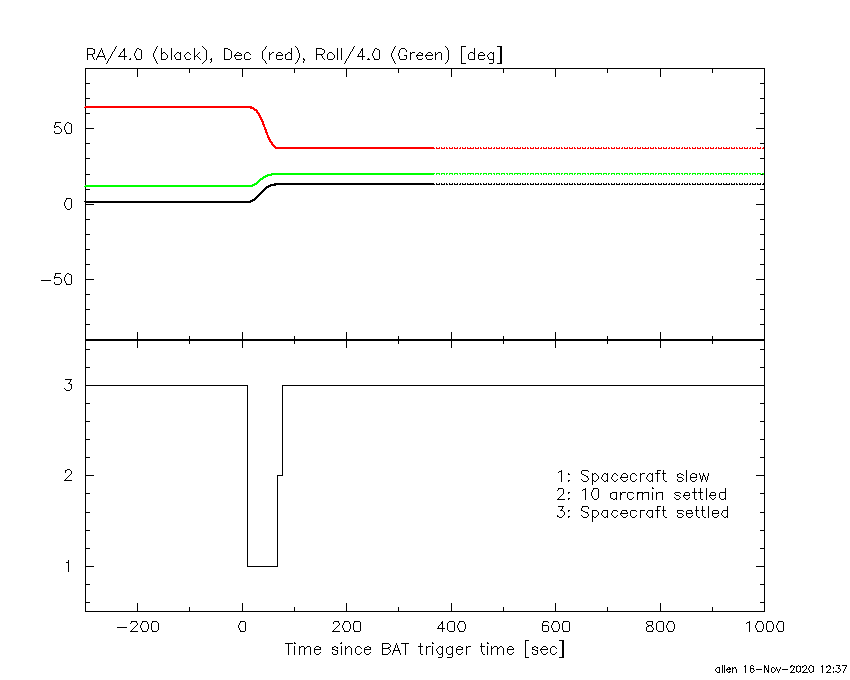
Spacecraft aspect plot
Bright source in the pre-burst/pre-slew/post-slew images
Pre-burst image of 15-350 keV band
Time interval of the image:
-239.328000 -0.132000

# RAcent  DECcent POSerr Theta    Phi  PeakCts   SNR AngSep     Name
#  [deg]    [deg]    ['] [deg]  [deg]                   [']
308.0359  40.9904    4.9  40.4  127.0   1.5567   2.4    4.1	Cyg X-3
326.1272  38.3523    3.3  35.1  105.5   1.7409   3.4    2.8	Cyg X-2
 33.4307  11.5096    3.6  55.9   10.9   3.5168   3.2 ------	UNKNOWN
262.2670  50.7917    2.5  51.0  171.1   3.4325   4.7 ------	UNKNOWN
 62.7175  37.2966    3.3  42.4  -35.2   1.3741   3.5 ------	UNKNOWN
 78.2807  45.8289    2.8  42.2  -56.7   2.4730   4.1 ------	UNKNOWN
197.9542  61.5333    2.2  54.0 -143.5   7.1009   5.3 ------	UNKNOWN
173.1012  67.0405    3.4  48.4 -129.8   3.7034   3.4 ------	UNKNOWN
Pre-slew background subtracted image of 15-350 keV band
Time interval of the image:
-0.132000 9.972590

# RAcent  DECcent POSerr Theta    Phi  PeakCts   SNR AngSep     Name
#  [deg]    [deg]    ['] [deg]  [deg]                   [']
308.0996  41.0121    2.9  40.3  127.0   0.4855   3.9    3.6	Cyg X-3
326.2923  38.4481   18.1  34.9  105.3   0.0553   0.6    9.5	Cyg X-2
284.2317  45.5726    3.1  46.9  151.3   0.4524   3.7 ------	UNKNOWN
 52.9344  37.0784    0.3  38.5  -24.8   2.7592  45.5 ------	UNKNOWN
 65.6971  40.8750    2.2  40.7  -41.1   0.4281   5.2 ------	UNKNOWN
Post-slew image of 15-350 keV band
Time interval of the image:
66.772600 962.828800

# RAcent  DECcent POSerr Theta    Phi  PeakCts   SNR AngSep     Name
#  [deg]    [deg]    ['] [deg]  [deg]                   [']
 83.6244  22.0067    0.3  30.5  -58.9  36.1131  36.9    0.7	Crab
 19.4800   8.5632    3.7  41.6   65.3   9.4175   3.1 ------	UNKNOWN
 36.8697 -12.9876    3.3  52.3   30.0  15.3503   3.5 ------	UNKNOWN
 52.3799 -18.8074    3.0  55.9   10.7  16.5616   3.9 ------	UNKNOWN