Analysis Summary
Notes:
- 1) No attempt has been made to eliminate the non-significant decimal places.
- 2) This batgrbproduct analysis is done using the HEASARC data.
- 3) This batgrbproduct analysis is using the flight position for the mask-weighting calculation.
======================================================================
                  BAT GRB EVENT DATA PROCESSING REPORT
    Process Script Ver: batgrbproduct v2.48
    Process Start Time: Sun Nov 15 19:44:47 EST 2020
             Host Name: bat1
   Current Working Dir: /local/data/bat1/alien/Swift_3rdBATcatalog/event/batevent_reproc/trigger992099
======================================================================

  Trigger: 00992099      Segment: 000

  BAT Trigger Time: 619544658.368   [s; MET]
      Trigger Stop: 619544660.416   [s; MET]
               UTC: 2020-08-19T15:43:52.881500    [includes UTCF correction]
       Where From?: TDRSS position message

  BAT
    RA: 21.4278910398901   Dec: 63.047912047578  [deg; J2000]

     Catalogged Source?: NO
     Point Source?:      YES
     GRB Indicated?:     YES    [ by BAT flight software ]
     Image S/N Ratio:    7.88
     Image Trigger?:     NO
     Rate S/N Ratio:     11.0905365064094  [ if not an image trigger ]
     Image S/N Ratio:    7.88

  Analysis Position:   [ source = BAT ]
    RA: 21.4278910398901   Dec: 63.047912047578  [deg; J2000]

  Refined Position:   [ source = BAT pre-slew burst ]
    RA: 21.5128351404812   Dec: 63.064006491373  [deg; J2000]
        { 01h 26m 03.1s , +63d 03' 50.4" }
         +/- 2.06652117653306 [arcmin] (estimated 90% radius based on SNR)
         +/- 1.03010351420509 [arcmin] (formal 1-sigma fit error)
    SNR: 10.7838967923737

  Angular difference between the analysis and refined position is 2.503159 arcmin

  Partial Coding Fraction: 0.9609375    [ including projection effects ]

  Duration
     T90: 26.9439998865128 +/- 7.06033421239206
        Measured from: 0.311999917030334
                   to: 27.2559998035431     [s; relative to TRIGTIME]
     T50: 11.4559998512268 +/- 6.70627169175706
        Measured from: 2.16799998283386
                   to: 13.6239998340607     [s; relative to TRIGTIME]


  Fluence
     Peak Flux  (peak 1 second)
        Measured from: 0.291999936103821
                   to: 1.29199993610382     [s; relative to TRIGTIME]
     Total Fluence
        Measured from: -0.712000012397766
                   to: 30.3279999494553     [s; relative to TRIGTIME]

             Band 1     Band 2     Band 3     Band 4
              15-25      25-50     50-100    100-350     keV
 Total     0.257306   0.250677   0.133832   0.019424
           0.033327   0.034364   0.030128   0.026360 [error]
 Peak      0.012888   0.030000   0.033044   0.009929
           0.006210   0.006479   0.005984   0.005065 [error]

     [ fluence units of on-axis counts / fully illuminated detector ]

======================================================================


====== Table of the duration information =============================

        Value   tstart    tstop
T100   31.040   -0.712   30.328
T90    26.944    0.312   27.256
T50    11.456    2.168   13.624
Peak    1.000    0.292    1.292


====== Spectral Analysis Summary =====================================

Model      : spectral model: simple power-law (PL) and cutoff power-law (CPL)
Ph_index   : photon index: E^{Ph_index}
Ph_90err   : 90% error of the photon index
Epeak      : Epeak in keV
Epeak_90err: 90% error of Epeak
Norm       : normalization at 50 keV in both the PL model and CPL model
Nomr_90err : 90% error of the normalization
chi2       : Chi-Squared
dof        : degree of freedo

=== Time-averaged spectral analysis ===
(Best model with acceptable fit: PL)

Model Ph_index Ph_90err_low Ph_90err_hi  Epeak  Epeak_90err_low  Epeak_90err_hi  Norm       Nomr_90err_low    Norm_90err_hi    chi2    dof
PL      -2.054    -0.308      0.280       -           -               -         1.15e-03     -2.43e-04          2.35e-04      54.380   57
CPL     -1.728    -0.388      1.327       32.657     -30.893       -32.657      1.82e-03     -9.74e-04          1.05e-02      54.090   56


=== 1-s peak spectral analysis ===
(Best model with acceptable fit: PL)

Model Ph_index Ph_90err_low Ph_90err_hi  Epeak  Epeak_90err_low  Epeak_90err_hi  Norm       Nomr_90err_low    Norm_90err_hi    chi2    dof
PL      -1.070     -0.394     0.415       -           -               -         5.35e-03     -1.25e-03          1.24e-03      60.820   57
CPL     -0.389     -2.085     2.100      133.399    -133.399      -133.399      1.09e-02     -6.57e-03          6.49e-02      60.230   56


=== Fluence/Peak Flux Summary ===

              Model    Band1     Band2     Band3     Band4     Band5     Total
                       15-25     25-50    50-100    100-350    15-150    15-350    keV
Fluence         PL   7.72e-08  1.01e-07  9.77e-08  1.68e-07  3.32e-07  4.44e-07   erg/cm2
      90%_error_low -1.50e-08 -1.57e-08 -2.71e-08 -7.59e-08 -6.24e-08 -1.12e-07   erg/cm2
      90%_error_hi   1.54e-08  1.56e-08  2.85e-08  1.10e-07  6.49e-08  1.39e-07   erg/cm2
Peak flux       PL   1.46e-01  1.90e-01  1.81e-01  3.06e-01  6.19e-01  8.23e-01   ph/cm2/s
      90%_error_low -6.18e-02 -5.47e-02 -4.66e-02 -1.38e-01 -1.47e-01 -2.00e-01   ph/cm2/s
      90%_error_hi   7.23e-02  5.32e-02  4.58e-02  1.99e-01  1.48e-01  2.13e-01   ph/cm2/s

Fluence        CPL   7.59e-08  1.06e-07  9.48e-08  8.61e-08  3.18e-07  3.62e-07   erg/cm2
      90%_error_low -1.60e-08 -1.93e-08 -3.48e-08    N/A    -7.16e-08 -1.13e-07   erg/cm2
      90%_error_hi   1.56e-08  2.14e-08  3.05e-08    N/A     7.00e-08  2.17e-07   erg/cm2
Peak flux      CPL   1.23e-01  1.97e-01  1.95e-01  1.64e-01  6.02e-01  6.79e-01   ph/cm2/s
      90%_error_low -7.59e-02 -6.05e-02 -5.52e-02 -1.64e-01 -1.53e-01 -2.07e-01   ph/cm2/s
      90%_error_hi   8.64e-02  6.12e-02  5.89e-02  2.00e-01  1.53e-01  2.59e-01   ph/cm2/s

======================================================================
Image
Pre-slew 15.0-350.0 keV image (Event data)
#   RAcent    DECcent   POSerr    Theta     Phi              Peak Cts       SNR   Name
   21.5128    63.0640   0.0178    22.2992  -167.6158         0.6665924     10.784 TRIG_00992099

Foreground time interval of the image:
 -0.712  25.533 (delta_t =  26.245 [sec])
Background time interval of the image:
-239.368  -0.712 (delta_t = 238.656 [sec])
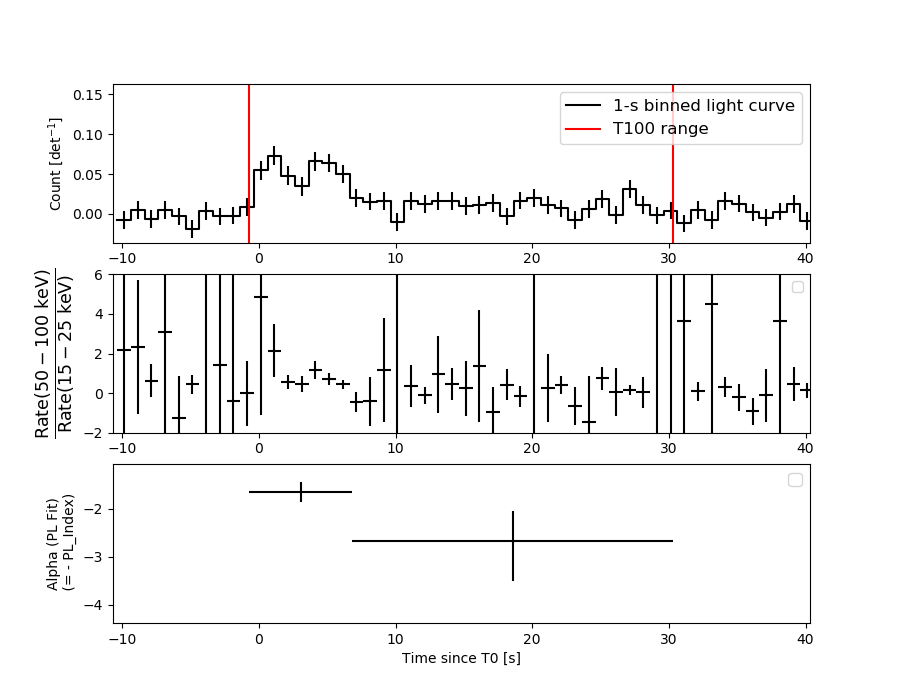
Light Curves
Note: The mask-weighted lightcurves have units of either count/det or counts/sec/det, where a det is 0.4 x 0.4 = 0.16 sq cm.
Full-time range; 1 s binning
Other quick-look light curves:
- 64 ms binning (zoomed)
- 16 ms binning (zoomed)
- 8 ms binning (zoomed)
- 2 ms binning (zoomed)
- SN=5 or 10 s binning (full-time range)
- Raw light curve
Spectra
- 64 ms binning (zoomed)
- 16 ms binning (zoomed)
- 8 ms binning (zoomed)
- 2 ms binning (zoomed)
- SN=5 or 10 s binning (full-time range)
- Raw light curve
Spectra
Notes:
- 1) The fitting includes the systematic errors.
- 2) When the burst includes telescope slew time periods, the fitting uses an average response file made from multiple 5-s response files through out the slew time plus single time preiod for the non-slew times, and weighted by the total counts in the corresponding time period using addrmf. An average response file is needed becuase a spectral fit using the pre-slew DRM will introduce some errors in both a spectral shape and a normalization if the PHA file contains a lot of the slew/post-slew time interval.
- 3) For fits to more complicated models (e.g. a power-law over a cutoff power-law), the BAT team has decided to require a chi-square improvement of more than 6 for each extra dof.
Time averaged spectrum fit using the average DRM
Power-law model
Time interval is from   -0.712 sec. to   30.328 sec.

Spectral model in power-law:
------------------------------------------------------------
Parameters  : value       lower 90%   higher 90%
Photon index: -2.0541     ( -0.308037   0.279909 )
Norm@50keV  : 1.15468E-03    ( -0.000243188   0.000235258 )
------------------------------------------------------------
#Fit statistic  : Chi-Squared                   54.38     using 59 bins.
 Reduced chi-squared = 0.954035
# Null hypothesis probability of 5.74e-01 with 57 degrees of freedom

Photon flux (15-150 keV)    in 31.04 sec: 0.177668 ( -0.026269  0.026271 ) ph/cm2/s
Energy fluence (15-150 keV)             : 3.31743e-07 ( -6.23653e-08  6.49382e-08 ) ergs/cm2
Cutoff power-law model
Time interval is from   -0.712 sec. to   30.328 sec.
Spectral model in the cutoff power-law:
------------------------------------------------------------
Parameters  : value       lower 90%   higher 90%
Photon index: -1.72796     ( -0.388281   1.32712 )
Epeak [keV] : 32.6571      ( -30.893 -32.6571 )
Norm@50keV  : 1.82089E-03    ( -0.000974299   0.0105457 )
------------------------------------------------------------
#Fit statistic  : Chi-Squared                   54.09     using 59 bins.
 Reduced chi-squared = 0.965893
# Null hypothesis probability of 5.48e-01 with 56 degrees of freedom

Photon flux (15-150 keV)    in 31.04 sec: 0.175761 ( -0.026837  0.026891 ) ph/cm2/s
Energy fluence (15-150 keV)             : 3.18495e-07 ( -7.1555e-08  6.99697e-08 ) ergs/cm2
1-s peak spectrum fit
Power-law model
Time interval is from    0.292 sec. to    1.292 sec.

Spectral model in power-law:
------------------------------------------------------------
Parameters  : value       lower 90%   higher 90%
Photon index: -1.07005     ( -0.393538   0.415157 )
Norm@50keV  : 5.35172E-03    ( -0.00124593   0.00124176 )
------------------------------------------------------------
#Fit statistic  : Chi-Squared                   60.82     using 59 bins.
 Reduced chi-squared = 1.06702
# Null hypothesis probability of 3.40e-01 with 57 degrees of freedom

Photon flux (15-150 keV)    in 1 sec: 0.619089 ( -0.147095  0.14792 ) ph/cm2/s
Energy fluence (15-150 keV)             : 5.65067e-08 ( -1.41444e-08  1.43319e-08 ) ergs/cm2
Cutoff power-law model
Time interval is from    0.292 sec. to    1.292 sec.
Spectral model in the cutoff power-law:
------------------------------------------------------------
Parameters  : value       lower 90%   higher 90%
Photon index: -0.388637     ( -2.08468   2.09991 )
Epeak [keV] : 133.399      ( -133.393 -133.393 )
Norm@50keV  : 1.08718E-02    ( -0.00656608   0.064855 )
------------------------------------------------------------
#Fit statistic  : Chi-Squared                   60.23     using 59 bins.
 Reduced chi-squared = 1.07554
# Null hypothesis probability of 3.26e-01 with 56 degrees of freedom

Photon flux (15-150 keV)    in 1 sec: 0.601722 ( -0.152666  0.15281 ) ph/cm2/s
Energy fluence (15-150 keV)             : 5.45519e-08 ( -1.49743e-08  1.50707e-08 ) ergs/cm2
Time-resolved spectra
Distribution
T90 vs. Hardness ratio plot
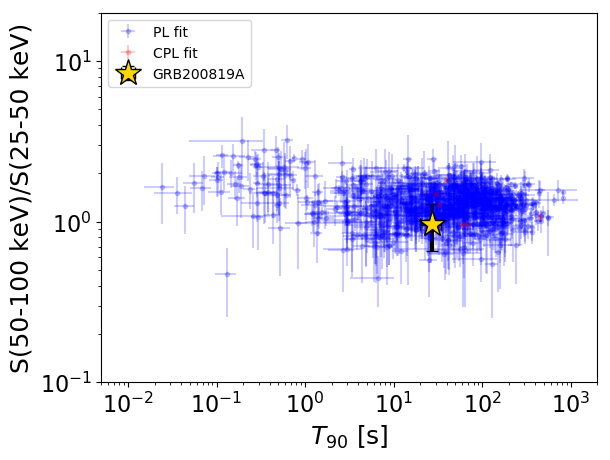
T90                                   = 26.944 sec.
Hardness ratio (energy fluence ratio) = 0.963252002694
S(15-50 keV) vs. S(50-150 keV) plot
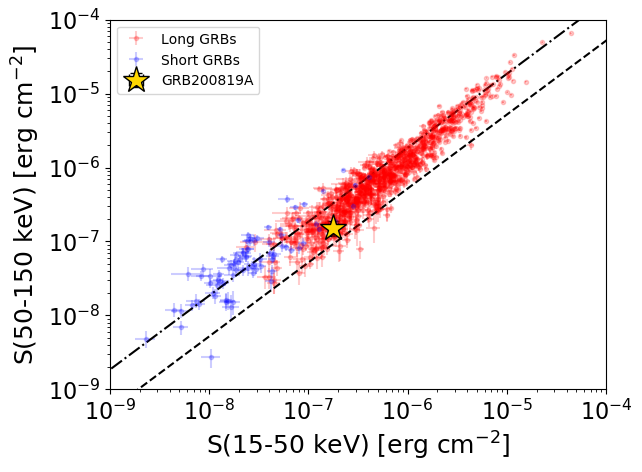
S(15-50 keV)  = 1.786088e-07
S(50-150 keV) = 1.5313357e-07
The dash-dotted line and the dashed line traces the fluences calculated from the Band function with Epeak = 15 and 150 keV, respectively. Both lines assume a canonical values of alpha = -1 and beta = -2.5.
Mask shadow pattern
IMX = -4.005701245528479E-01, IMY = 8.795511655533213E-02
Spacecraft aspect plot
Bright source in the pre-burst/pre-slew/post-slew images
Pre-burst image of 15-350 keV band
Time interval of the image:
-239.368000 -0.712000

# RAcent  DECcent POSerr Theta    Phi  PeakCts   SNR AngSep     Name
#  [deg]    [deg]    ['] [deg]  [deg]                   [']
 83.6145  22.0082    0.7  44.7  -49.1   9.9860  15.5    1.1	Crab
356.1080  18.7787    2.3  40.8   96.4   4.9701   5.1 ------	UNKNOWN
 18.6218   6.7705    2.4  38.6   57.0   2.6128   4.7 ------	UNKNOWN
 51.0199  -5.5505    3.3  49.9    9.1   2.1389   3.4 ------	UNKNOWN
 23.5766  37.6858    2.1  10.3   96.5   1.3160   5.6 ------	UNKNOWN
 13.0712  53.5854    2.7  18.7  164.0   0.9869   4.3 ------	UNKNOWN
 78.4117  36.4747    2.7  33.2  -65.1   1.8446   4.3 ------	UNKNOWN
Pre-slew background subtracted image of 15-350 keV band
Time interval of the image:
-0.712000 25.532600

# RAcent  DECcent POSerr Theta    Phi  PeakCts   SNR AngSep     Name
#  [deg]    [deg]    ['] [deg]  [deg]                   [']
 83.6777  22.0665   16.2  44.7  -49.2  -0.1161  -0.7    4.0	Crab
 21.5127  63.0640    1.1  22.3 -167.6   0.6666  10.8 ------	UNKNOWN
Post-slew image of 15-350 keV band
Time interval of the image:
68.932590 604.232600

# RAcent  DECcent POSerr Theta    Phi  PeakCts   SNR AngSep     Name
#  [deg]    [deg]    ['] [deg]  [deg]                   [']
308.0043  40.9533   14.8  47.0  137.9   1.6911   0.8    4.8	Cyg X-3
326.1592  38.3409   30.1  40.9  119.3  -0.6639  -0.4    1.3	Cyg X-2
286.8774  43.8813    3.5  53.7  156.6   8.6149   3.3 ------	UNKNOWN
 33.4038  26.2964    2.7  37.6   21.8   3.1686   4.2 ------	UNKNOWN
266.9617  48.8197    2.2  56.8  173.9  13.3591   5.3 ------	UNKNOWN
223.6385  67.7275    3.0  48.3 -151.5   4.1470   3.8 ------	UNKNOWN
 84.9630  32.5345    2.7  49.5  -43.5   7.3317   4.2 ------	UNKNOWN