Analysis Summary
Notes:
- 1) No attempt has been made to eliminate the non-significant decimal places.
- 2) This batgrbproduct analysis is done using the HEASARC data.
- 3) This batgrbproduct analysis is using the flight position for the mask-weighting calculation.
======================================================================
BAT GRB EVENT DATA PROCESSING REPORT
Process Script Ver: batgrbproduct v2.48
Process Start Time: Wed Oct 19 23:59:03 EDT 2022
Host Name: batproc1
Current Working Dir: /local/data/bat1/alien/Swift_3rdBATcatalog/event/batevent_reproc/trigger994143
======================================================================
Trigger: 00994143 Segment: 000
BAT Trigger Time: 620624877.12 [s; MET]
Trigger Stop: 620624878.144 [s; MET]
UTC: 2020-09-01T03:47:31.562720 [includes UTCF correction]
Where From?: TDRSS position message
BAT
RA: 61.7575803016358 Dec: -59.8799948410037 [deg; J2000]
Catalogged Source?: NO
Point Source?: YES
GRB Indicated?: YES [ by BAT flight software ]
Image S/N Ratio: 17.5
Image Trigger?: NO
Rate S/N Ratio: 44 [ if not an image trigger ]
Image S/N Ratio: 17.5
Analysis Position: [ source = BAT ]
RA: 61.7575803016358 Dec: -59.8799948410037 [deg; J2000]
Refined Position: [ source = BAT pre-slew burst ]
RA: 61.7597438154546 Dec: -59.9012110074026 [deg; J2000]
{ 04h 07m 02.3s , -59d 54' 04.4" }
+/- 1.13778612808355 [arcmin] (estimated 90% radius based on SNR)
+/- 0.366614758815567 [arcmin] (formal 1-sigma fit error)
SNR: 25.2948296650211
Angular difference between the analysis and refined position is 1.274635 arcmin
Partial Coding Fraction: 0.2148438 [ including projection effects ]
Duration
T90: 20.3519999980927 +/- 7.58655228712125
Measured from: -3.88800001144409
to: 16.4639999866486 [s; relative to TRIGTIME]
T50: 4.92800009250641 +/- 0.838436735765795
Measured from: -1.42400002479553
to: 3.50400006771088 [s; relative to TRIGTIME]
Fluence
Peak Flux (peak 1 second)
Measured from: -0.0119999647140503
to: 0.98800003528595 [s; relative to TRIGTIME]
Total Fluence
Measured from: -4.432000041008
to: 26.9119999408722 [s; relative to TRIGTIME]
Band 1 Band 2 Band 3 Band 4
15-25 25-50 50-100 100-350 keV
Total 1.380540 1.717062 1.243571 0.316166
0.088481 0.091258 0.077976 0.065089 [error]
Peak 0.241599 0.324056 0.277800 0.044926
0.021252 0.024707 0.020855 0.013820 [error]
[ fluence units of on-axis counts / fully illuminated detector ]
======================================================================
====== Table of the duration information =============================
Value tstart tstop
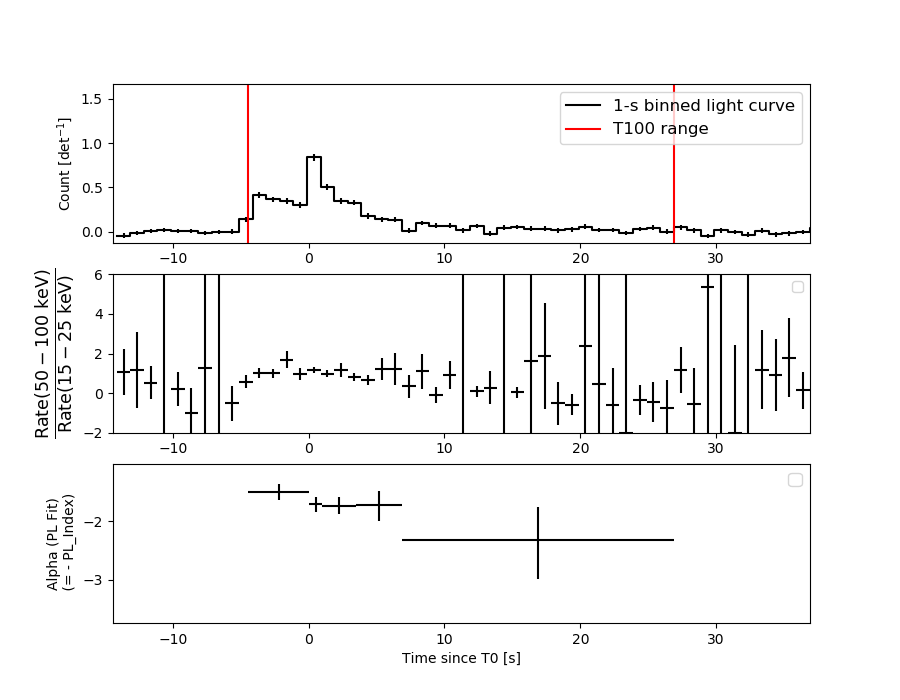
T100 31.344 -4.432 26.912
T90 20.352 -3.888 16.464
T50 4.928 -1.424 3.504
Peak 1.000 -0.012 0.988
====== Spectral Analysis Summary =====================================
Model : spectral model: simple power-law (PL) and cutoff power-law (CPL)
Ph_index : photon index: E^{Ph_index}
Ph_90err : 90% error of the photon index
Epeak : Epeak in keV
Epeak_90err: 90% error of Epeak
Norm : normalization at 50 keV in both the PL model and CPL model
Nomr_90err : 90% error of the normalization
chi2 : Chi-Squared
dof : degree of freedo
=== Time-averaged spectral analysis ===
(Best model with acceptable fit: N/A)
Model Ph_index Ph_90err_low Ph_90err_hi Epeak Epeak_90err_low Epeak_90err_hi Norm Nomr_90err_low Norm_90err_hi chi2 dof
PL -1.705 -0.107 0.106 - - - 1.00e-02 -6.18e-04 6.15e-04 54.720 57
CPL -1.619 -0.393 0.408 216.278 -141.608 -216.278 1.11e-02 -2.48e-03 6.67e-03 54.570 56
=== 1-s peak spectral analysis ===
(Best model with acceptable fit: N/A)
Model Ph_index Ph_90err_low Ph_90err_hi Epeak Epeak_90err_low Epeak_90err_hi Norm Nomr_90err_low Norm_90err_hi chi2 dof
PL -1.694 -0.130 0.126 - - - 5.78e-02 -4.87e-03 4.84e-03 70.270 57
CPL -0.978 -0.501 0.563 73.811 -14.589 51.775 1.32e-01 -5.67e-02 1.16e-01 64.000 56
=== Fluence/Peak Flux Summary ===
Model Band1 Band2 Band3 Band4 Band5 Total
15-25 25-50 50-100 100-350 15-150 15-350 keV
Fluence PL 4.86e-07 7.88e-07 9.66e-07 2.33e-06 2.90e-06 4.57e-06 erg/cm2
90%_error_low -4.83e-08 -4.84e-08 -7.87e-08 -3.81e-07 -1.87e-07 -4.49e-07 erg/cm2
90%_error_hi 4.97e-08 4.82e-08 7.85e-08 4.28e-07 1.88e-07 4.84e-07 erg/cm2
Peak flux PL 2.86e+00 2.57e+00 1.59e+00 1.49e+00 7.65e+00 8.52e+00 ph/cm2/s
90%_error_low -3.55e-01 -2.14e-01 -1.66e-01 -2.82e-01 -6.28e-01 -6.83e-01 ph/cm2/s
90%_error_hi 3.66e-01 2.13e-01 1.64e-01 3.14e-01 6.29e-01 6.83e-01 ph/cm2/s
Fluence CPL 4.69e-07 6.34e-07 6.59e-07 1.44e-06 2.12e-06 3.14e-06 erg/cm2
90%_error_low -6.73e-08 -8.35e-08 -7.27e-08 -1.82e-07 -2.49e-07 -5.68e-07 erg/cm2
90%_error_hi 5.94e-08 6.61e-08 4.81e-08 2.25e-07 2.19e-07 2.91e-07 erg/cm2
Peak flux CPL 2.52e+00 2.77e+00 1.73e+00 7.94e-01 7.52e+00 7.81e+00 ph/cm2/s
90%_error_low -4.25e-01 -2.56e-01 -1.98e-01 -2.94e-01 -6.38e-01 -7.16e-01 ph/cm2/s
90%_error_hi 4.33e-01 2.62e-01 2.03e-01 4.52e-01 6.38e-01 7.54e-01 ph/cm2/s
======================================================================
Image
Pre-slew 15.0-350.0 keV image (Event data)
#   RAcent    DECcent   POSerr    Theta     Phi              Peak Cts       SNR   Name
   61.7597   -59.9012   0.0076    39.8783   136.3441         4.9033566     25.295 TRIG_00994143

Foreground time interval of the image:
 -4.432  26.912 (delta_t =  31.344 [sec])
Background time interval of the image:
-239.120  -4.432 (delta_t = 234.688 [sec])
Light Curves
Note: The mask-weighted lightcurves have units of either count/det or counts/sec/det, where a det is 0.4 x 0.4 = 0.16 sq cm.
Full-time range; 1 s binning
Other quick-look light curves:
- 64 ms binning (zoomed)
- 16 ms binning (zoomed)
- 8 ms binning (zoomed)
- 2 ms binning (zoomed)
- SN=5 or 10 s binning (full-time range)
- Raw light curve
Spectra
- 64 ms binning (zoomed)
- 16 ms binning (zoomed)
- 8 ms binning (zoomed)
- 2 ms binning (zoomed)
- SN=5 or 10 s binning (full-time range)
- Raw light curve
Spectra
Notes:
- 1) The fitting includes the systematic errors.
- 2) When the burst includes telescope slew time periods, the fitting uses an average response file made from multiple 5-s response files through out the slew time plus single time preiod for the non-slew times, and weighted by the total counts in the corresponding time period using addrmf. An average response file is needed becuase a spectral fit using the pre-slew DRM will introduce some errors in both a spectral shape and a normalization if the PHA file contains a lot of the slew/post-slew time interval.
- 3) For fits to more complicated models (e.g. a power-law over a cutoff power-law), the BAT team has decided to require a chi-square improvement of more than 6 for each extra dof.
Time averaged spectrum fit using the average DRM
Power-law model
Time interval is from   -4.432 sec. to   26.912 sec.

Spectral model in power-law:
------------------------------------------------------------
Parameters  : value       lower 90%   higher 90%
Photon index: -1.70546     ( -0.107089   0.10611 )
Norm@50keV  : 1.00087E-02    ( -0.000617933   0.000614828 )
------------------------------------------------------------
#Fit statistic  : Chi-Squared                   54.72     using 59 bins.
 Reduced chi-squared = 0.96
# Null hypothesis probability of 5.61e-01 with 57 degrees of freedom

Photon flux (15-150 keV)    in 31.34 sec: 1.33187 ( -0.08229  0.08246 ) ph/cm2/s
Energy fluence (15-150 keV)             : 2.90341e-06 ( -1.86542e-07  1.87516e-07 ) ergs/cm2
Cutoff power-law model
Time interval is from   -4.432 sec. to   26.912 sec.
Spectral model in the cutoff power-law:
------------------------------------------------------------
Parameters  : value       lower 90%   higher 90%
Photon index: -1.619     ( -0.392754   0.407868 )
Epeak [keV] : 216.278      ( -141.626 -216.296 )
Norm@50keV  : 1.10900E-02    ( -0.00248063   0.00666712 )
------------------------------------------------------------
#Fit statistic  : Chi-Squared                   54.57     using 59 bins.
 Reduced chi-squared = 0.974464
# Null hypothesis probability of 5.29e-01 with 56 degrees of freedom

Photon flux (15-150 keV)    in 31.34 sec: 1.32625 ( -0.08583  0.08502 ) ph/cm2/s
Energy fluence (15-150 keV)             : 2.11519e-06 ( -2.48983e-07  2.19233e-07 ) ergs/cm2
1-s peak spectrum fit
Power-law model
Time interval is from   -0.012 sec. to    0.988 sec.

Spectral model in power-law:
------------------------------------------------------------
Parameters  : value       lower 90%   higher 90%
Photon index: -1.6938     ( -0.129741   0.126324 )
Norm@50keV  : 5.77593E-02    ( -0.0048711   0.0048398 )
------------------------------------------------------------
#Fit statistic  : Chi-Squared                   70.27     using 59 bins.
 Reduced chi-squared = 1.23281
# Null hypothesis probability of 1.11e-01 with 57 degrees of freedom

Photon flux (15-150 keV)    in 1 sec: 7.65487 ( -0.62841  0.629 ) ph/cm2/s
Energy fluence (15-150 keV)             : 5.35131e-07 ( -4.68161e-08  4.70258e-08 ) ergs/cm2
Cutoff power-law model
Time interval is from   -0.012 sec. to    0.988 sec.
Spectral model in the cutoff power-law:
------------------------------------------------------------
Parameters  : value       lower 90%   higher 90%
Photon index: -0.977827     ( -0.500674   0.562685 )
Epeak [keV] : 73.8111      ( -14.589 51.7748 )
Norm@50keV  : 0.131943    ( -0.0566626   0.115961 )
------------------------------------------------------------
#Fit statistic  : Chi-Squared                   64.00     using 59 bins.
 Reduced chi-squared = 1.14286
# Null hypothesis probability of 2.16e-01 with 56 degrees of freedom

Photon flux (15-150 keV)    in 1 sec: 7.51674 ( -0.63763  0.63762 ) ph/cm2/s
Energy fluence (15-150 keV)             : 5.25037e-07 ( -4.8178e-08  4.82472e-08 ) ergs/cm2
Time-resolved spectra
Distribution
T90 vs. Hardness ratio plot
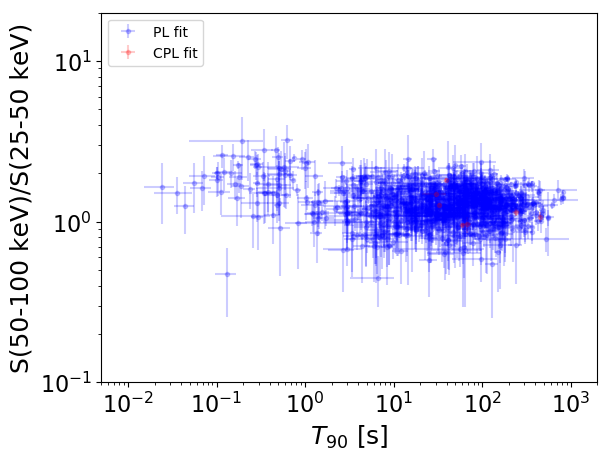
T90                                   = N/A sec.
Hardness ratio (energy fluence ratio) = N/A
S(15-50 keV) vs. S(50-150 keV) plot
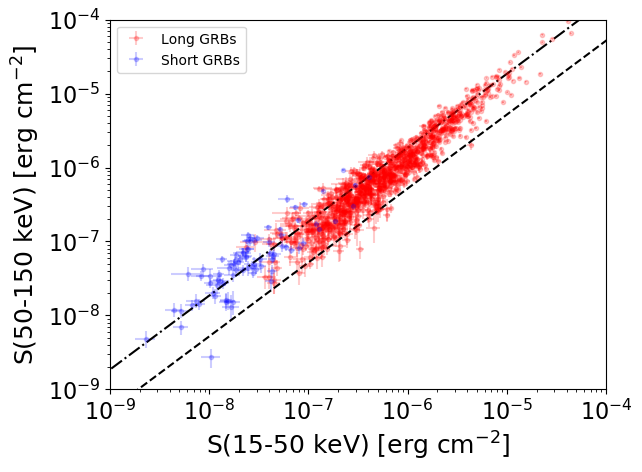
S(15-50 keV)  = N/A
S(50-150 keV) = N/A
The dash-dotted line and the dashed line traces the fluences calculated from the Band function with Epeak = 15 and 150 keV, respectively. Both lines assume a canonical values of alpha = -1 and beta = -2.5.
Mask shadow pattern
IMX = -6.044740482950214E-01, IMY = -5.767586574380681E-01
Spacecraft aspect plot
Bright source in the pre-burst/pre-slew/post-slew images
Pre-burst image of 15-350 keV band
Time interval of the image:
-239.120000 -4.432000

# RAcent  DECcent POSerr Theta    Phi  PeakCts   SNR AngSep     Name
#  [deg]    [deg]    ['] [deg]  [deg]                   [']
135.6029 -40.5900    1.8  22.9 -124.9   1.8064   6.4    4.0	Vela X-1
170.5007 -60.4515    3.8   9.8   -3.5   0.7340   3.0   11.6	Cen X-3
186.6892 -62.7987    1.2  16.7   14.7   2.0984   9.3    1.9	GX 301-2
226.9856 -32.6355    3.2  55.4    0.8   3.3058   3.6 ------	UNKNOWN
196.0097 -29.5056    2.4  43.8  -31.0   2.1188   4.7 ------	UNKNOWN
143.9466 -34.7355    2.8  27.3 -106.7   1.2768   4.1 ------	UNKNOWN
124.9049 -24.9643    3.3  40.6 -131.9   1.5789   3.5 ------	UNKNOWN
177.5935 -23.6647    2.2  42.3  -56.6   3.4741   5.2 ------	UNKNOWN
152.3884 -21.0205    3.9  40.7  -92.2   3.2455   3.0 ------	UNKNOWN
Pre-slew background subtracted image of 15-350 keV band
Time interval of the image:
-4.432000 26.912000

# RAcent  DECcent POSerr Theta    Phi  PeakCts   SNR AngSep     Name
#  [deg]    [deg]    ['] [deg]  [deg]                   [']
135.6036 -40.5757    5.7  22.9 -124.9   0.1851   2.0    3.6	Vela X-1
170.6056 -60.7430    4.1   9.7   -1.7  -0.2146  -2.9   11.2	Cen X-3
186.7488 -62.6716    5.5  16.8   14.3   0.1602   2.1    6.4	GX 301-2
 51.0033 -81.9884    2.3  30.6  100.6   0.6252   4.9 ------	UNKNOWN
 61.7597 -59.9012    0.5  39.9  136.3   4.9036  25.3 ------	UNKNOWN
243.0330 -43.0485    2.8  54.2   20.7   1.5443   4.1 ------	UNKNOWN
172.1260 -44.8317    2.5  21.1  -48.2   0.3658   4.7 ------	UNKNOWN
Post-slew image of 15-350 keV band
Time interval of the image:
573.280600 784.480600

# RAcent  DECcent POSerr Theta    Phi  PeakCts   SNR AngSep     Name
#  [deg]    [deg]    ['] [deg]  [deg]                   [']
170.3654 -60.6645    7.7  45.9 -179.1   0.7082   1.5    2.9	Cen X-3
186.6057 -62.7446    2.3  43.5  170.1   2.3022   5.0    2.1	GX 301-2
244.9903 -15.6567    1.2  40.7   69.9   7.9790   9.5    1.2	Sco X-1
206.4517  33.5151    2.4  54.3  -16.2   3.4532   4.9 ------	UNKNOWN
178.2307  -7.2117    4.3  27.0  -84.0   0.8216   2.7 ------	UNKNOWN
156.7657 -34.9633    3.1  42.4 -140.1   1.6170   3.7 ------	UNKNOWN
150.0018 -27.2934    2.7  48.0 -129.0   4.4728   4.2 ------	UNKNOWN