Analysis Summary
Notes:
- 1) No attempt has been made to eliminate the non-significant decimal places.
- 2) This batgrbproduct analysis is done using the HEASARC data.
- 3) This batgrbproduct analysis is using the flight position for the mask-weighting calculation.
======================================================================
BAT GRB EVENT DATA PROCESSING REPORT
Process Script Ver: batgrbproduct v2.48
Process Start Time: Wed Oct 19 23:51:15 EDT 2022
Host Name: batproc1
Current Working Dir: /local/data/bat1/alien/Swift_3rdBATcatalog/event/batevent_reproc/trigger994389
======================================================================
Trigger: 00994389 Segment: 000
BAT Trigger Time: 620786688 [s; MET]
Trigger Stop: 620786689.024 [s; MET]
UTC: 2020-09-03T00:44:22.432080 [includes UTCF correction]
Where From?: TDRSS position message
BAT
RA: 164.311253143984 Dec: 50.500692051524 [deg; J2000]
Catalogged Source?: NO
Point Source?: YES
GRB Indicated?: YES [ by BAT flight software ]
Image S/N Ratio: 17.74
Image Trigger?: NO
Rate S/N Ratio: 43.7264222181509 [ if not an image trigger ]
Image S/N Ratio: 17.74
Analysis Position: [ source = BAT ]
RA: 164.311253143984 Dec: 50.500692051524 [deg; J2000]
Refined Position: [ source = BAT pre-slew burst ]
RA: 164.312289776971 Dec: 50.4872607263471 [deg; J2000]
{ 10h 57m 14.9s , +50d 29' 14.1" }
+/- 0.759752937229253 [arcmin] (estimated 90% radius based on SNR)
+/- 0.35870962603962 [arcmin] (formal 1-sigma fit error)
SNR: 45.0387571380637
Angular difference between the analysis and refined position is 0.806850 arcmin
Partial Coding Fraction: 0.6796875 [ including projection effects ]
Duration
T90: 22.9119999408722 +/- 7.35864474962099
Measured from: -15.5520000457764
to: 7.35999989509583 [s; relative to TRIGTIME]
T50: 5.54799997806549 +/- 0.687825536536594
Measured from: -1.55200004577637
to: 3.99599993228912 [s; relative to TRIGTIME]
Fluence
Peak Flux (peak 1 second)
Measured from: 0.144000053405762
to: 1.14400005340576 [s; relative to TRIGTIME]
Total Fluence
Measured from: -19.1759999990463
to: 10.87600004673 [s; relative to TRIGTIME]
Band 1 Band 2 Band 3 Band 4
15-25 25-50 50-100 100-350 keV
Total 1.184777 1.703103 1.300645 0.196270
0.045353 0.048389 0.043012 0.036242 [error]
Peak 0.112691 0.167656 0.144286 0.025022
0.009459 0.011187 0.010149 0.007278 [error]
[ fluence units of on-axis counts / fully illuminated detector ]
======================================================================
====== Table of the duration information =============================
Value tstart tstop
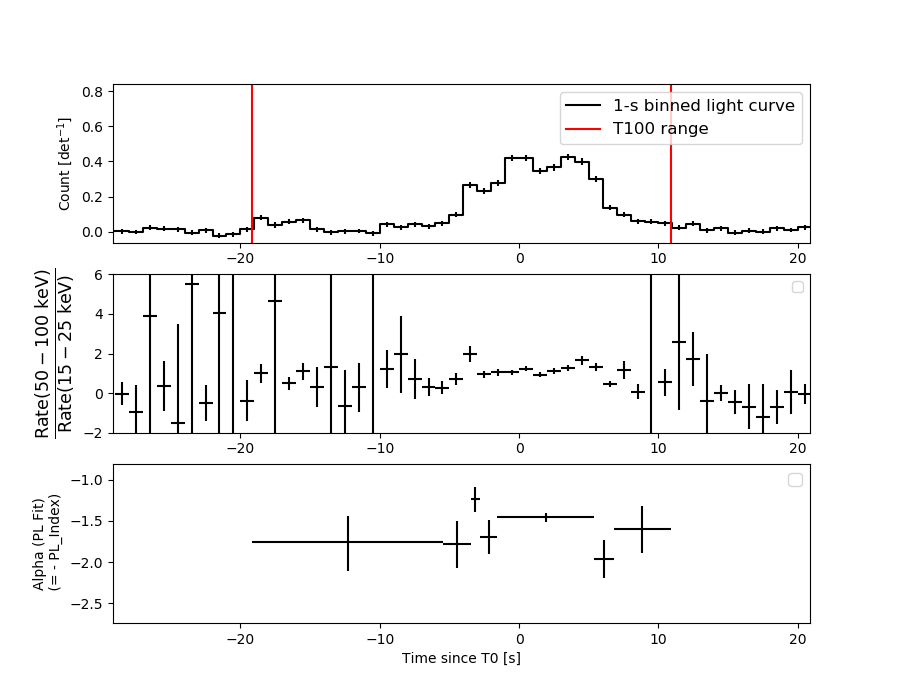
T100 30.052 -19.176 10.876
T90 22.912 -15.552 7.360
T50 5.548 -1.552 3.996
Peak 1.000 0.144 1.144
====== Spectral Analysis Summary =====================================
Model : spectral model: simple power-law (PL) and cutoff power-law (CPL)
Ph_index : photon index: E^{Ph_index}
Ph_90err : 90% error of the photon index
Epeak : Epeak in keV
Epeak_90err: 90% error of Epeak
Norm : normalization at 50 keV in both the PL model and CPL model
Nomr_90err : 90% error of the normalization
chi2 : Chi-Squared
dof : degree of freedo
=== Time-averaged spectral analysis ===
(Best model with acceptable fit: N/A)
Model Ph_index Ph_90err_low Ph_90err_hi Epeak Epeak_90err_low Epeak_90err_hi Norm Nomr_90err_low Norm_90err_hi chi2 dof
PL -1.550 -0.063 0.062 - - - 1.01e-02 -3.51e-04 3.51e-04 63.650 57
CPL -1.040 -0.256 0.272 97.097 -17.364 45.121 1.79e-02 -4.34e-03 6.16e-03 51.390 56
=== 1-s peak spectral analysis ===
(Best model with acceptable fit: N/A)
Model Ph_index Ph_90err_low Ph_90err_hi Epeak Epeak_90err_low Epeak_90err_hi Norm Nomr_90err_low Norm_90err_hi chi2 dof
PL -1.387 -0.116 0.115 - - - 3.08e-02 -2.22e-03 2.21e-03 58.060 57
CPL -0.638 -0.477 0.535 94.622 -20.558 72.844 7.19e-02 -2.95e-02 5.77e-02 50.460 56
=== Fluence/Peak Flux Summary ===
Model Band1 Band2 Band3 Band4 Band5 Total
15-25 25-50 50-100 100-350 15-150 15-350 keV
Fluence PL 4.06e-07 7.24e-07 9.88e-07 2.79e-06 2.86e-06 4.91e-06 erg/cm2
90%_error_low -2.53e-08 -2.70e-08 -4.42e-08 -2.65e-07 -1.06e-07 -2.97e-07 erg/cm2
90%_error_hi 2.58e-08 2.70e-08 4.41e-08 2.83e-07 1.07e-07 3.11e-07 erg/cm2
Peak flux PL 1.14e+00 1.22e+00 9.35e-01 1.17e+00 3.73e+00 4.46e+00 ph/cm2/s
90%_error_low -1.35e-01 -9.39e-02 -8.18e-02 -1.93e-01 -2.69e-01 -3.27e-01 ph/cm2/s
90%_error_hi 1.39e-01 9.34e-02 8.12e-02 2.14e-01 2.69e-01 3.29e-01 ph/cm2/s
Fluence CPL 3.66e-07 7.53e-07 1.02e-06 1.41e-06 2.75e-06 3.55e-06 erg/cm2
90%_error_low -3.12e-08 -3.12e-08 -4.86e-08 -3.73e-07 -1.19e-07 -3.89e-07 erg/cm2
90%_error_hi 3.17e-08 3.15e-08 4.90e-08 5.39e-07 1.19e-07 5.44e-07 erg/cm2
Peak flux CPL 9.84e-01 1.31e+00 1.01e+00 5.72e-01 3.65e+00 3.88e+00 ph/cm2/s
90%_error_low -1.62e-01 -1.11e-01 -9.69e-02 -2.02e-01 -2.75e-01 -3.47e-01 ph/cm2/s
90%_error_hi 1.66e-01 1.14e-01 9.88e-02 3.20e-01 2.75e-01 4.00e-01 ph/cm2/s
======================================================================
Image
Pre-slew 15.0-350.0 keV image (Event data)
#   RAcent    DECcent   POSerr    Theta     Phi              Peak Cts       SNR   Name
  164.3123    50.4873   0.0043    26.7965   -45.3375         4.5626258     45.039 TRIG_00994389

Foreground time interval of the image:
-19.176  10.876 (delta_t =  30.052 [sec])
Background time interval of the image:
-239.000 -19.176 (delta_t = 219.824 [sec])
Light Curves
Note: The mask-weighted lightcurves have units of either count/det or counts/sec/det, where a det is 0.4 x 0.4 = 0.16 sq cm.
Full-time range; 1 s binning
Other quick-look light curves:
- 64 ms binning (zoomed)
- 16 ms binning (zoomed)
- 8 ms binning (zoomed)
- 2 ms binning (zoomed)
- SN=5 or 10 s binning (full-time range)
- Raw light curve
Spectra
- 64 ms binning (zoomed)
- 16 ms binning (zoomed)
- 8 ms binning (zoomed)
- 2 ms binning (zoomed)
- SN=5 or 10 s binning (full-time range)
- Raw light curve
Spectra
Notes:
- 1) The fitting includes the systematic errors.
- 2) When the burst includes telescope slew time periods, the fitting uses an average response file made from multiple 5-s response files through out the slew time plus single time preiod for the non-slew times, and weighted by the total counts in the corresponding time period using addrmf. An average response file is needed becuase a spectral fit using the pre-slew DRM will introduce some errors in both a spectral shape and a normalization if the PHA file contains a lot of the slew/post-slew time interval.
- 3) For fits to more complicated models (e.g. a power-law over a cutoff power-law), the BAT team has decided to require a chi-square improvement of more than 6 for each extra dof.
Time averaged spectrum fit using the average DRM
Power-law model
Time interval is from  -19.176 sec. to   10.876 sec.

Spectral model in power-law:
------------------------------------------------------------
Parameters  : value       lower 90%   higher 90%
Photon index: -1.5504     ( -0.0626394   0.0624645 )
Norm@50keV  : 1.00950E-02    ( -0.000351434   0.000351111 )
------------------------------------------------------------
#Fit statistic  : Chi-Squared                   63.65     using 59 bins.
 Reduced chi-squared = 1.11667
# Null hypothesis probability of 2.54e-01 with 57 degrees of freedom

Photon flux (15-150 keV)    in 30.05 sec: 1.27815 ( -0.04652  0.0466 ) ph/cm2/s
Energy fluence (15-150 keV)             : 2.85604e-06 ( -1.06474e-07  1.06772e-07 ) ergs/cm2
Cutoff power-law model
Time interval is from  -19.176 sec. to   10.876 sec.
Spectral model in the cutoff power-law:
------------------------------------------------------------
Parameters  : value       lower 90%   higher 90%
Photon index: -1.04006     ( -0.256043   0.271785 )
Epeak [keV] : 97.0968      ( -17.3636 45.1216 )
Norm@50keV  : 1.78597E-02    ( -0.00434387   0.0061554 )
------------------------------------------------------------
#Fit statistic  : Chi-Squared                   51.39     using 59 bins.
 Reduced chi-squared = 0.917679
# Null hypothesis probability of 6.50e-01 with 56 degrees of freedom

Photon flux (15-150 keV)    in 30.05 sec: 1.23822 ( -0.05015  0.05025 ) ph/cm2/s
Energy fluence (15-150 keV)             : 2.74843e-06 ( -1.19286e-07  1.19209e-07 ) ergs/cm2
1-s peak spectrum fit
Power-law model
Time interval is from    0.144 sec. to    1.144 sec.

Spectral model in power-law:
------------------------------------------------------------
Parameters  : value       lower 90%   higher 90%
Photon index: -1.38699     ( -0.115986   0.115131 )
Norm@50keV  : 3.07570E-02    ( -0.00221539   0.00221109 )
------------------------------------------------------------
#Fit statistic  : Chi-Squared                   58.06     using 59 bins.
 Reduced chi-squared = 1.0186
# Null hypothesis probability of 4.36e-01 with 57 degrees of freedom

Photon flux (15-150 keV)    in 1 sec: 3.73478 ( -0.26884  0.269 ) ph/cm2/s
Energy fluence (15-150 keV)             : 2.9803e-07 ( -2.36895e-08  2.38396e-08 ) ergs/cm2
Cutoff power-law model
Time interval is from    0.144 sec. to    1.144 sec.
Spectral model in the cutoff power-law:
------------------------------------------------------------
Parameters  : value       lower 90%   higher 90%
Photon index: -0.638475     ( -0.477403   0.535187 )
Epeak [keV] : 94.6219      ( -20.5581 72.8445 )
Norm@50keV  : 7.19407E-02    ( -0.0295031   0.0577259 )
------------------------------------------------------------
#Fit statistic  : Chi-Squared                   50.46     using 59 bins.
 Reduced chi-squared = 0.901071
# Null hypothesis probability of 6.84e-01 with 56 degrees of freedom

Photon flux (15-150 keV)    in 1 sec: 3.65006 ( -0.27467  0.27458 ) ph/cm2/s
Energy fluence (15-150 keV)             : 2.86952e-07 ( -2.50433e-08  2.51309e-08 ) ergs/cm2
Time-resolved spectra
Distribution
T90 vs. Hardness ratio plot
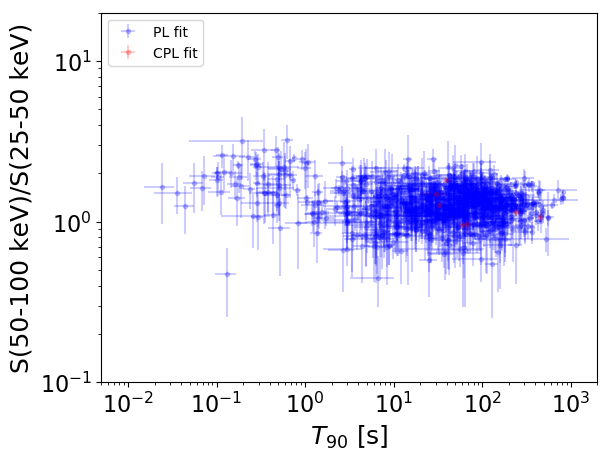
T90                                   = N/A sec.
Hardness ratio (energy fluence ratio) = N/A
S(15-50 keV) vs. S(50-150 keV) plot
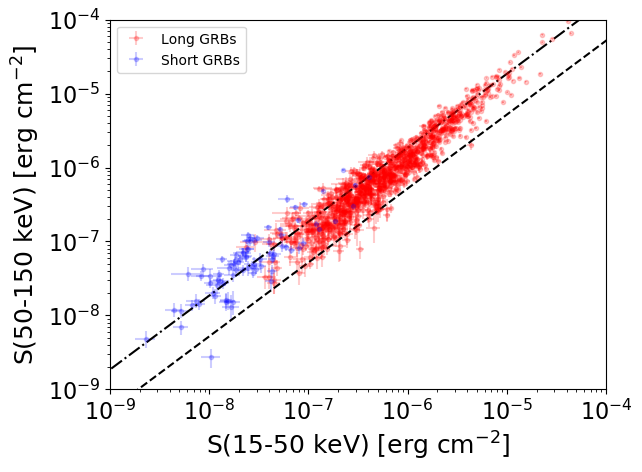
S(15-50 keV)  = N/A
S(50-150 keV) = N/A
The dash-dotted line and the dashed line traces the fluences calculated from the Band function with Epeak = 15 and 150 keV, respectively. Both lines assume a canonical values of alpha = -1 and beta = -2.5.
Mask shadow pattern
IMX = 3.550219012562849E-01, IMY = 3.592294551720819E-01
Spacecraft aspect plot
Bright source in the pre-burst/pre-slew/post-slew images
Pre-burst image of 15-350 keV band
Time interval of the image:
-239.000000 -19.176000

# RAcent  DECcent POSerr Theta    Phi  PeakCts   SNR AngSep     Name
#  [deg]    [deg]    ['] [deg]  [deg]                   [']
254.4502  35.2344    3.6  36.9  135.7   1.7203   3.2    6.5	Her X-1
256.5523  22.4676    3.0  47.8  145.9   4.2275   3.8 ------	UNKNOWN
106.7935  58.6393    2.8  51.0   -6.9   2.1534   4.2 ------	UNKNOWN
107.7589  50.4990    3.3  56.3  -14.7   3.3691   3.5 ------	UNKNOWN
Pre-slew background subtracted image of 15-350 keV band
Time interval of the image:
-19.176000 10.876000

# RAcent  DECcent POSerr Theta    Phi  PeakCts   SNR AngSep     Name
#  [deg]    [deg]    ['] [deg]  [deg]                   [']
254.3048  35.4572    3.9  36.6  135.6   0.4979   2.9   10.2	Her X-1
164.3123  50.4873    0.3  26.8  -45.3   4.5614  45.0 ------	UNKNOWN
162.7418  40.3953    1.9  33.2  -61.2   0.8298   5.9 ------	UNKNOWN
Post-slew image of 15-350 keV band
Time interval of the image:
172.100590 853.200600

# RAcent  DECcent POSerr Theta    Phi  PeakCts   SNR AngSep     Name
#  [deg]    [deg]    ['] [deg]  [deg]                   [']
244.9711 -15.6495    0.8  40.1  -52.5  21.3602  15.0    0.7	Sco X-1
255.7963 -37.8590  137.2  22.0  -85.2   0.0685   0.1    9.1	4U 1700-377
256.4561 -36.4257    8.3  21.7  -81.2   1.0910   1.4    1.0	GX 349+2
263.0142 -24.7482    5.6  21.2  -45.3   1.5068   2.1    0.3	GX 1+4
264.7448 -44.4409  169.3  16.2 -108.2  -0.0480  -0.1    0.6	4U 1735-44
268.2468  -1.4484   10.0  37.9   -9.1   1.0961   1.1    7.3	SW J1753.5-0127
270.3409 -25.0996    2.3  16.2  -31.7   3.1925   5.1    3.3	GX 5-1
270.3105 -25.6903    2.3  15.7  -33.2   3.4733   5.5    3.2	GRS 1758-258
274.0300 -14.0873    6.2  24.1   -6.8   1.3215   1.9    3.4	GX 17+2
275.7977 -30.2938    5.5   9.1  -31.3   1.4229   2.1    7.9	H1820-303
284.8310 -24.8200    0.0  11.9   22.0   0.3707   0.6   12.7	HT1900.1-2455
288.7129  10.8787  446.7  47.8   23.2  -0.0440  -0.0    6.4	GRS 1915+105
262.9524 -33.6927   19.8  17.1  -69.7   0.4328   0.6    8.7	GX 354-0
324.1951 -28.2280    4.1  35.0  104.4   4.3900   2.8 ------	UNKNOWN
 17.6941 -71.3262    3.0  56.8  173.9  15.9924   3.9 ------	UNKNOWN
260.3880  13.8096    3.8  55.0  -11.5   5.4792   3.0 ------	UNKNOWN
255.0836 -41.5595    2.2  22.5  -95.0   4.3416   5.4 ------	UNKNOWN