Analysis Summary
Notes:
- 1) No attempt has been made to eliminate the non-significant decimal places.
- 2) This batgrbproduct analysis is done using the HEASARC data.
- 3) This batgrbproduct analysis is using the flight position for the mask-weighting calculation.
======================================================================
                  BAT GRB EVENT DATA PROCESSING REPORT
    Process Script Ver: batgrbproduct v2.48
    Process Start Time: Wed Oct 19 23:49:26 EDT 2022
             Host Name: batproc1
   Current Working Dir: /local/data/bat1/alien/Swift_3rdBATcatalog/event/batevent_reproc/trigger994856
======================================================================

  Trigger: 00994856      Segment: 000

  BAT Trigger Time: 621090689.664   [s; MET]
      Trigger Stop: 621090691.712   [s; MET]
               UTC: 2020-09-06T13:11:04.076080    [includes UTCF correction]
       Where From?: TDRSS position message

  BAT
    RA: 272.292956564777   Dec: 67.852260484626  [deg; J2000]

     Catalogged Source?: NO
     Point Source?:      YES
     GRB Indicated?:     YES    [ by BAT flight software ]
     Image S/N Ratio:    8.66
     Image Trigger?:     NO
     Rate S/N Ratio:     12.328828005938  [ if not an image trigger ]
     Image S/N Ratio:    8.66

  Analysis Position:   [ source = BAT ]
    RA: 272.292956564777   Dec: 67.852260484626  [deg; J2000]

  Refined Position:   [ source = BAT pre-slew burst ]
    RA: 272.284096593714   Dec: 67.8870513201267  [deg; J2000]
        { 18h 09m 08.2s , +67d 53' 13.4" }
         +/- 1.43691288830335 [arcmin] (estimated 90% radius based on SNR)
         +/- 0.757150012782727 [arcmin] (formal 1-sigma fit error)
    SNR: 18.122485092025

  Angular difference between the analysis and refined position is 2.097034 arcmin

  Partial Coding Fraction: 0.9765625    [ including projection effects ]

  Duration
     T90: 70.8999999761581 +/- 7.63030603386452
        Measured from: -0.132000088691711
                   to: 70.7679998874664     [s; relative to TRIGTIME]
     T50: 34.1399998664856 +/- 8.42066502792278
        Measured from: 23.6280000209808
                   to: 57.7679998874664     [s; relative to TRIGTIME]


  Fluence
     Peak Flux  (peak 1 second)
        Measured from: 50.9639999866486
                   to: 51.9639999866486     [s; relative to TRIGTIME]
     Total Fluence
        Measured from: -8.7039999961853
                   to: 90.0119999647141     [s; relative to TRIGTIME]

             Band 1     Band 2     Band 3     Band 4
              15-25      25-50     50-100    100-350     keV
 Total     2.209940   2.141895   1.085001   0.185832
           0.066789   0.069626   0.062432   0.060859 [error]
 Peak      0.105233   0.120557   0.081580   0.011145
           0.007971   0.008775   0.007594   0.006367 [error]

     [ fluence units of on-axis counts / fully illuminated detector ]

======================================================================


====== Table of the duration information =============================

        Value   tstart    tstop
T100   98.716   -8.704   90.012
T90    70.900   -0.132   70.768
T50    34.140   23.628   57.768
Peak    1.000   50.964   51.964


====== Spectral Analysis Summary =====================================

Model      : spectral model: simple power-law (PL) and cutoff power-law (CPL)
Ph_index   : photon index: E^{Ph_index}
Ph_90err   : 90% error of the photon index
Epeak      : Epeak in keV
Epeak_90err: 90% error of Epeak
Norm       : normalization at 50 keV in both the PL model and CPL model
Nomr_90err : 90% error of the normalization
chi2       : Chi-Squared
dof        : degree of freedo

=== Time-averaged spectral analysis ===
(Best model with acceptable fit: N/A)

Model Ph_index Ph_90err_low Ph_90err_hi  Epeak  Epeak_90err_low  Epeak_90err_hi  Norm       Nomr_90err_low    Norm_90err_hi    chi2    dof
PL      -2.016    -0.091      0.089       -           -               -         3.07e-03     -1.57e-04          1.56e-04      64.450   57
CPL     -1.801    -0.340      0.372       40.993     -35.939       -40.993      4.02e-03     -1.38e-03          2.33e-03      63.320   56


=== 1-s peak spectral analysis ===
(Best model with acceptable fit: N/A)

Model Ph_index Ph_90err_low Ph_90err_hi  Epeak  Epeak_90err_low  Epeak_90err_hi  Norm       Nomr_90err_low    Norm_90err_hi    chi2    dof
PL      -1.774     -0.153     0.148       -           -               -         1.84e-02     -1.75e-03          1.72e-03      56.460   57
CPL     -1.471     -0.291     0.579       81.790     -29.910       -81.790      2.67e-02     -9.68e-03          2.67e-02      55.490   56


=== Fluence/Peak Flux Summary ===

              Model    Band1     Band2     Band3     Band4     Band5     Total
                       15-25     25-50    50-100    100-350    15-150    15-350    keV
Fluence         PL   6.30e-07  8.46e-07  8.37e-07  1.49e-06  2.80e-06  3.80e-06   erg/cm2
      90%_error_low -4.40e-08 -3.57e-08 -6.08e-08 -2.16e-07 -1.34e-07 -2.72e-07   erg/cm2
      90%_error_hi   4.51e-08  3.57e-08  6.14e-08  2.41e-07  1.35e-07  2.91e-07   erg/cm2
Peak flux       PL   9.84e-01  8.43e-01  4.93e-01  4.31e-01  2.51e+00  2.75e+00   ph/cm2/s
      90%_error_low -1.22e-01 -6.86e-02 -6.18e-02 -9.80e-02 -2.04e-01 -2.27e-01   ph/cm2/s
      90%_error_hi   1.26e-01  6.85e-02  6.18e-02  1.14e-01  2.04e-01  2.28e-01   ph/cm2/s

Fluence        CPL   6.11e-07  8.62e-07  8.31e-07  1.02e-06  2.73e-06  3.32e-06   erg/cm2
      90%_error_low -5.28e-08 -4.36e-08 -6.45e-08 -4.42e-07 -1.72e-07 -4.89e-07   erg/cm2
      90%_error_hi   2.72e-08  4.43e-08  6.37e-08  8.08e-07  1.73e-07  8.19e-07   erg/cm2
Peak flux      CPL   9.95e-01  7.06e-01  3.45e-01  3.35e-01  2.16e+00  2.29e+00   ph/cm2/s
      90%_error_low -1.49e-01 -1.05e-01 -2.04e-02 -5.34e-02 -3.20e-01 -3.32e-01   ph/cm2/s
      90%_error_hi   1.39e-01  1.56e-01  9.47e-02  3.99e-02  3.04e-01  3.58e-01   ph/cm2/s

======================================================================
Image
Pre-slew 15.0-350.0 keV image (Event data)
#   RAcent    DECcent   POSerr    Theta     Phi              Peak Cts       SNR   Name
  272.2841    67.8871   0.0106     8.4086   111.9310         1.6516508     18.122 TRIG_00994856

Foreground time interval of the image:
 -8.704  28.837 (delta_t =  37.541 [sec])
Background time interval of the image:
-239.664  -8.704 (delta_t = 230.960 [sec])
Light Curves
Note: The mask-weighted lightcurves have units of either count/det or counts/sec/det, where a det is 0.4 x 0.4 = 0.16 sq cm.
Full-time range; 1 s binning
Other quick-look light curves:
- 64 ms binning (zoomed)
- 16 ms binning (zoomed)
- 8 ms binning (zoomed)
- 2 ms binning (zoomed)
- SN=5 or 10 s binning (full-time range)
- Raw light curve
Spectra
- 64 ms binning (zoomed)
- 16 ms binning (zoomed)
- 8 ms binning (zoomed)
- 2 ms binning (zoomed)
- SN=5 or 10 s binning (full-time range)
- Raw light curve
Spectra
Notes:
- 1) The fitting includes the systematic errors.
- 2) When the burst includes telescope slew time periods, the fitting uses an average response file made from multiple 5-s response files through out the slew time plus single time preiod for the non-slew times, and weighted by the total counts in the corresponding time period using addrmf. An average response file is needed becuase a spectral fit using the pre-slew DRM will introduce some errors in both a spectral shape and a normalization if the PHA file contains a lot of the slew/post-slew time interval.
- 3) For fits to more complicated models (e.g. a power-law over a cutoff power-law), the BAT team has decided to require a chi-square improvement of more than 6 for each extra dof.
Time averaged spectrum fit using the average DRM
Power-law model
Time interval is from   -8.704 sec. to   90.012 sec.

Spectral model in power-law:
------------------------------------------------------------
Parameters  : value       lower 90%   higher 90%
Photon index: -2.01588     ( -0.0909078   0.0892416 )
Norm@50keV  : 3.06982E-03    ( -0.00015711   0.000155569 )
------------------------------------------------------------
#Fit statistic  : Chi-Squared                   64.45     using 59 bins.
 Reduced chi-squared = 1.1307
# Null hypothesis probability of 2.32e-01 with 57 degrees of freedom

Photon flux (15-150 keV)    in 98.72 sec: 0.463903 ( -0.02047  0.020524 ) ph/cm2/s
Energy fluence (15-150 keV)             : 2.79772e-06 ( -1.33964e-07  1.35161e-07 ) ergs/cm2
Cutoff power-law model
Time interval is from   -8.704 sec. to   90.012 sec.
Spectral model in the cutoff power-law:
------------------------------------------------------------
Parameters  : value       lower 90%   higher 90%
Photon index: -1.80067     ( -0.340125   0.372335 )
Epeak [keV] : 40.9927      ( -35.9387 -40.9927 )
Norm@50keV  : 4.01712E-03    ( -0.00138091   0.00233215 )
------------------------------------------------------------
#Fit statistic  : Chi-Squared                   63.32     using 59 bins.
 Reduced chi-squared = 1.13071
# Null hypothesis probability of 2.34e-01 with 56 degrees of freedom

Photon flux (15-150 keV)    in 98.72 sec: 0.456592 ( -0.023395  0.023426 ) ph/cm2/s
Energy fluence (15-150 keV)             : 2.72719e-06 ( -1.71871e-07  1.73459e-07 ) ergs/cm2
1-s peak spectrum fit
Power-law model
Time interval is from   50.964 sec. to   51.964 sec.

Spectral model in power-law:
------------------------------------------------------------
Parameters  : value       lower 90%   higher 90%
Photon index: -1.77392     ( -0.153426   0.148034 )
Norm@50keV  : 1.83741E-02    ( -0.00174945   0.00171936 )
------------------------------------------------------------
#Fit statistic  : Chi-Squared                   56.46     using 59 bins.
 Reduced chi-squared = 0.990526
# Null hypothesis probability of 4.95e-01 with 57 degrees of freedom

Photon flux (15-150 keV)    in 1 sec: 2.50689 ( -0.2039  0.20395 ) ph/cm2/s
Energy fluence (15-150 keV)             : 1.6936e-07 ( -1.64732e-08  1.67201e-08 ) ergs/cm2
Cutoff power-law model
Time interval is from   50.964 sec. to   51.964 sec.
Spectral model in the cutoff power-law:
------------------------------------------------------------
Parameters  : value       lower 90%   higher 90%
Photon index: -1.47093     ( -0.291179   0.578566 )
Epeak [keV] : 81.7905      ( -29.915 -81.7954 )
Norm@50keV  : 2.66761E-02    ( -0.00967686   0.0266895 )
------------------------------------------------------------
#Fit statistic  : Chi-Squared                   55.49     using 59 bins.
 Reduced chi-squared = 0.990893
# Null hypothesis probability of 4.94e-01 with 56 degrees of freedom

Photon flux (15-150 keV)    in 1 sec: 2.16463 ( -0.31997  0.30415 ) ph/cm2/s
Energy fluence (15-150 keV)             : 1.6523e-07 ( -1.7785e-08  1.80732e-08 ) ergs/cm2
Time-resolved spectra
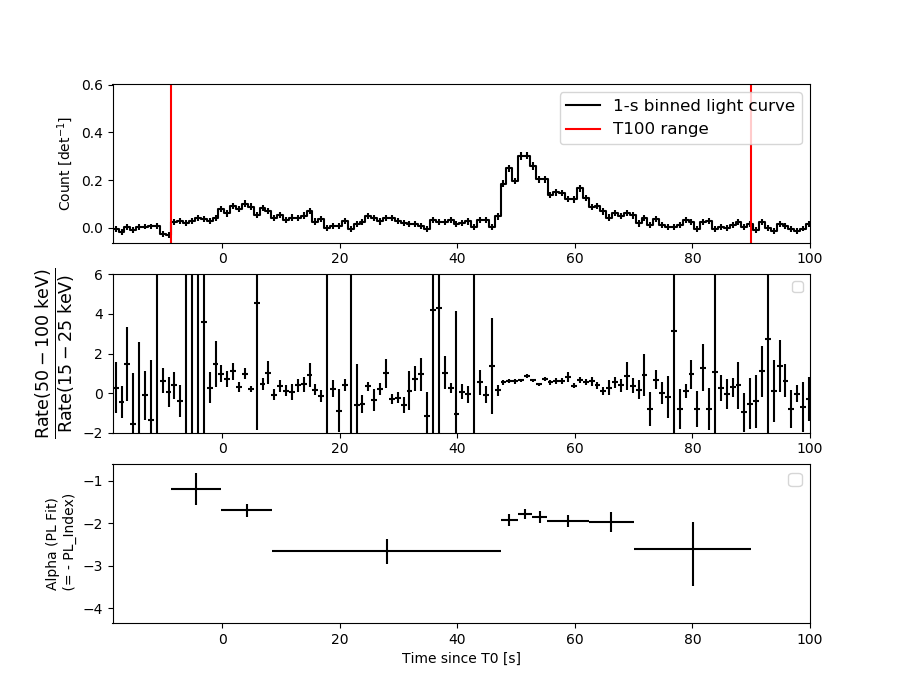
Distribution
T90 vs. Hardness ratio plot
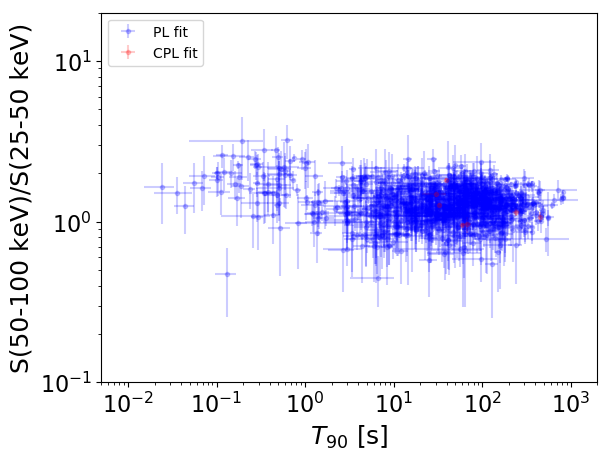
T90                                   = N/A sec.
Hardness ratio (energy fluence ratio) = N/A
S(15-50 keV) vs. S(50-150 keV) plot
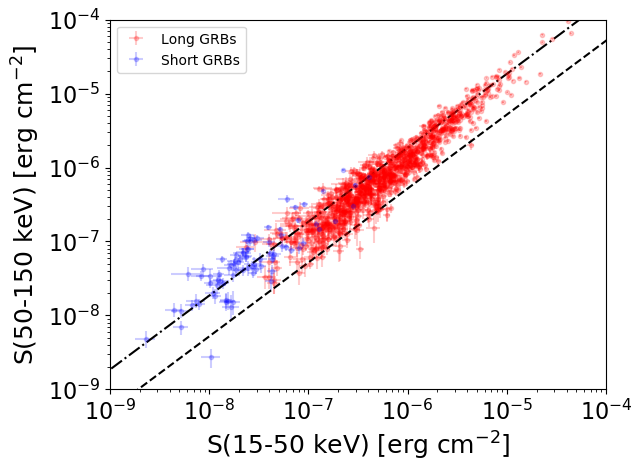
S(15-50 keV)  = N/A
S(50-150 keV) = N/A
The dash-dotted line and the dashed line traces the fluences calculated from the Band function with Epeak = 15 and 150 keV, respectively. Both lines assume a canonical values of alpha = -1 and beta = -2.5.
Mask shadow pattern
IMX = -5.520936979141938E-02, IMY = -1.371229878208657E-01
Spacecraft aspect plot
Bright source in the pre-burst/pre-slew/post-slew images
Pre-burst image of 15-350 keV band
Time interval of the image:
-239.664000 -8.704000

# RAcent  DECcent POSerr Theta    Phi  PeakCts   SNR AngSep     Name
#  [deg]    [deg]    ['] [deg]  [deg]                   [']
254.5943  35.1929   43.0  37.2  175.9  -0.1222  -0.3   11.2	Her X-1
180.9041  78.3669    2.4  17.5  -38.5   1.3093   4.7 ------	UNKNOWN
Pre-slew background subtracted image of 15-350 keV band
Time interval of the image:
-8.704000 28.836600

# RAcent  DECcent POSerr Theta    Phi  PeakCts   SNR AngSep     Name
#  [deg]    [deg]    ['] [deg]  [deg]                   [']
254.3063  35.2777    8.4  37.1  176.3   0.1704   1.4    8.4	Her X-1
343.6835  73.6398    2.5  24.5   43.5   0.4409   4.5 ------	UNKNOWN
272.2841  67.8872    0.6   8.4  111.9   1.6530  18.1 ------	UNKNOWN
212.1647  29.8510    2.9  47.2 -131.4   1.2942   4.0 ------	UNKNOWN
Post-slew image of 15-350 keV band
Time interval of the image:
56.036590 962.456000

# RAcent  DECcent POSerr Theta    Phi  PeakCts   SNR AngSep     Name
#  [deg]    [deg]    ['] [deg]  [deg]                   [']
254.6064  35.1829    0.0  34.2 -171.3  -0.9292  -1.0   12.0	Her X-1
299.6737  35.0693    4.2  36.3  123.0   5.2934   2.7    8.9	Cyg X-1
308.0082  40.9917    4.5  33.0  108.5   3.6159   2.6    5.2	Cyg X-3
  3.8037  48.5177    3.8  46.6   48.2   8.1696   3.0 ------	UNKNOWN
252.3376  11.2809    2.2  58.1 -174.3  20.5034   5.2 ------	UNKNOWN
248.8190  18.2527    2.3  51.8 -168.8  12.4492   5.0 ------	UNKNOWN
207.4460  44.6825    4.7  40.1 -108.9   6.5067   2.5 ------	UNKNOWN