Analysis Summary
Notes:
- 1) No attempt has been made to eliminate the non-significant decimal places.
- 2) This batgrbproduct analysis is done using the HEASARC data.
- 3) This batgrbproduct analysis is using the flight position for the mask-weighting calculation.
======================================================================
BAT GRB EVENT DATA PROCESSING REPORT
Process Script Ver: batgrbproduct v2.48
Process Start Time: Wed Oct 19 23:47:22 EDT 2022
Host Name: batproc1
Current Working Dir: /local/data/bat1/alien/Swift_3rdBATcatalog/event/batevent_reproc/trigger995004
======================================================================
Trigger: 00995004 Segment: 000
BAT Trigger Time: 621197496.768 [s; MET]
Trigger Stop: 621197497.024 [s; MET]
UTC: 2020-09-07T18:51:11.173040 [includes UTCF correction]
Where From?: TDRSS position message
BAT
RA: 89.0132987196125 Dec: 6.9106310534709 [deg; J2000]
Catalogged Source?: NO
Point Source?: YES
GRB Indicated?: YES [ by BAT flight software ]
Image S/N Ratio: 9.45
Image Trigger?: NO
Rate S/N Ratio: 23.4093998214393 [ if not an image trigger ]
Image S/N Ratio: 9.45
Analysis Position: [ source = BAT ]
RA: 89.0132987196125 Dec: 6.9106310534709 [deg; J2000]
Refined Position: [ source = BAT pre-slew burst ]
RA: 89.0186661880718 Dec: 6.90493001644181 [deg; J2000]
{ 05h 56m 04.5s , +06d 54' 17.7" }
+/- 1.83306134109208 [arcmin] (estimated 90% radius based on SNR)
+/- 0.859541821129795 [arcmin] (formal 1-sigma fit error)
SNR: 12.7982691588517
Angular difference between the analysis and refined position is 0.468211 arcmin
Partial Coding Fraction: 0.7890625 [ including projection effects ]
Duration
T90: 0.832000017166138 +/- 0.133880554639642
Measured from: -0.572000026702881
to: 0.259999990463257 [s; relative to TRIGTIME]
T50: 0.447999954223633 +/- 0.123693125978031
Measured from: -0.324000000953674
to: 0.123999953269958 [s; relative to TRIGTIME]
Fluence
Peak Flux (peak 1 second)
Measured from: -0.675999999046326
to: 0.324000000953674 [s; relative to TRIGTIME]
Total Fluence
Measured from: -0.639999985694885
to: 0.284000039100647 [s; relative to TRIGTIME]
Band 1 Band 2 Band 3 Band 4
15-25 25-50 50-100 100-350 keV
Total 0.035949 0.051848 0.073322 0.046492
0.007723 0.008401 0.008137 0.007118 [error]
Peak 0.034700 0.053882 0.076359 0.046571
0.007986 0.008730 0.008343 0.007366 [error]
[ fluence units of on-axis counts / fully illuminated detector ]
======================================================================
====== Table of the duration information =============================
Value tstart tstop
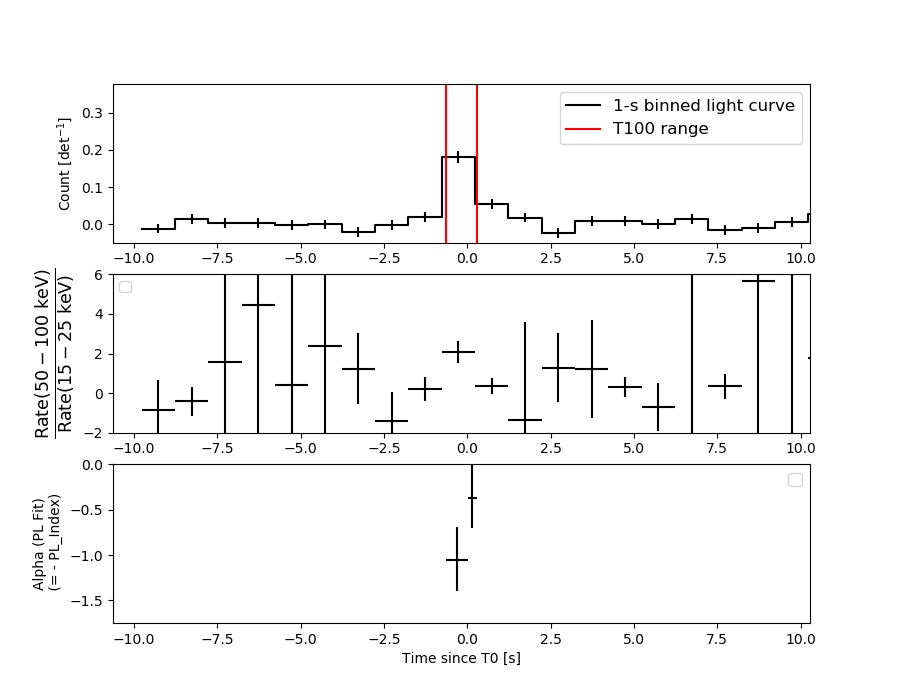
T100 0.924 -0.640 0.284
T90 0.832 -0.572 0.260
T50 0.448 -0.324 0.124
Peak 1.000 -0.676 0.324
====== Spectral Analysis Summary =====================================
Model : spectral model: simple power-law (PL) and cutoff power-law (CPL)
Ph_index : photon index: E^{Ph_index}
Ph_90err : 90% error of the photon index
Epeak : Epeak in keV
Epeak_90err: 90% error of Epeak
Norm : normalization at 50 keV in both the PL model and CPL model
Nomr_90err : 90% error of the normalization
chi2 : Chi-Squared
dof : degree of freedo
=== Time-averaged spectral analysis ===
(Best model with acceptable fit: N/A)
Model Ph_index Ph_90err_low Ph_90err_hi Epeak Epeak_90err_low Epeak_90err_hi Norm Nomr_90err_low Norm_90err_hi chi2 dof
PL -0.680 -0.244 0.264 - - - 1.38e-02 -2.00e-03 1.92e-03 40.310 57
CPL -0.680 -0.238 0.275 9999.360 -9999.360 -9999.360 1.39e-02 -1.86e-03 7.36e-03 40.350 56
=== 1-s peak spectral analysis ===
(Best model with acceptable fit: N/A)
Model Ph_index Ph_90err_low Ph_90err_hi Epeak Epeak_90err_low Epeak_90err_hi Norm Nomr_90err_low Norm_90err_hi chi2 dof
PL -0.637 -0.243 0.263 - - - 1.29e-02 -1.92e-03 1.85e-03 43.970 57
CPL -0.550 -0.334 0.662 999.046 -999.046 -999.046 1.41e-02 -2.83e-03 8.53e-03 44.240 56
=== Fluence/Peak Flux Summary ===
Model Band1 Band2 Band3 Band4 Band5 Total
15-25 25-50 50-100 100-350 15-150 15-350 keV
Fluence PL 7.60e-09 2.32e-08 5.79e-08 4.09e-07 1.57e-07 4.97e-07 erg/cm2
90%_error_low -2.31e-09 -4.45e-09 -7.37e-09 -1.18e-07 -2.05e-08 -1.20e-07 erg/cm2
90%_error_hi 2.62e-09 4.33e-09 7.31e-09 1.54e-07 2.06e-08 1.53e-07 erg/cm2
Peak flux PL 2.34e-01 3.96e-01 5.10e-01 1.32e+00 1.50e+00 2.46e+00 ph/cm2/s
90%_error_low -7.31e-02 -8.05e-02 -6.33e-02 -3.48e-01 -1.99e-01 -3.59e-01 ph/cm2/s
90%_error_hi 8.41e-02 7.94e-02 6.32e-02 4.37e-01 2.01e-01 3.99e-01 ph/cm2/s
Fluence CPL 7.58e-09 2.32e-08 5.80e-08 4.13e-07 1.57e-07 4.82e-07 erg/cm2
90%_error_low N/A -4.46e-09 N/A -2.02e-07 N/A -1.70e-07 erg/cm2
90%_error_hi N/A 4.33e-09 N/A 1.56e-07 N/A 1.62e-07 erg/cm2
Peak flux CPL 2.34e-01 3.99e-01 5.09e-01 1.42e+00 1.51e+00 2.52e+00 ph/cm2/s
90%_error_low N/A N/A N/A -6.77e-01 N/A -7.36e-01 ph/cm2/s
90%_error_hi N/A N/A N/A 4.40e-01 N/A 3.64e-01 ph/cm2/s
======================================================================
Image
Pre-slew 15.0-350.0 keV image (Event data)
#   RAcent    DECcent   POSerr    Theta     Phi              Peak Cts       SNR   Name
   89.0187     6.9049   0.0150    23.5826   149.2167         0.2066859     12.798 TRIG_00995004

Foreground time interval of the image:
 -0.640   0.284 (delta_t =   0.924 [sec])
Background time interval of the image:
-239.768  -0.640 (delta_t = 239.128 [sec])
Light Curves
Note: The mask-weighted lightcurves have units of either count/det or counts/sec/det, where a det is 0.4 x 0.4 = 0.16 sq cm.
Full-time range; 1 s binning
Other quick-look light curves:
- 64 ms binning (zoomed)
- 16 ms binning (zoomed)
- 8 ms binning (zoomed)
- 2 ms binning (zoomed)
- SN=5 or 10 s binning (full-time range)
- Raw light curve
Spectra
- 64 ms binning (zoomed)
- 16 ms binning (zoomed)
- 8 ms binning (zoomed)
- 2 ms binning (zoomed)
- SN=5 or 10 s binning (full-time range)
- Raw light curve
Spectra
Notes:
- 1) The fitting includes the systematic errors.
- 2) When the burst includes telescope slew time periods, the fitting uses an average response file made from multiple 5-s response files through out the slew time plus single time preiod for the non-slew times, and weighted by the total counts in the corresponding time period using addrmf. An average response file is needed becuase a spectral fit using the pre-slew DRM will introduce some errors in both a spectral shape and a normalization if the PHA file contains a lot of the slew/post-slew time interval.
- 3) For fits to more complicated models (e.g. a power-law over a cutoff power-law), the BAT team has decided to require a chi-square improvement of more than 6 for each extra dof.
Time averaged spectrum fit using the average DRM
Power-law model
Time interval is from   -0.640 sec. to    0.284 sec.

Spectral model in power-law:
------------------------------------------------------------
Parameters  : value       lower 90%   higher 90%
Photon index: -0.679718     ( -0.244503   0.263759 )
Norm@50keV  : 1.38031E-02    ( -0.00199794   0.001923 )
------------------------------------------------------------
#Fit statistic  : Chi-Squared                   40.31     using 59 bins.
 Reduced chi-squared = 0.707193
# Null hypothesis probability of 9.54e-01 with 57 degrees of freedom

Photon flux (15-150 keV)    in 0.924 sec: 1.59818 ( -0.21042  0.21135 ) ph/cm2/s
Energy fluence (15-150 keV)             : 1.57142e-07 ( -2.05415e-08  2.05722e-08 ) ergs/cm2
Cutoff power-law model
Time interval is from   -0.640 sec. to    0.284 sec.
Spectral model in the cutoff power-law:
------------------------------------------------------------
Parameters  : value       lower 90%   higher 90%
Photon index: -0.68011     ( -0.238497   0.274924 )
Epeak [keV] : 9999.36      ( -9999.36 -9999.36 )
Norm@50keV  : 1.39431E-02    ( -0.00185433   0.00736631 )
------------------------------------------------------------
#Fit statistic  : Chi-Squared                   40.35     using 59 bins.
 Reduced chi-squared = 0.720536
# Null hypothesis probability of 9.43e-01 with 56 degrees of freedom

Photon flux (15-150 keV)    in 0.924 sec: 1.59768 ( -0.21049  0.21121 ) ph/cm2/s
Energy fluence (15-150 keV)             : 1.57066e-07 ( 0  0 ) ergs/cm2
1-s peak spectrum fit
Power-law model
Time interval is from   -0.676 sec. to    0.324 sec.

Spectral model in power-law:
------------------------------------------------------------
Parameters  : value       lower 90%   higher 90%
Photon index: -0.636501     ( -0.243258   0.263498 )
Norm@50keV  : 1.29407E-02    ( -0.0019213   0.00184716 )
------------------------------------------------------------
#Fit statistic  : Chi-Squared                   43.97     using 59 bins.
 Reduced chi-squared = 0.771404
# Null hypothesis probability of 8.97e-01 with 57 degrees of freedom

Photon flux (15-150 keV)    in 1 sec: 1.50460 ( -0.19948  0.2006 ) ph/cm2/s
Energy fluence (15-150 keV)             : 1.6266e-07 ( -2.11165e-08  2.11546e-08 ) ergs/cm2
Cutoff power-law model
Time interval is from   -0.676 sec. to    0.324 sec.
Spectral model in the cutoff power-law:
------------------------------------------------------------
Parameters  : value       lower 90%   higher 90%
Photon index: -0.6273     ( -0.333849   0.66186 )
Epeak [keV] : 9999.35      ( -9999.36 -9999.36 )
Norm@50keV  : 1.30420E-02    ( -0.00177689   0.00958245 )
------------------------------------------------------------
#Fit statistic  : Chi-Squared                   43.99     using 59 bins.
 Reduced chi-squared = 0.785536
# Null hypothesis probability of 8.78e-01 with 56 degrees of freedom

Photon flux (15-150 keV)    in 1 sec: 1.51491 (    ) ph/cm2/s
Energy fluence (15-150 keV)             : 1.62619e-07 ( -2.11146e-08  2.11575e-08 ) ergs/cm2
Time-resolved spectra
Distribution
T90 vs. Hardness ratio plot
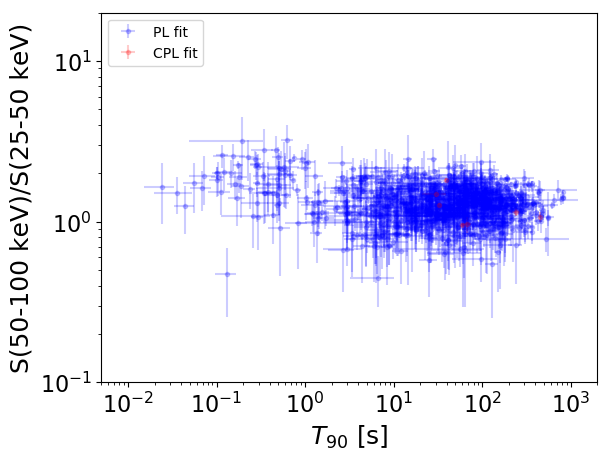
T90                                   = N/A sec.
Hardness ratio (energy fluence ratio) = N/A
S(15-50 keV) vs. S(50-150 keV) plot
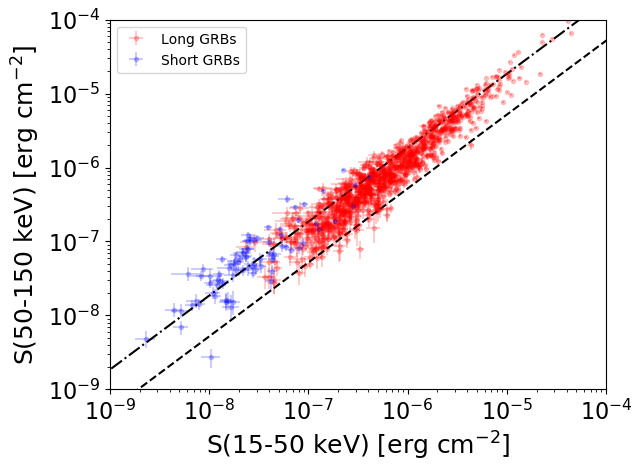
S(15-50 keV)  = N/A
S(50-150 keV) = N/A
The dash-dotted line and the dashed line traces the fluences calculated from the Band function with Epeak = 15 and 150 keV, respectively. Both lines assume a canonical values of alpha = -1 and beta = -2.5.
Mask shadow pattern
IMX = -3.750242461204163E-01, IMY = -2.234109063977873E-01
Spacecraft aspect plot
Bright source in the pre-burst/pre-slew/post-slew images
Pre-burst image of 15-350 keV band
Time interval of the image:
-239.768000 -0.640000

# RAcent  DECcent POSerr Theta    Phi  PeakCts   SNR AngSep     Name
#  [deg]    [deg]    ['] [deg]  [deg]                   [']
 83.6246  22.0214    0.5  38.1  162.5  10.0430  22.6    0.6	Crab
135.5163 -40.5616    0.9  40.9  -14.9   5.1852  13.1    0.7	Vela X-1
133.7143 -31.6969    3.3  34.0  -24.5   1.1604   3.5 ------	UNKNOWN
135.1554  -1.6035    3.0  29.0  -83.4   1.6617   3.8 ------	UNKNOWN
145.1719 -25.0569    2.4  40.0  -42.0   2.1697   4.9 ------	UNKNOWN
150.4771 -33.9376    2.4  47.4  -32.2   2.7769   4.7 ------	UNKNOWN
141.4932 -12.4832    3.0  34.2  -61.5   1.6880   3.9 ------	UNKNOWN
Pre-slew background subtracted image of 15-350 keV band
Time interval of the image:
-0.640000 0.284000

# RAcent  DECcent POSerr Theta    Phi  PeakCts   SNR AngSep     Name
#  [deg]    [deg]    ['] [deg]  [deg]                   [']
 83.4922  22.0262    6.3  38.2  162.3   0.0395   1.8    7.9	Crab
135.4960 -40.6077    5.4  40.9  -14.8   0.0427   2.2    3.5	Vela X-1
 89.0187   6.9049    0.9  23.6  149.2   0.2067  12.8 ------	UNKNOWN
122.4411 -58.5859    1.9  51.4    8.6   0.2353   6.1 ------	UNKNOWN
 88.3929  46.2912    2.4  57.3 -176.3   0.3889   4.8 ------	UNKNOWN
Post-slew image of 15-350 keV band
Time interval of the image:
63.732600 837.132600

# RAcent  DECcent POSerr Theta    Phi  PeakCts   SNR AngSep     Name
#  [deg]    [deg]    ['] [deg]  [deg]                   [']
 83.6281  22.0187    0.3  16.0  166.0  30.8433  44.0    0.4	Crab