Analysis Summary
Notes:
- 1) No attempt has been made to eliminate the non-significant decimal places.
- 2) This batgrbproduct analysis is done using the HEASARC data.
- 3) This batgrbproduct analysis is using the flight position for the mask-weighting calculation.
======================================================================
BAT GRB EVENT DATA PROCESSING REPORT
Process Script Ver: batgrbproduct v2.48
Process Start Time: Wed Oct 19 23:43:40 EDT 2022
Host Name: batproc1
Current Working Dir: /local/data/bat1/alien/Swift_3rdBATcatalog/event/batevent_reproc/trigger996184
======================================================================
Trigger: 00996184 Segment: 000
BAT Trigger Time: 622007573.952 [s; MET]
Trigger Stop: 622007578.048 [s; MET]
UTC: 2020-09-17T03:52:28.303740 [includes UTCF correction]
Where From?: TDRSS position message
BAT
RA: 235.753465520776 Dec: -4.69532441409532 [deg; J2000]
Catalogged Source?: NO
Point Source?: YES
GRB Indicated?: YES [ by BAT flight software ]
Image S/N Ratio: 9.11
Image Trigger?: NO
Rate S/N Ratio: 14 [ if not an image trigger ]
Image S/N Ratio: 9.11
Analysis Position: [ source = BAT ]
RA: 235.753465520776 Dec: -4.69532441409532 [deg; J2000]
Refined Position: [ source = BAT pre-slew burst ]
RA: 235.73582557468 Dec: -4.69085680206094 [deg; J2000]
{ 15h 42m 56.6s , -04d 41' 27.1" }
+/- 2.00266313250486 [arcmin] (estimated 90% radius based on SNR)
+/- 0.876865199195135 [arcmin] (formal 1-sigma fit error)
SNR: 11.2784637318641
Angular difference between the analysis and refined position is 1.088375 arcmin
Partial Coding Fraction: 0.9609375 [ including projection effects ]
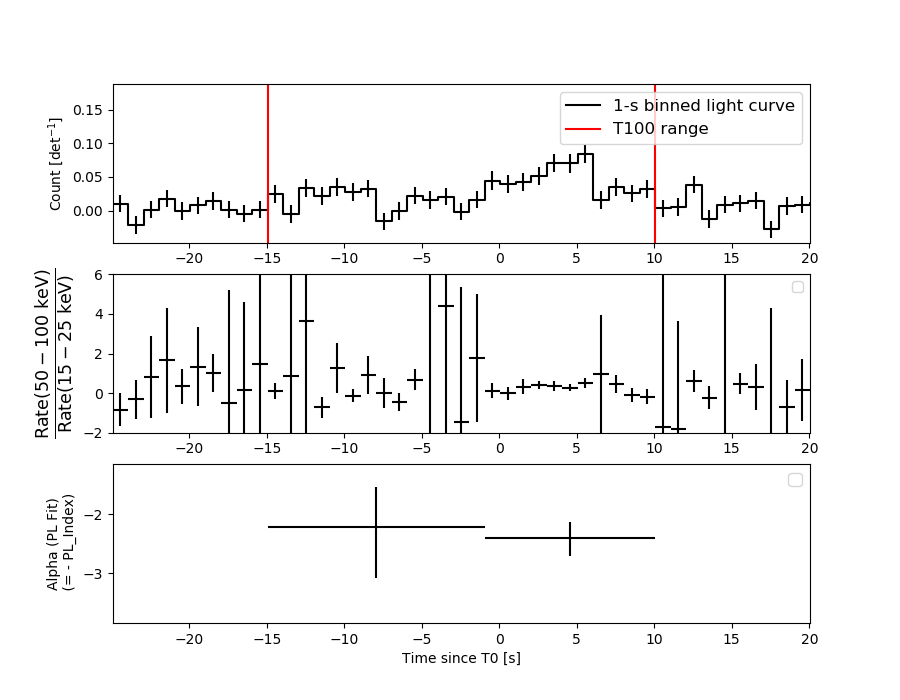
Duration
T90: 21 +/- 4.24264068711928
Measured from: -12.9520000219345
to: 8.04799997806549 [s; relative to TRIGTIME]
T50: 10 +/- 5
Measured from: -4.95200002193451
to: 5.04799997806549 [s; relative to TRIGTIME]
Fluence
Peak Flux (peak 1 second)
Measured from: 5.04799997806549
to: 6.04799997806549 [s; relative to TRIGTIME]
Total Fluence
Measured from: -14.9520000219345
to: 10.0479999780655 [s; relative to TRIGTIME]
Band 1 Band 2 Band 3 Band 4
15-25 25-50 50-100 100-350 keV
Total 0.325534 0.281063 0.109397 0.022409
0.037835 0.034429 0.030336 0.028872 [error]
Peak 0.028375 0.028009 0.013962 0.013688
0.007792 0.007226 0.005975 0.005832 [error]
[ fluence units of on-axis counts / fully illuminated detector ]
======================================================================
====== Table of the duration information =============================
Value tstart tstop
T100 25.000 -14.952 10.048
T90 21.000 -12.952 8.048
T50 10.000 -4.952 5.048
Peak 1.000 5.048 6.048
====== Spectral Analysis Summary =====================================
Model : spectral model: simple power-law (PL) and cutoff power-law (CPL)
Ph_index : photon index: E^{Ph_index}
Ph_90err : 90% error of the photon index
Epeak : Epeak in keV
Epeak_90err: 90% error of Epeak
Norm : normalization at 50 keV in both the PL model and CPL model
Nomr_90err : 90% error of the normalization
chi2 : Chi-Squared
dof : degree of freedo
=== Time-averaged spectral analysis ===
(Best model with acceptable fit: N/A)
Model Ph_index Ph_90err_low Ph_90err_hi Epeak Epeak_90err_low Epeak_90err_hi Norm Nomr_90err_low Norm_90err_hi chi2 dof
PL -2.340 -0.319 0.290 - - - 1.35e-03 -3.01e-04 2.98e-04 36.520 57
CPL -1.661 -0.341 1.988 17.456 -17.072 21.926 3.68e-03 -3.68e-03 7.50e-02 35.780 56
=== 1-s peak spectral analysis ===
(Best model with acceptable fit: N/A)
Model Ph_index Ph_90err_low Ph_90err_hi Epeak Epeak_90err_low Epeak_90err_hi Norm Nomr_90err_low Norm_90err_hi chi2 dof
PL -1.849 -0.561 0.536 - - - 4.08e-03 -1.44e-03 1.38e-03 67.130 57
CPL -1.720 N/A N/A 67.727 N/A N/A 4.98e-03 N/A N/A 67.170 56
=== Fluence/Peak Flux Summary ===
Model Band1 Band2 Band3 Band4 Band5 Total
15-25 25-50 50-100 100-350 15-150 15-350 keV
Fluence PL 9.55e-08 1.06e-07 8.35e-08 1.09e-07 3.25e-07 3.94e-07 erg/cm2
90%_error_low -1.69e-08 -1.64e-08 -2.44e-08 -5.09e-08 -5.66e-08 -8.75e-08 erg/cm2
90%_error_hi 1.72e-08 1.60e-08 2.67e-08 7.68e-08 5.95e-08 1.08e-07 erg/cm2
Peak flux PL 2.35e-01 1.93e-01 1.07e-01 8.74e-02 5.73e-01 6.22e-01 ph/cm2/s
90%_error_low -9.67e-02 -5.52e-02 -4.67e-02 -5.62e-02 -1.65e-01 -1.81e-01 ph/cm2/s
90%_error_hi 1.02e-01 5.52e-02 4.97e-02 1.05e-01 1.65e-01 1.83e-01 ph/cm2/s
Fluence CPL 9.33e-08 1.13e-07 7.23e-08 2.73e-08 2.98e-07 3.06e-07 erg/cm2
90%_error_low -1.81e-08 -1.89e-08 -3.87e-08 N/A -6.41e-08 -7.24e-08 erg/cm2
90%_error_hi 1.73e-08 2.24e-08 3.38e-08 N/A 7.27e-08 9.04e-08 erg/cm2
Peak flux CPL 2.35e-01 1.92e-01 1.07e-01 8.78e-02 5.73e-01 6.24e-01 ph/cm2/s
90%_error_low -9.65e-02 -4.06e-02 -4.68e-02 -8.78e-02 -2.34e-01 -2.85e-01 ph/cm2/s
90%_error_hi 1.02e-01 1.43e-01 4.87e-02 7.21e-02 1.25e-01 1.26e-01 ph/cm2/s
======================================================================
Image
Pre-slew 15.0-350.0 keV image (Event data)
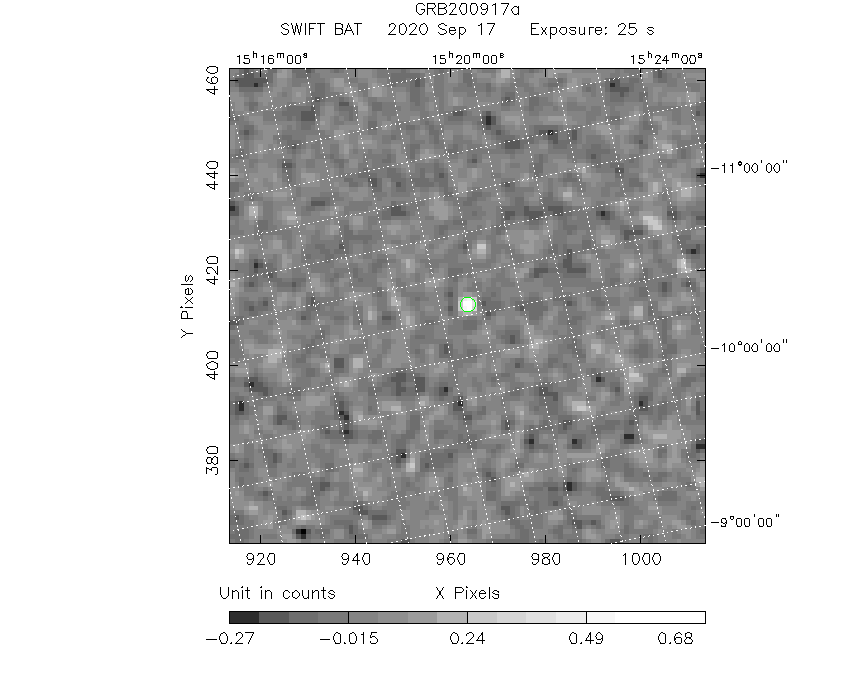
#   RAcent    DECcent   POSerr    Theta     Phi              Peak Cts       SNR   Name
  235.7358    -4.6909   0.0171    12.4925   142.7631         0.8429618     11.278 TRIG_00996184

Foreground time interval of the image:
-14.952  10.048 (delta_t =  25.000 [sec])
Background time interval of the image:
-76.851 -14.952 (delta_t =  61.899 [sec])
Light Curves
Note: The mask-weighted lightcurves have units of either count/det or counts/sec/det, where a det is 0.4 x 0.4 = 0.16 sq cm.
Full-time range; 1 s binning
Other quick-look light curves:
- 64 ms binning (zoomed)
- 16 ms binning (zoomed)
- 8 ms binning (zoomed)
- 2 ms binning (zoomed)
- SN=5 or 10 s binning (full-time range)
- Raw light curve
Spectra
- 64 ms binning (zoomed)
- 16 ms binning (zoomed)
- 8 ms binning (zoomed)
- 2 ms binning (zoomed)
- SN=5 or 10 s binning (full-time range)
- Raw light curve
Spectra
Notes:
- 1) The fitting includes the systematic errors.
- 2) When the burst includes telescope slew time periods, the fitting uses an average response file made from multiple 5-s response files through out the slew time plus single time preiod for the non-slew times, and weighted by the total counts in the corresponding time period using addrmf. An average response file is needed becuase a spectral fit using the pre-slew DRM will introduce some errors in both a spectral shape and a normalization if the PHA file contains a lot of the slew/post-slew time interval.
- 3) For fits to more complicated models (e.g. a power-law over a cutoff power-law), the BAT team has decided to require a chi-square improvement of more than 6 for each extra dof.
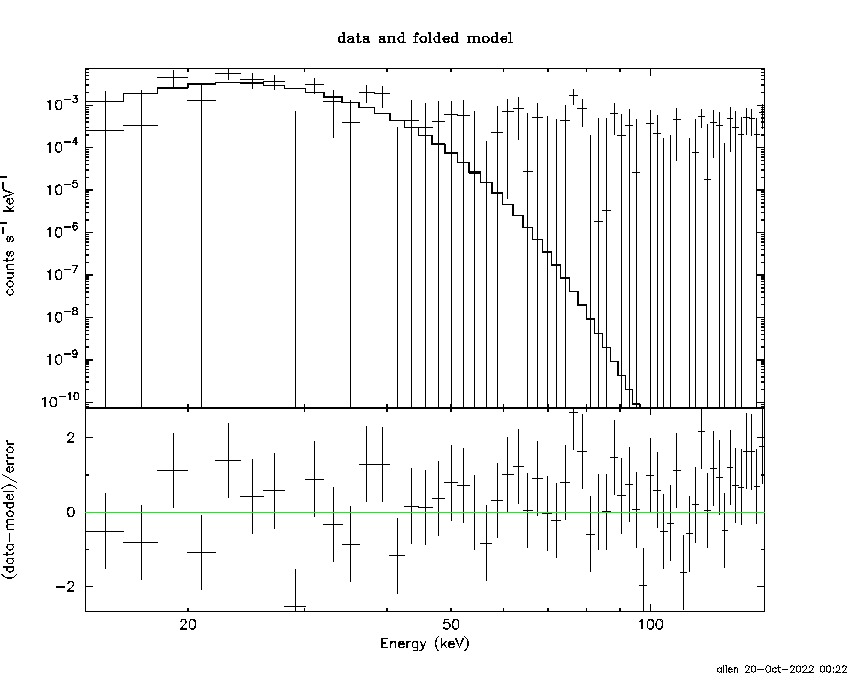
Time averaged spectrum fit using the average DRM
Power-law model
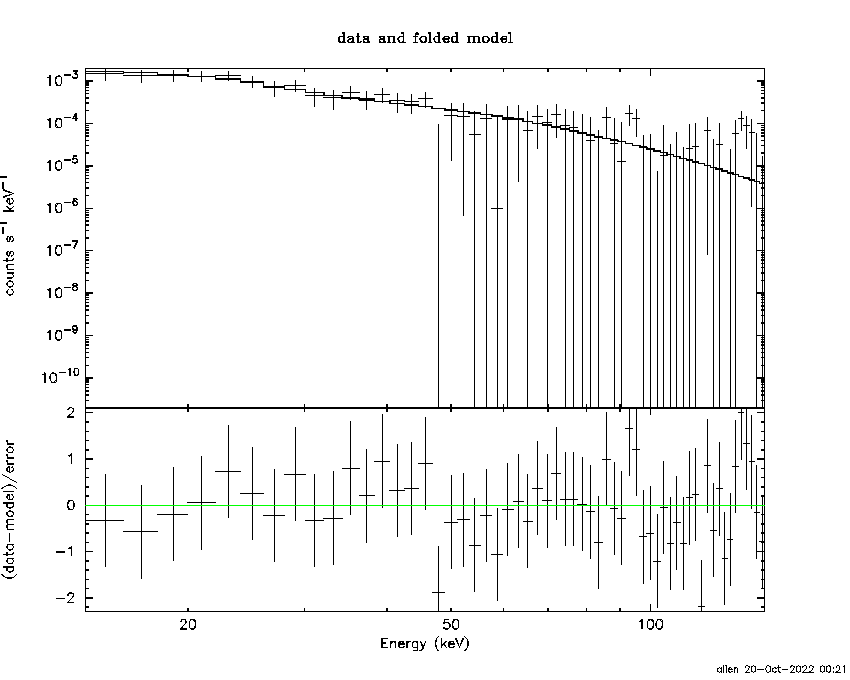
Time interval is from  -14.952 sec. to   10.048 sec.

Spectral model in power-law:
------------------------------------------------------------
Parameters  : value       lower 90%   higher 90%
Photon index: -2.34029     ( -0.319281   0.28963 )
Norm@50keV  : 1.35040E-03    ( -0.000301326   0.00029765 )
------------------------------------------------------------
#Fit statistic  : Chi-Squared                   36.52     using 59 bins.
 Reduced chi-squared = 0.640702
# Null hypothesis probability of 9.84e-01 with 57 degrees of freedom

Photon flux (15-150 keV)    in 25 sec: 0.241428 ( -0.033316  0.033318 ) ph/cm2/s
Energy fluence (15-150 keV)             : 3.252e-07 ( -5.66037e-08  5.95422e-08 ) ergs/cm2
Cutoff power-law model
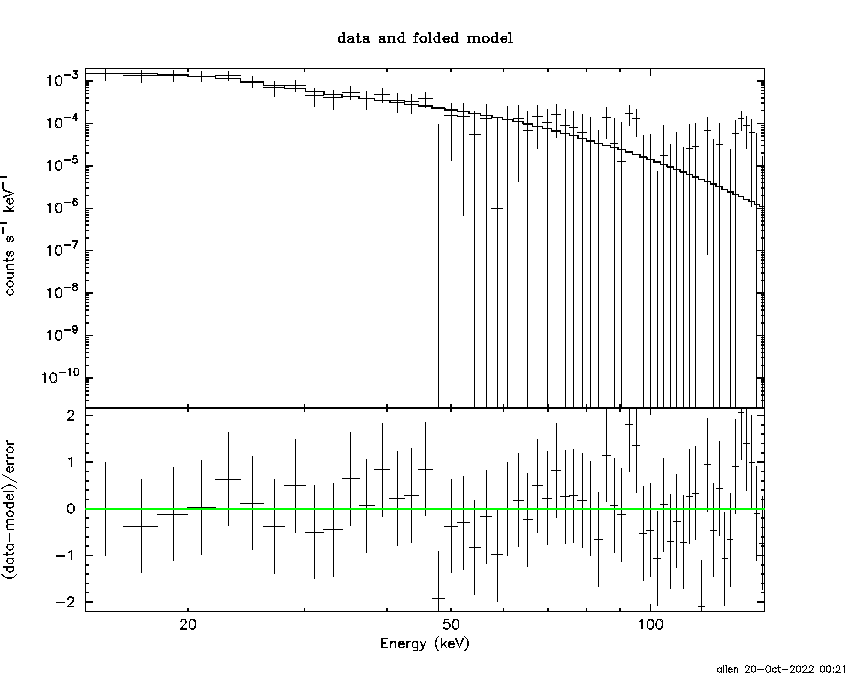
Time interval is from  -14.952 sec. to   10.048 sec.
Spectral model in the cutoff power-law:
------------------------------------------------------------
Parameters  : value       lower 90%   higher 90%
Photon index: -1.66055     ( -0.340553   1.98932 )
Epeak [keV] : 17.4564      ( -17.0478 21.9505 )
Norm@50keV  : 3.68445E-03    ( -0.00367896   0.0749882 )
------------------------------------------------------------
#Fit statistic  : Chi-Squared                   35.78     using 59 bins.
 Reduced chi-squared = 0.638929
# Null hypothesis probability of 9.84e-01 with 56 degrees of freedom

Photon flux (15-150 keV)    in 25 sec: 0.235410 ( -0.034801  0.034426 ) ph/cm2/s
Energy fluence (15-150 keV)             : 2.97695e-07 ( -6.4075e-08  7.27383e-08 ) ergs/cm2
1-s peak spectrum fit
Power-law model
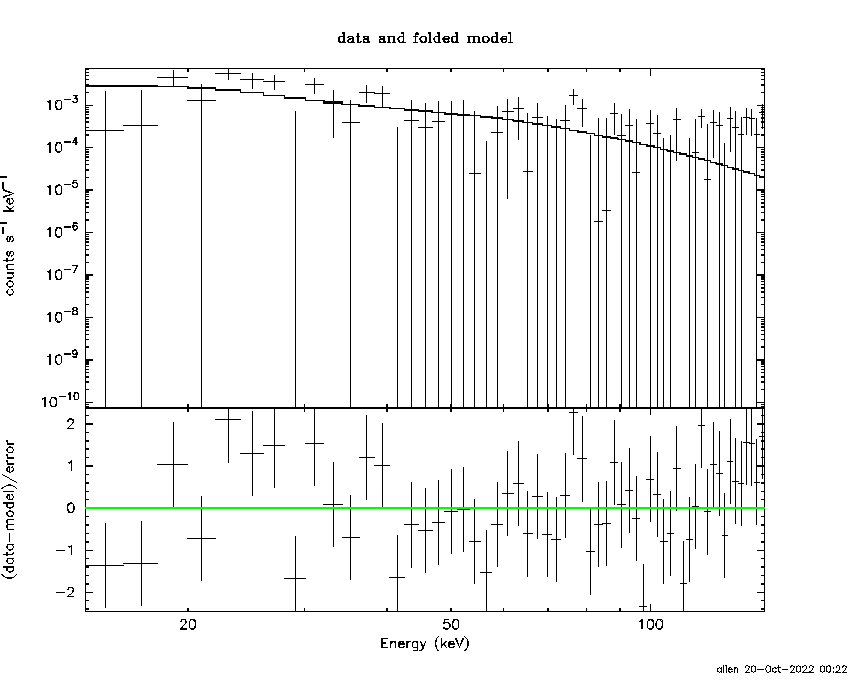
Time interval is from    5.048 sec. to    6.048 sec.

Spectral model in power-law:
------------------------------------------------------------
Parameters  : value       lower 90%   higher 90%
Photon index: -1.84888     ( -0.560654   0.535578 )
Norm@50keV  : 4.08014E-03    ( -0.00143951   0.00138061 )
------------------------------------------------------------
#Fit statistic  : Chi-Squared                   67.13     using 59 bins.
 Reduced chi-squared = 1.17772
# Null hypothesis probability of 1.69e-01 with 57 degrees of freedom

Photon flux (15-150 keV)    in 1 sec: 0.573277 ( -0.164661  0.164742 ) ph/cm2/s
Energy fluence (15-150 keV)             : 3.75232e-08 ( -1.26025e-08  1.35073e-08 ) ergs/cm2
Cutoff power-law model
Time interval is from    5.048 sec. to    6.048 sec.
Spectral model in the cutoff power-law:
------------------------------------------------------------
Parameters  : value       lower 90%   higher 90%
Photon index: 9.88469     (       )
Epeak [keV] : 27.6637      (   )
Norm@50keV  : 1.15251E+06    (     )
------------------------------------------------------------
#Fit statistic  : Chi-Squared                   66.13     using 59 bins.
 Reduced chi-squared = 1.18089
# Null hypothesis probability of 1.67e-01 with 56 degrees of freedom

Photon flux (15-150 keV)    in 1 sec: 0.572980 ( -0.23363  0.125046 ) ph/cm2/s
Energy fluence (15-150 keV)             : 2.08128e-08 ( -6.50608e-09  2.29636e-08 ) ergs/cm2
Time-resolved spectra
Distribution
T90 vs. Hardness ratio plot
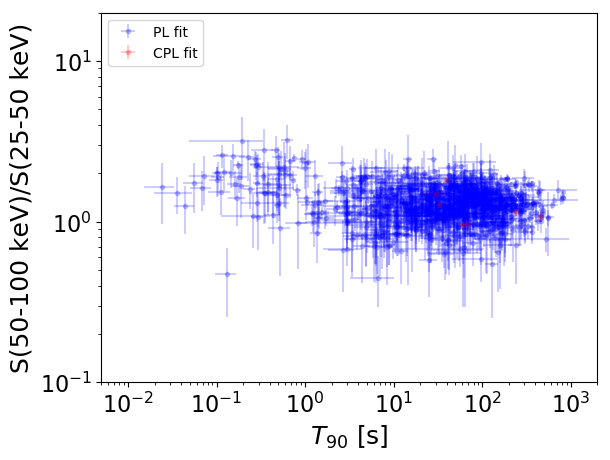
T90                                   = N/A sec.
Hardness ratio (energy fluence ratio) = N/A
S(15-50 keV) vs. S(50-150 keV) plot
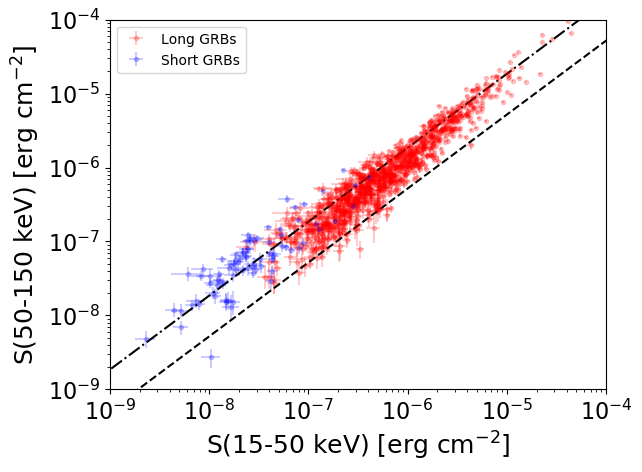
S(15-50 keV)  = N/A
S(50-150 keV) = N/A
The dash-dotted line and the dashed line traces the fluences calculated from the Band function with Epeak = 15 and 150 keV, respectively. Both lines assume a canonical values of alpha = -1 and beta = -2.5.
Mask shadow pattern
IMX = -1.763911785378280E-01, IMY = -1.340674952411572E-01
Spacecraft aspect plot
Bright source in the pre-burst/pre-slew/post-slew images
Pre-burst image of 15-350 keV band
Time interval of the image:
-76.851410 -14.952000

# RAcent  DECcent POSerr Theta    Phi  PeakCts   SNR AngSep     Name
#  [deg]    [deg]    ['] [deg]  [deg]                   [']
244.9918 -15.6330    0.4  26.6  148.3   4.7004  31.2    0.8	Sco X-1
254.3858  35.2366    6.1  41.0   47.8   0.5848   1.9    7.3	Her X-1
256.1341 -37.8892    6.2  49.8  161.0  -0.8724  -1.9    7.5	4U 1700-377
256.3502 -36.3886    6.0  48.8  159.5   0.8511   1.9    4.6	GX 349+2
263.0224 -24.6925    8.1  45.5  142.2   0.6253   1.4    3.3	GX 1+4
262.8367 -33.7486    0.0  50.7  152.2   2.5414   4.8    9.2	GX 354-0
266.5266  -1.8856    3.5  40.6  108.9   1.6818   3.3 ------	UNKNOWN
227.3369  40.7716    2.2  37.3   13.2   0.9109   5.2 ------	UNKNOWN
202.8535  37.4857    2.9  40.2  -17.3   0.7142   4.0 ------	UNKNOWN
Pre-slew background subtracted image of 15-350 keV band
Time interval of the image:
-14.952000 10.048000

# RAcent  DECcent POSerr Theta    Phi  PeakCts   SNR AngSep     Name
#  [deg]    [deg]    ['] [deg]  [deg]                   [']
244.8276 -15.5318    8.2  26.4  148.4   0.1335   1.4   10.9	Sco X-1
254.6221  35.3562    5.1  41.3   47.9   0.4325   2.3    8.1	Her X-1
256.1282 -37.8684   29.5  49.8  160.9   0.1078   0.4    6.9	4U 1700-377
256.3523 -36.2948    5.8  48.7  159.4  -0.5169  -2.0    8.7	GX 349+2
263.1381 -24.6947    4.9  45.6  142.2  -0.6376  -2.4    7.7	GX 1+4
262.8915 -33.8482    4.7  50.8  152.2   0.9179   2.5    4.9	GX 354-0
235.7358  -4.6909    1.0  12.5  142.8   0.8430  11.3 ------	UNKNOWN
188.9075  23.5250    2.5  41.3  -45.6   0.6671   4.6 ------	UNKNOWN
Post-slew image of 15-350 keV band
Time interval of the image:
83.948600 962.147400

# RAcent  DECcent POSerr Theta    Phi  PeakCts   SNR AngSep     Name
#  [deg]    [deg]    ['] [deg]  [deg]                   [']
244.9918 -15.6406    0.2  14.2  136.2  71.5038  63.9    0.7	Sco X-1
254.4559  35.3443   83.6  43.7   17.4   0.2720   0.1    0.1	Her X-1
255.9755 -37.9650   18.0  38.0  149.0   1.4666   0.6    7.3	4U 1700-377
256.5004 -36.4173    6.8  37.0  146.9   3.5596   1.7    3.2	GX 349+2
262.8481 -24.8399    6.8  32.9  125.7   3.7056   1.7   10.4	GX 1+4
264.5676 -44.6099    7.1  47.2  147.3  -7.7379  -1.6   12.2	4U 1735-44
268.2172  -1.4992    4.0  32.6   80.6   6.1159   2.9    9.5	SW J1753.5-0127
270.1717 -25.0710    9.6  38.8  120.4   4.4841   1.2    6.1	GX 5-1
270.2399 -25.7854    3.7  39.2  121.4  11.6959   3.1    4.2	GRS 1758-258
273.8530 -14.0077   90.9  38.7  101.8  -0.4412  -0.1    9.1	GX 17+2
262.8692 -33.7834    7.3  38.5  137.7   4.3904   1.6    6.7	GX 354-0
242.9397 -49.8830    2.3  45.6  168.7  13.5071   5.0 ------	UNKNOWN
246.0286  51.2740    3.6  56.6    2.9  16.1833   3.2 ------	UNKNOWN
219.4372   6.4017    3.5  19.7  -60.7   4.2208   3.3 ------	UNKNOWN