Analysis Summary
Notes:
- 1) No attempt has been made to eliminate the non-significant decimal places.
- 2) This batgrbproduct analysis is done using the HEASARC data.
- 3) This batgrbproduct analysis is using the flight position for the mask-weighting calculation.
======================================================================
BAT GRB EVENT DATA PROCESSING REPORT
Process Script Ver: batgrbproduct v2.48
Process Start Time: Wed Oct 19 23:42:05 EDT 2022
Host Name: batproc1
Current Working Dir: /local/data/bat1/alien/Swift_3rdBATcatalog/event/batevent_reproc/trigger996503
======================================================================
Trigger: 00996503 Segment: 000
BAT Trigger Time: 622173166.592 [s; MET]
Trigger Stop: 622173170.688 [s; MET]
UTC: 2020-09-19T01:52:20.932860 [includes UTCF correction]
Where From?: TDRSS position message
BAT
RA: 168.915726722106 Dec: 32.4569651703903 [deg; J2000]
Catalogged Source?: NO
Point Source?: YES
GRB Indicated?: YES [ by BAT flight software ]
Image S/N Ratio: 9.51
Image Trigger?: NO
Rate S/N Ratio: 14.456832294801 [ if not an image trigger ]
Image S/N Ratio: 9.51
Analysis Position: [ source = BAT ]
RA: 168.915726722106 Dec: 32.4569651703903 [deg; J2000]
Refined Position: [ source = BAT pre-slew burst ]
RA: 168.898720778248 Dec: 32.4534957566324 [deg; J2000]
{ 11h 15m 35.7s , +32d 27' 12.6" }
+/- 1.47766268218705 [arcmin] (estimated 90% radius based on SNR)
+/- 0.576664110169208 [arcmin] (formal 1-sigma fit error)
SNR: 17.4127732051079
Angular difference between the analysis and refined position is 0.885795 arcmin
Partial Coding Fraction: 0.625 [ including projection effects ]
Duration
T90: 108.432000041008 +/- 21.5348603229185
Measured from: -56.8079999685287
to: 51.6240000724792 [s; relative to TRIGTIME]
T50: 27.8400000333786 +/- 9.0282258569339
Measured from: -17.5440000295639
to: 10.2960000038147 [s; relative to TRIGTIME]
Fluence
Peak Flux (peak 1 second)
Measured from: 1.03600001335144
to: 2.03600001335144 [s; relative to TRIGTIME]
Total Fluence
Measured from: -61.4639999866486
to: 70.5039999485016 [s; relative to TRIGTIME]
Band 1 Band 2 Band 3 Band 4
15-25 25-50 50-100 100-350 keV
Total 1.580862 1.527997 0.565105 0.342199
0.095365 0.097758 0.086811 0.082105 [error]
Peak 0.056943 0.060210 0.031821 0.003747
0.008891 0.009433 0.008329 0.007047 [error]
[ fluence units of on-axis counts / fully illuminated detector ]
======================================================================
====== Table of the duration information =============================
Value tstart tstop
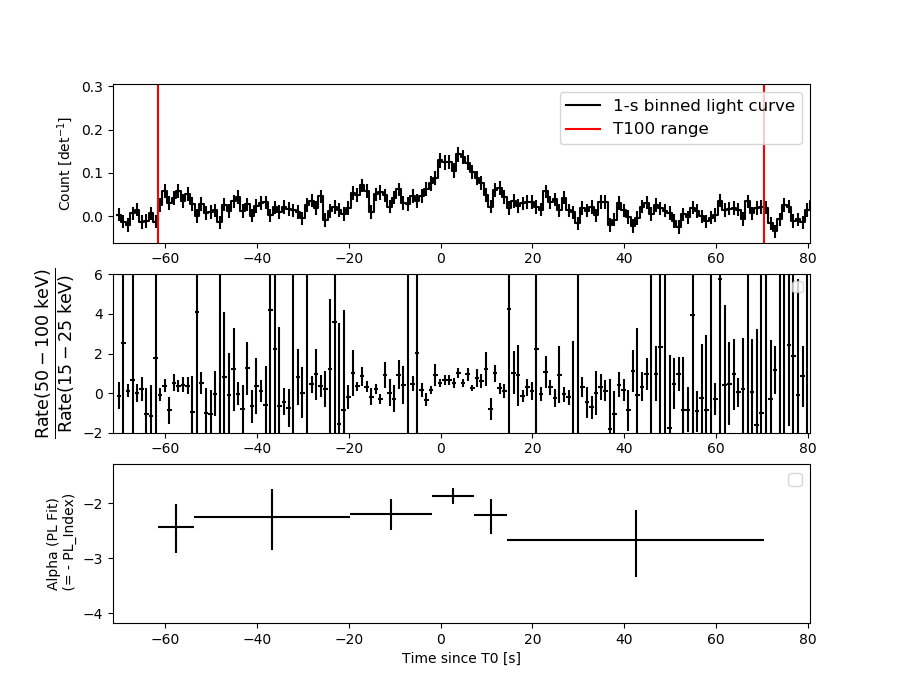
T100 131.968 -61.464 70.504
T90 108.432 -56.808 51.624
T50 27.840 -17.544 10.296
Peak 1.000 1.036 2.036
====== Spectral Analysis Summary =====================================
Model : spectral model: simple power-law (PL) and cutoff power-law (CPL)
Ph_index : photon index: E^{Ph_index}
Ph_90err : 90% error of the photon index
Epeak : Epeak in keV
Epeak_90err: 90% error of Epeak
Norm : normalization at 50 keV in both the PL model and CPL model
Nomr_90err : 90% error of the normalization
chi2 : Chi-Squared
dof : degree of freedo
=== Time-averaged spectral analysis ===
(Best model with acceptable fit: N/A)
Model Ph_index Ph_90err_low Ph_90err_hi Epeak Epeak_90err_low Epeak_90err_hi Norm Nomr_90err_low Norm_90err_hi chi2 dof
PL -2.247 -0.170 0.162 - - - 1.50e-03 -1.73e-04 1.70e-04 58.760 57
CPL -2.237 -0.299 0.152 9999.360 N/A N/A 1.51e-03 N/A N/A 58.780 56
=== 1-s peak spectral analysis ===
(Best model with acceptable fit: N/A)
Model Ph_index Ph_90err_low Ph_90err_hi Epeak Epeak_90err_low Epeak_90err_hi Norm Nomr_90err_low Norm_90err_hi chi2 dof
PL -1.825 -0.302 0.279 - - - 9.05e-03 -1.90e-03 1.86e-03 58.540 57
CPL -0.353 -1.226 1.683 47.032 -11.653 33.750 6.41e-02 -6.41e-02 5.80e-01 54.110 56
=== Fluence/Peak Flux Summary ===
Model Band1 Band2 Band3 Band4 Band5 Total
15-25 25-50 50-100 100-350 15-150 15-350 keV
Fluence PL 5.12e-07 5.99e-07 5.04e-07 7.19e-07 1.87e-06 2.33e-06 erg/cm2
90%_error_low -5.46e-08 -4.91e-08 -7.90e-08 -1.97e-07 -1.79e-07 -3.01e-07 erg/cm2
90%_error_hi 5.55e-08 4.89e-08 8.20e-08 2.46e-07 1.83e-07 3.37e-07 erg/cm2
Peak flux PL 5.09e-01 4.23e-01 2.39e-01 2.00e-01 1.26e+00 1.37e+00 ph/cm2/s
90%_error_low -1.19e-01 -7.37e-02 -6.29e-02 -8.42e-02 -2.19e-01 -2.45e-01 ph/cm2/s
90%_error_hi 1.24e-01 7.37e-02 6.43e-02 1.14e-01 2.19e-01 2.47e-01 ph/cm2/s
Fluence CPL 5.00e-07 5.79e-07 5.00e-07 3.72e-07 1.81e-06 1.97e-06 erg/cm2
90%_error_low -4.58e-08 -1.17e-08 -3.64e-08 -2.73e-07 -1.94e-07 -3.70e-07 erg/cm2
90%_error_hi 5.81e-08 8.55e-08 7.43e-08 2.81e-07 2.04e-07 4.43e-07 erg/cm2
Peak flux CPL 4.46e-01 5.05e-01 2.37e-01 3.99e-02 1.22e+00 1.23e+00 ph/cm2/s
90%_error_low -1.35e-01 -1.00e-01 -8.47e-02 -3.99e-02 -2.18e-01 -2.22e-01 ph/cm2/s
90%_error_hi 1.38e-01 1.06e-01 7.88e-02 1.10e-01 2.19e-01 2.30e-01 ph/cm2/s
======================================================================
Image
Pre-slew 15.0-350.0 keV image (Event data)
#   RAcent    DECcent   POSerr    Theta     Phi              Peak Cts       SNR   Name
  168.8987    32.4535   0.0110    25.2528  -120.9612         4.1893369     17.413 TRIG_00996503

Foreground time interval of the image:
-61.464  70.504 (delta_t = 131.968 [sec])
Background time interval of the image:
-239.592 -61.464 (delta_t = 178.128 [sec])
Light Curves
Note: The mask-weighted lightcurves have units of either count/det or counts/sec/det, where a det is 0.4 x 0.4 = 0.16 sq cm.
Full-time range; 1 s binning
Other quick-look light curves:
- 64 ms binning (zoomed)
- 16 ms binning (zoomed)
- 8 ms binning (zoomed)
- 2 ms binning (zoomed)
- SN=5 or 10 s binning (full-time range)
- Raw light curve
Spectra
- 64 ms binning (zoomed)
- 16 ms binning (zoomed)
- 8 ms binning (zoomed)
- 2 ms binning (zoomed)
- SN=5 or 10 s binning (full-time range)
- Raw light curve
Spectra
Notes:
- 1) The fitting includes the systematic errors.
- 2) When the burst includes telescope slew time periods, the fitting uses an average response file made from multiple 5-s response files through out the slew time plus single time preiod for the non-slew times, and weighted by the total counts in the corresponding time period using addrmf. An average response file is needed becuase a spectral fit using the pre-slew DRM will introduce some errors in both a spectral shape and a normalization if the PHA file contains a lot of the slew/post-slew time interval.
- 3) For fits to more complicated models (e.g. a power-law over a cutoff power-law), the BAT team has decided to require a chi-square improvement of more than 6 for each extra dof.
Time averaged spectrum fit using the average DRM
Power-law model
Time interval is from  -61.464 sec. to   70.504 sec.

Spectral model in power-law:
------------------------------------------------------------
Parameters  : value       lower 90%   higher 90%
Photon index: -2.24727     ( -0.169846   0.162086 )
Norm@50keV  : 1.49768E-03    ( -0.000172585   0.000170176 )
------------------------------------------------------------
#Fit statistic  : Chi-Squared                   58.76     using 59 bins.
 Reduced chi-squared = 1.03088
# Null hypothesis probability of 4.11e-01 with 57 degrees of freedom

Photon flux (15-150 keV)    in 132 sec: 0.254300 ( -0.019897  0.0199 ) ph/cm2/s
Energy fluence (15-150 keV)             : 1.87242e-06 ( -1.78651e-07  1.83015e-07 ) ergs/cm2
Cutoff power-law model
Time interval is from  -61.464 sec. to   70.504 sec.
Spectral model in the cutoff power-law:
------------------------------------------------------------
Parameters  : value       lower 90%   higher 90%
Photon index: -2.23673     ( -0.295839   0.155172 )
Epeak [keV] : 9999.36      (   )
Norm@50keV  : 1.50910E-03    (     )
------------------------------------------------------------
#Fit statistic  : Chi-Squared                   58.77     using 59 bins.
 Reduced chi-squared = 1.04946
# Null hypothesis probability of 3.74e-01 with 56 degrees of freedom

Photon flux (15-150 keV)    in 132 sec: 0.251149 ( -0.019426  0.019793 ) ph/cm2/s
Energy fluence (15-150 keV)             : 1.80573e-06 ( -1.94258e-07  2.03516e-07 ) ergs/cm2
1-s peak spectrum fit
Power-law model
Time interval is from    1.036 sec. to    2.036 sec.

Spectral model in power-law:
------------------------------------------------------------
Parameters  : value       lower 90%   higher 90%
Photon index: -1.82478     ( -0.301435   0.279408 )
Norm@50keV  : 9.05201E-03    ( -0.00190418   0.00185915 )
------------------------------------------------------------
#Fit statistic  : Chi-Squared                   58.54     using 59 bins.
 Reduced chi-squared = 1.02702
# Null hypothesis probability of 4.19e-01 with 57 degrees of freedom

Photon flux (15-150 keV)    in 1 sec: 1.25960 ( -0.21941  0.21941 ) ph/cm2/s
Energy fluence (15-150 keV)             : 8.32818e-08 ( -1.73022e-08  1.78435e-08 ) ergs/cm2
Cutoff power-law model
Time interval is from    1.036 sec. to    2.036 sec.
Spectral model in the cutoff power-law:
------------------------------------------------------------
Parameters  : value       lower 90%   higher 90%
Photon index: -0.352848     ( -1.22556   1.6833 )
Epeak [keV] : 47.0320      ( -11.6526 33.7496 )
Norm@50keV  : 6.40774E-02    ( -0.0640766   0.579892 )
------------------------------------------------------------
#Fit statistic  : Chi-Squared                   54.11     using 59 bins.
 Reduced chi-squared = 0.96625
# Null hypothesis probability of 5.47e-01 with 56 degrees of freedom

Photon flux (15-150 keV)    in 1 sec: 1.22302 ( -0.21797  0.21946 ) ph/cm2/s
Energy fluence (15-150 keV)             : 7.44132e-08 ( -1.67671e-08  1.86076e-08 ) ergs/cm2
Time-resolved spectra
Distribution
T90 vs. Hardness ratio plot
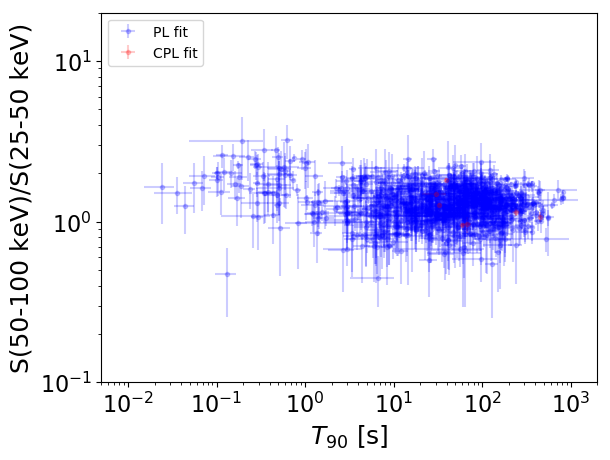
T90                                   = N/A sec.
Hardness ratio (energy fluence ratio) = N/A
S(15-50 keV) vs. S(50-150 keV) plot
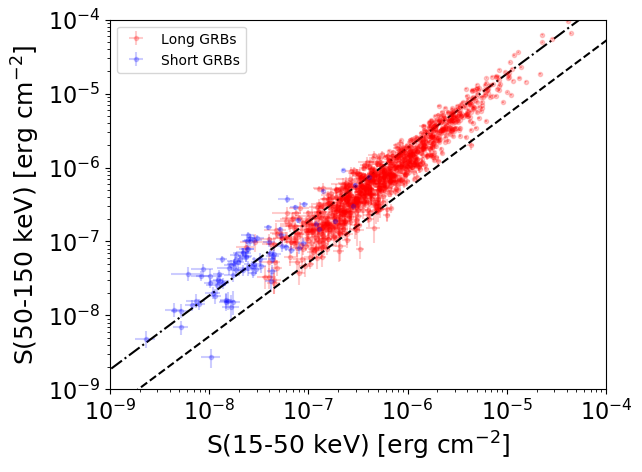
S(15-50 keV)  = N/A
S(50-150 keV) = N/A
The dash-dotted line and the dashed line traces the fluences calculated from the Band function with Epeak = 15 and 150 keV, respectively. Both lines assume a canonical values of alpha = -1 and beta = -2.5.
Mask shadow pattern
IMX = -2.426649597517645E-01, IMY = 4.044829706038347E-01
Spacecraft aspect plot
Bright source in the pre-burst/pre-slew/post-slew images
Pre-burst image of 15-350 keV band
Time interval of the image:
-239.592000 -61.464000

# RAcent  DECcent POSerr Theta    Phi  PeakCts   SNR AngSep     Name
#  [deg]    [deg]    ['] [deg]  [deg]                   [']
 98.6128  49.9027    2.7  32.2  100.1   1.5220   4.2 ------	UNKNOWN
109.5692  70.3693    5.5  38.2  135.7   1.0265   2.1 ------	UNKNOWN
111.9821  28.0213    2.8  23.7   50.2   1.0156   4.1 ------	UNKNOWN
176.9736  61.3118    2.7  35.4 -178.0   1.1731   4.3 ------	UNKNOWN
138.2139  14.9667    2.5  20.5  -28.1   0.9415   4.6 ------	UNKNOWN
Pre-slew background subtracted image of 15-350 keV band
Time interval of the image:
-61.464000 70.504000

# RAcent  DECcent POSerr Theta    Phi  PeakCts   SNR AngSep     Name
#  [deg]    [deg]    ['] [deg]  [deg]                   [']
168.8988  32.4535    0.7  25.3 -121.0   4.1894  17.4 ------	UNKNOWN
Post-slew image of 15-350 keV band
Time interval of the image:
603.708610 962.447300

# RAcent  DECcent POSerr Theta    Phi  PeakCts   SNR AngSep     Name
#  [deg]    [deg]    ['] [deg]  [deg]                   [']
254.6232  35.3068  672.4  26.8 -176.5   0.0066   0.0    8.4	Her X-1
299.6547  35.0343    0.0  38.3  115.3   1.9148   1.9   10.5	Cyg X-1
308.1931  41.0571    4.5  37.2  100.7   2.1159   2.5    7.3	Cyg X-3
269.4817  84.6411    2.4  22.8    4.5   1.6423   4.9 ------	UNKNOWN
102.6636  68.6382    3.1  47.9  -11.5   2.4258   3.7 ------	UNKNOWN
102.7905  60.0066    3.8  56.2  -14.6   3.9450   3.0 ------	UNKNOWN
111.7175  60.5073    2.6  54.4  -19.5   4.9879   4.4 ------	UNKNOWN
127.7772  62.5239    2.9  49.4  -27.3   3.4056   4.0 ------	UNKNOWN
211.7355  28.4735    2.9  44.2 -117.3   5.5281   4.0 ------	UNKNOWN