Analysis Summary
Notes:
- 1) No attempt has been made to eliminate the non-significant decimal places.
- 2) This batgrbproduct analysis is done using the HEASARC data.
- 3) This batgrbproduct analysis is using the flight position for the mask-weighting calculation.
======================================================================
                  BAT GRB EVENT DATA PROCESSING REPORT
    Process Script Ver: batgrbproduct v2.48
    Process Start Time: Wed Oct 19 23:36:15 EDT 2022
             Host Name: batproc1
   Current Working Dir: /local/data/bat1/alien/Swift_3rdBATcatalog/event/batevent_reproc/trigger998344
======================================================================

  Trigger: 00998344      Segment: 000

  BAT Trigger Time: 623239157.376   [s; MET]
      Trigger Stop: 623239165.568   [s; MET]
               UTC: 2020-10-01T09:58:51.646720    [includes UTCF correction]
       Where From?: TDRSS position message

  BAT
    RA: 110.070324685104   Dec: -2.21023113971737  [deg; J2000]

     Catalogged Source?: NO
     Point Source?:      YES
     GRB Indicated?:     YES    [ by BAT flight software ]
     Image S/N Ratio:    9.08
     Image Trigger?:     NO
     Rate S/N Ratio:     14  [ if not an image trigger ]
     Image S/N Ratio:    9.08

  Analysis Position:   [ source = BAT ]
    RA: 110.070324685104   Dec: -2.21023113971737  [deg; J2000]

  Refined Position:   [ source = BAT pre-slew burst ]
    RA: 110.050186926441   Dec: -2.2073015459776  [deg; J2000]
        { 07h 20m 12.0s , -02d 12' 26.3" }
         +/- 1.84663949713475 [arcmin] (estimated 90% radius based on SNR)
         +/- 0.702284928597041 [arcmin] (formal 1-sigma fit error)
    SNR: 12.6640464224537

  Angular difference between the analysis and refined position is 1.220096 arcmin

  Partial Coding Fraction: 0.3867188    [ including projection effects ]

  Duration
     T90: 15.8880000114441 +/- 3.13463230466351
        Measured from: -3.12000000476837
                   to: 12.7680000066757     [s; relative to TRIGTIME]
     T50: 8.44800007343292 +/- 2.32551076713568
        Measured from: 2.01599991321564
                   to: 10.4639999866486     [s; relative to TRIGTIME]


  Fluence
     Peak Flux  (peak 1 second)
        Measured from: 10.7879999876022
                   to: 11.7879999876022     [s; relative to TRIGTIME]
     Total Fluence
        Measured from: -4.01600003242493
                   to: 14.2879999876022     [s; relative to TRIGTIME]

             Band 1     Band 2     Band 3     Band 4
              15-25      25-50     50-100    100-350     keV
 Total     0.159187   0.386627   0.416583   0.133774
           0.046646   0.050054   0.044923   0.039542 [error]
 Peak      0.018948   0.057217   0.041031   0.019273
           0.011323   0.011981   0.010621   0.009681 [error]

     [ fluence units of on-axis counts / fully illuminated detector ]

======================================================================


====== Table of the duration information =============================

        Value   tstart    tstop
T100   18.304   -4.016   14.288
T90    15.888   -3.120   12.768
T50     8.448    2.016   10.464
Peak    1.000   10.788   11.788


====== Spectral Analysis Summary =====================================

Model      : spectral model: simple power-law (PL) and cutoff power-law (CPL)
Ph_index   : photon index: E^{Ph_index}
Ph_90err   : 90% error of the photon index
Epeak      : Epeak in keV
Epeak_90err: 90% error of Epeak
Norm       : normalization at 50 keV in both the PL model and CPL model
Nomr_90err : 90% error of the normalization
chi2       : Chi-Squared
dof        : degree of freedo

=== Time-averaged spectral analysis ===
(Best model with acceptable fit: N/A)

Model Ph_index Ph_90err_low Ph_90err_hi  Epeak  Epeak_90err_low  Epeak_90err_hi  Norm       Nomr_90err_low    Norm_90err_hi    chi2    dof
PL      -0.940    -0.218      0.231       -           -               -         4.06e-03     -5.45e-04          5.39e-04      56.670   57
CPL     -0.143    -0.925      1.203      138.338     -51.727      -138.338      8.87e-03     -8.87e-03          1.81e-02      54.630   56


=== 1-s peak spectral analysis ===
(Best model with acceptable fit: N/A)

Model Ph_index Ph_90err_low Ph_90err_hi  Epeak  Epeak_90err_low  Epeak_90err_hi  Norm       Nomr_90err_low    Norm_90err_hi    chi2    dof
PL      -1.428     -0.444     0.432       -           -               -         7.76e-03     -2.25e-03          2.24e-03      57.870   57
CPL      2.918     -3.406    -2.918       56.663     -11.203        31.769      1.02e+00     -1.02e+00          3.04e+03      52.310   56


=== Fluence/Peak Flux Summary ===

              Model    Band1     Band2     Band3     Band4     Band5     Total
                       15-25     25-50    50-100    100-350    15-150    15-350    keV
Fluence         PL   5.63e-08  1.46e-07  3.04e-07  1.62e-06  8.20e-07  2.13e-06   erg/cm2
      90%_error_low -1.48e-08 -2.46e-08 -4.12e-08 -4.49e-07 -1.09e-07 -4.72e-07   erg/cm2
      90%_error_hi   1.64e-08  2.42e-08  4.08e-08  5.65e-07  1.10e-07  5.72e-07   erg/cm2
Peak flux       PL   2.98e-01  3.13e-01  2.33e-01  2.80e-01  9.51e-01  1.12e+00   ph/cm2/s
      90%_error_low -1.27e-01 -9.63e-02 -7.96e-02 -1.50e-01 -2.76e-01 -3.25e-01   ph/cm2/s
      90%_error_hi   1.44e-01  9.51e-02  7.87e-02  2.17e-01  2.77e-01  3.29e-01   ph/cm2/s

Fluence        CPL   4.51e-08  1.52e-07  3.31e-07  6.77e-07  7.94e-07  1.20e-06   erg/cm2
      90%_error_low -1.83e-08 -2.75e-08 -5.18e-08 -3.98e-07 -1.18e-07 -4.07e-07   erg/cm2
      90%_error_hi   2.06e-08  2.78e-08  5.32e-08  1.11e-06  1.16e-07  1.10e-06   erg/cm2
Peak flux      CPL   9.88e-02  4.09e-01  2.86e-01  1.37e-02  8.06e-01  8.09e-01   ph/cm2/s
      90%_error_low -9.88e-02 -1.43e-01 -1.30e-01 -1.37e-02 -2.83e-01 -2.86e-01   ph/cm2/s
      90%_error_hi   2.01e-01  1.49e-01  1.16e-01  1.25e-01  3.14e-01  3.20e-01   ph/cm2/s

======================================================================
Image
Pre-slew 15.0-350.0 keV image (Event data)
#   RAcent    DECcent   POSerr    Theta     Phi              Peak Cts       SNR   Name
  110.0502    -2.2073   0.0152    30.1286    83.9451         1.2338653     12.664 TRIG_00998344

Foreground time interval of the image:
 -4.016  14.288 (delta_t =  18.304 [sec])
Background time interval of the image:
-129.275  -4.016 (delta_t = 125.259 [sec])
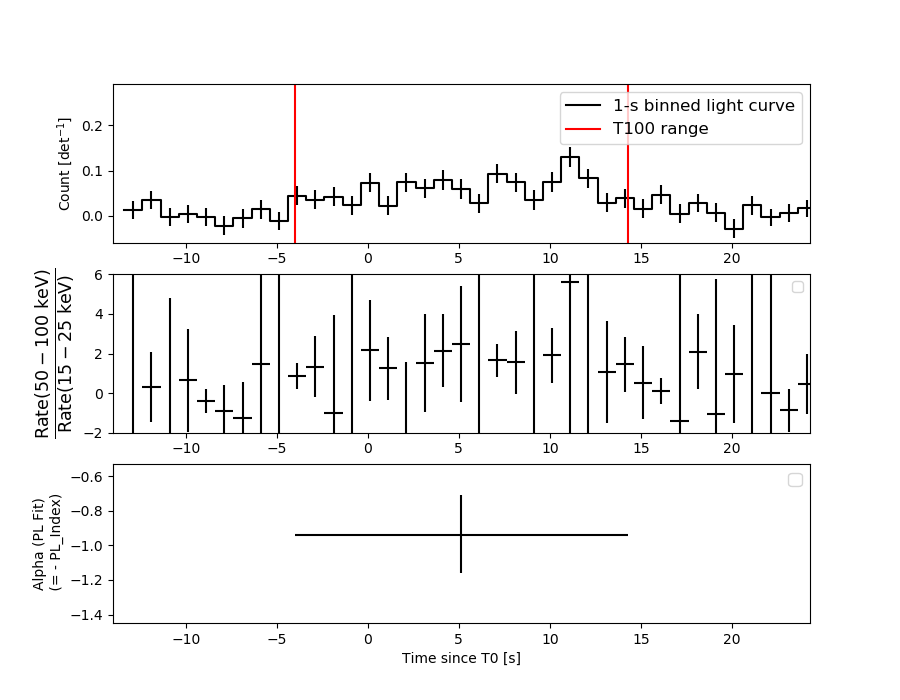
Light Curves
Note: The mask-weighted lightcurves have units of either count/det or counts/sec/det, where a det is 0.4 x 0.4 = 0.16 sq cm.
Full-time range; 1 s binning
Other quick-look light curves:
- 64 ms binning (zoomed)
- 16 ms binning (zoomed)
- 8 ms binning (zoomed)
- 2 ms binning (zoomed)
- SN=5 or 10 s binning (full-time range)
- Raw light curve
Spectra
- 64 ms binning (zoomed)
- 16 ms binning (zoomed)
- 8 ms binning (zoomed)
- 2 ms binning (zoomed)
- SN=5 or 10 s binning (full-time range)
- Raw light curve
Spectra
Notes:
- 1) The fitting includes the systematic errors.
- 2) When the burst includes telescope slew time periods, the fitting uses an average response file made from multiple 5-s response files through out the slew time plus single time preiod for the non-slew times, and weighted by the total counts in the corresponding time period using addrmf. An average response file is needed becuase a spectral fit using the pre-slew DRM will introduce some errors in both a spectral shape and a normalization if the PHA file contains a lot of the slew/post-slew time interval.
- 3) For fits to more complicated models (e.g. a power-law over a cutoff power-law), the BAT team has decided to require a chi-square improvement of more than 6 for each extra dof.
Time averaged spectrum fit using the average DRM
Power-law model
Time interval is from   -4.016 sec. to   14.288 sec.

Spectral model in power-law:
------------------------------------------------------------
Parameters  : value       lower 90%   higher 90%
Photon index: -0.940419     ( -0.218375   0.230551 )
Norm@50keV  : 4.05613E-03    ( -0.000545238   0.000539011 )
------------------------------------------------------------
#Fit statistic  : Chi-Squared                   56.67     using 59 bins.
 Reduced chi-squared = 0.994211
# Null hypothesis probability of 4.87e-01 with 57 degrees of freedom

Photon flux (15-150 keV)    in 18.3 sec: 0.465879 ( -0.062883  0.063273 ) ph/cm2/s
Energy fluence (15-150 keV)             : 8.20373e-07 ( -1.09436e-07  1.09859e-07 ) ergs/cm2
Cutoff power-law model
Time interval is from   -4.016 sec. to   14.288 sec.
Spectral model in the cutoff power-law:
------------------------------------------------------------
Parameters  : value       lower 90%   higher 90%
Photon index: -0.14331     ( -0.924723   1.20284 )
Epeak [keV] : 138.338      ( -51.7272 -138.338 )
Norm@50keV  : 8.87224E-03    ( -0.00887224   0.018083 )
------------------------------------------------------------
#Fit statistic  : Chi-Squared                   54.63     using 59 bins.
 Reduced chi-squared = 0.975536
# Null hypothesis probability of 5.27e-01 with 56 degrees of freedom

Photon flux (15-150 keV)    in 18.3 sec: 0.450376 ( -0.065646  0.06595 ) ph/cm2/s
Energy fluence (15-150 keV)             : 7.93618e-07 ( -1.17969e-07  1.16193e-07 ) ergs/cm2
1-s peak spectrum fit
Power-law model
Time interval is from   10.788 sec. to   11.788 sec.

Spectral model in power-law:
------------------------------------------------------------
Parameters  : value       lower 90%   higher 90%
Photon index: -1.42759     ( -0.445177   0.431443 )
Norm@50keV  : 7.75943E-03    ( -0.00225183   0.00224027 )
------------------------------------------------------------
#Fit statistic  : Chi-Squared                   57.87     using 59 bins.
 Reduced chi-squared = 1.01526
# Null hypothesis probability of 4.43e-01 with 57 degrees of freedom

Photon flux (15-150 keV)    in 1 sec: 0.950976 ( -0.27603  0.277144 ) ph/cm2/s
Energy fluence (15-150 keV)             : 7.45916e-08 ( -2.30533e-08  2.34951e-08 ) ergs/cm2
Cutoff power-law model
Time interval is from   10.788 sec. to   11.788 sec.
Spectral model in the cutoff power-law:
------------------------------------------------------------
Parameters  : value       lower 90%   higher 90%
Photon index: 3.94952     ( -3.46898   -2.98095 )
Epeak [keV] : 54.8536      ( -10.9518 32.0207 )
Norm@50keV  : 3.20078    ( -3.1648   3041.32 )
------------------------------------------------------------
#Fit statistic  : Chi-Squared                   52.26     using 59 bins.
 Reduced chi-squared = 0.933214
# Null hypothesis probability of 6.17e-01 with 56 degrees of freedom

Photon flux (15-150 keV)    in 1 sec: 0.806341 ( -0.282722  0.313539 ) ph/cm2/s
Energy fluence (15-150 keV)             : 6.01381e-08 ( -2.12175e-08  2.63109e-08 ) ergs/cm2
Time-resolved spectra
Distribution
T90 vs. Hardness ratio plot
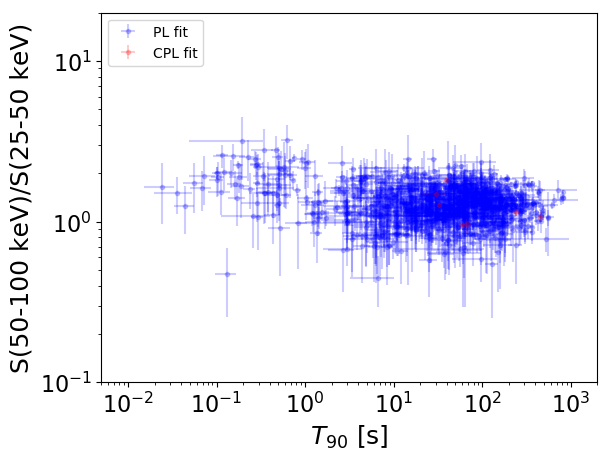
T90                                   = N/A sec.
Hardness ratio (energy fluence ratio) = N/A
S(15-50 keV) vs. S(50-150 keV) plot
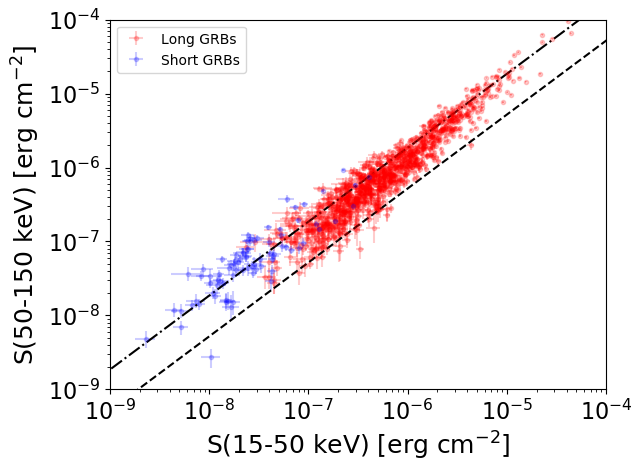
S(15-50 keV)  = N/A
S(50-150 keV) = N/A
The dash-dotted line and the dashed line traces the fluences calculated from the Band function with Epeak = 15 and 150 keV, respectively. Both lines assume a canonical values of alpha = -1 and beta = -2.5.
Mask shadow pattern
IMX = 6.121586613625030E-02, IMY = -5.771094880487742E-01
Spacecraft aspect plot
Bright source in the pre-burst/pre-slew/post-slew images
Pre-burst image of 15-350 keV band
Time interval of the image:
-129.275400 -4.016000

# RAcent  DECcent POSerr Theta    Phi  PeakCts   SNR AngSep     Name
#  [deg]    [deg]    ['] [deg]  [deg]                   [']
135.6762 -40.6137   15.4  41.5    4.6   0.2230   0.7    7.6	Vela X-1
104.4826  39.3044    2.9  50.4  143.8   4.0328   4.0 ------	UNKNOWN
108.0417  -2.2523    2.4  32.1   84.2   1.6374   4.8 ------	UNKNOWN
112.7443  44.7971    2.9  50.3  154.5   2.8034   4.0 ------	UNKNOWN
118.1844 -49.5848    2.1  53.7   17.0   4.1925   5.4 ------	UNKNOWN
120.1837 -27.8234    2.4  34.3   31.8   1.2701   4.9 ------	UNKNOWN
Pre-slew background subtracted image of 15-350 keV band
Time interval of the image:
-4.016000 14.288000

# RAcent  DECcent POSerr Theta    Phi  PeakCts   SNR AngSep     Name
#  [deg]    [deg]    ['] [deg]  [deg]                   [']
135.6764 -40.5980    5.8  41.5    4.6   0.1954   2.0    7.2	Vela X-1
106.5972 -16.2876    2.5  37.1   60.8   0.6138   4.7 ------	UNKNOWN
110.0502  -2.2073    0.9  30.1   83.9   1.2339  12.7 ------	UNKNOWN
111.7679  15.8592    1.9  31.7  119.5   0.5989   6.0 ------	UNKNOWN
179.7918  40.5230    2.4  53.7 -143.3   1.3908   4.8 ------	UNKNOWN
Post-slew image of 15-350 keV band
Time interval of the image:
100.324600 962.754000

# RAcent  DECcent POSerr Theta    Phi  PeakCts   SNR AngSep     Name
#  [deg]    [deg]    ['] [deg]  [deg]                   [']
 83.6370  22.0196    0.5  35.4  131.7  34.5225  21.7    0.4	Crab
135.5472 -40.6761    7.3  44.8  -30.4   2.3242   1.6    7.3	Vela X-1
 82.7256  -0.0536    3.3  27.5   91.3   4.3855   3.5 ------	UNKNOWN
112.2224  52.0996    3.0  54.4  178.7  11.6823   3.8 ------	UNKNOWN
127.8768 -56.5862    5.5  56.2  -14.5   6.0759   2.1 ------	UNKNOWN