Analysis Summary
Notes:
- 1) No attempt has been made to eliminate the non-significant decimal places.
- 2) This batgrbproduct analysis is done using the HEASARC data.
- 3) This batgrbproduct analysis is using the flight position for the mask-weighting calculation.
======================================================================
                  BAT GRB EVENT DATA PROCESSING REPORT
    Process Script Ver: batgrbproduct v2.48
    Process Start Time: Wed Oct 19 23:34:36 EDT 2022
             Host Name: batproc1
   Current Working Dir: /local/data/bat1/alien/Swift_3rdBATcatalog/event/batevent_reproc/trigger998907
======================================================================

  Trigger: 00998907      Segment: 000

  BAT Trigger Time: 623639897.792   [s; MET]
      Trigger Stop: 623639898.304   [s; MET]
               UTC: 2020-10-06T01:17:52.036340    [includes UTCF correction]
       Where From?: TDRSS position message

  BAT
    RA: 61.8805369706886   Dec: 65.1498487714513  [deg; J2000]

     Catalogged Source?: NO
     Point Source?:      YES
     GRB Indicated?:     YES    [ by BAT flight software ]
     Image S/N Ratio:    8.04
     Image Trigger?:     NO
     Rate S/N Ratio:     20.1990098767242  [ if not an image trigger ]
     Image S/N Ratio:    8.04

  Analysis Position:   [ source = BAT ]
    RA: 61.8805369706886   Dec: 65.1498487714513  [deg; J2000]

  Refined Position:   [ source = BAT pre-slew burst ]
    RA: 61.9103366569327   Dec: 65.1482317602382  [deg; J2000]
        { 04h 07m 38.5s , +65d 08' 53.6" }
         +/- 2.04717476707876 [arcmin] (estimated 90% radius based on SNR)
         +/- 0.964106804919205 [arcmin] (formal 1-sigma fit error)
    SNR: 10.9297782682986

  Angular difference between the analysis and refined position is 0.757653 arcmin

  Partial Coding Fraction: 0.3359375    [ including projection effects ]

  Duration
     T90: 0.491999864578247 +/- 0.0856036610542782
        Measured from: 0.0279999971389771
                   to: 0.519999861717224     [s; relative to TRIGTIME]
     T50: 0.25600004196167 +/- 0.0832345620352619
        Measured from: 0.127999901771545
                   to: 0.383999943733215     [s; relative to TRIGTIME]


  Fluence
     Peak Flux  (peak 1 second)
        Measured from: -0.230000019073486
                   to: 0.769999980926514     [s; relative to TRIGTIME]
     Total Fluence
        Measured from: -0.00800001621246338
                   to: 0.547999978065491     [s; relative to TRIGTIME]

             Band 1     Band 2     Band 3     Band 4
              15-25      25-50     50-100    100-350     keV
 Total     0.042682   0.096350   0.066646   0.021653
           0.010539   0.012380   0.010622   0.008562 [error]
 Peak      0.056272   0.132172   0.074768   0.003812
           0.013484   0.015205   0.013193   0.011387 [error]

     [ fluence units of on-axis counts / fully illuminated detector ]

======================================================================


====== Table of the duration information =============================

        Value   tstart    tstop
T100    0.556   -0.008    0.548
T90     0.492    0.028    0.520
T50     0.256    0.128    0.384
Peak    1.000   -0.230    0.770


====== Spectral Analysis Summary =====================================

Model      : spectral model: simple power-law (PL) and cutoff power-law (CPL)
Ph_index   : photon index: E^{Ph_index}
Ph_90err   : 90% error of the photon index
Epeak      : Epeak in keV
Epeak_90err: 90% error of Epeak
Norm       : normalization at 50 keV in both the PL model and CPL model
Nomr_90err : 90% error of the normalization
chi2       : Chi-Squared
dof        : degree of freedo

=== Time-averaged spectral analysis ===
(Best model with acceptable fit: N/A)

Model Ph_index Ph_90err_low Ph_90err_hi  Epeak  Epeak_90err_low  Epeak_90err_hi  Norm       Nomr_90err_low    Norm_90err_hi    chi2    dof
PL      -1.424    -0.245      0.244       -           -               -         2.40e-02     -3.99e-03          3.98e-03      64.370   57
CPL      0.400    -1.284      1.805       62.476     -13.112        40.663      2.22e-01     -2.22e-01          1.78e+00      57.880   56


=== 1-s peak spectral analysis ===
(Best model with acceptable fit: N/A)

Model Ph_index Ph_90err_low Ph_90err_hi  Epeak  Epeak_90err_low  Epeak_90err_hi  Norm       Nomr_90err_low    Norm_90err_hi    chi2    dof
PL      -1.499     -0.240     0.236       -           -               -         1.72e-02     -2.86e-03          2.85e-03      72.750   57
CPL      1.373     -1.537     2.422       52.962      -7.989         9.363      6.11e-01     -6.11e-01          1.15e+01      59.980   56


=== Fluence/Peak Flux Summary ===

              Model    Band1     Band2     Band3     Band4     Band5     Total
                       15-25     25-50    50-100    100-350    15-150    15-350    keV
Fluence         PL   1.59e-08  3.05e-08  4.55e-08  1.46e-07  1.28e-07  2.38e-07   erg/cm2
      90%_error_low -3.98e-09 -5.29e-09 -9.14e-09 -5.13e-08 -2.29e-08 -6.09e-08   erg/cm2
      90%_error_hi   4.21e-09  5.24e-09  9.08e-09  6.59e-08  2.31e-08  7.22e-08   erg/cm2
Peak flux       PL   7.07e-01  7.12e-01  5.04e-01  5.67e-01  2.15e+00  2.49e+00   ph/cm2/s
      90%_error_low -1.67e-01 -1.19e-01 -1.01e-01 -1.90e-01 -3.46e-01 -4.08e-01   ph/cm2/s
      90%_error_hi   1.76e-01  1.18e-01  1.01e-01  2.37e-01  3.47e-01  4.11e-01   ph/cm2/s

Fluence        CPL   1.26e-08  3.80e-08  4.93e-08  2.03e-08  1.15e-07  1.20e-07   erg/cm2
      90%_error_low -4.58e-09 -7.56e-09 -1.25e-08 -1.57e-08 -2.39e-08 -2.80e-08   erg/cm2
      90%_error_hi   4.82e-09  8.14e-09  1.16e-08  5.08e-08  2.51e-08  5.14e-08   erg/cm2
Peak flux      CPL   4.81e-01  9.54e-01  5.39e-01  5.05e-02  2.02e+00  2.02e+00   ph/cm2/s
      90%_error_low -1.95e-01 -1.76e-01 -1.48e-01 -5.05e-02 -3.48e-01 -3.50e-01   ph/cm2/s
      90%_error_hi   2.10e-01  1.86e-01  1.39e-01  1.18e-01  3.51e-01  3.58e-01   ph/cm2/s

======================================================================
Image
Pre-slew 15.0-350.0 keV image (Event data)
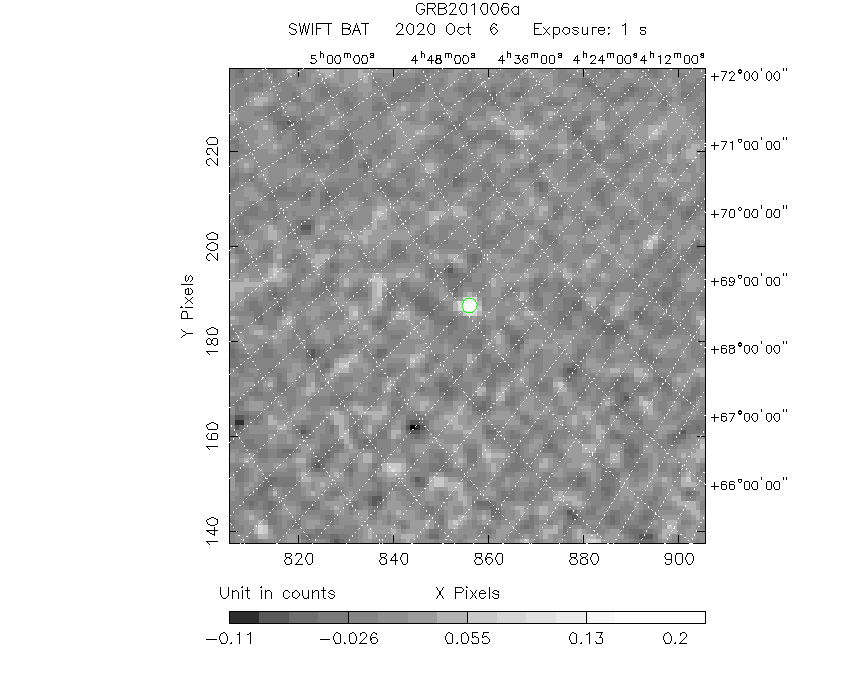
#   RAcent    DECcent   POSerr    Theta     Phi              Peak Cts       SNR   Name
   61.9103    65.1482   0.0176    31.3518    85.3135         0.2455157     10.930 TRIG_00998907

Foreground time interval of the image:
 -0.008   0.548 (delta_t =   0.556 [sec])
Background time interval of the image:
-65.291  -0.008 (delta_t =  65.283 [sec])
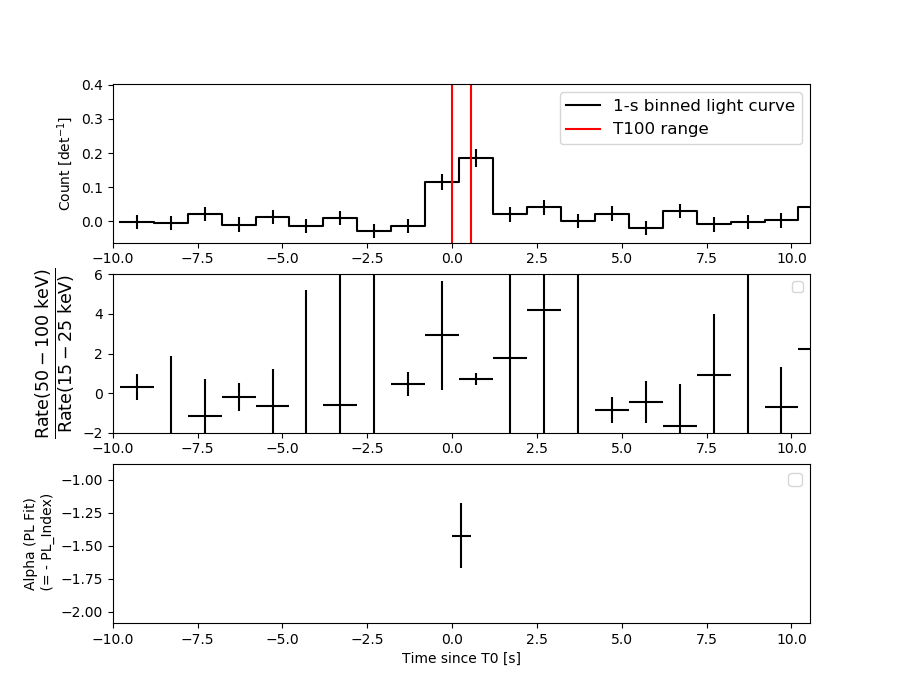
Light Curves
Note: The mask-weighted lightcurves have units of either count/det or counts/sec/det, where a det is 0.4 x 0.4 = 0.16 sq cm.
Full-time range; 1 s binning
Other quick-look light curves:
- 64 ms binning (zoomed)
- 16 ms binning (zoomed)
- 8 ms binning (zoomed)
- 2 ms binning (zoomed)
- SN=5 or 10 s binning (full-time range)
- Raw light curve
Spectra
- 64 ms binning (zoomed)
- 16 ms binning (zoomed)
- 8 ms binning (zoomed)
- 2 ms binning (zoomed)
- SN=5 or 10 s binning (full-time range)
- Raw light curve
Spectra
Notes:
- 1) The fitting includes the systematic errors.
- 2) When the burst includes telescope slew time periods, the fitting uses an average response file made from multiple 5-s response files through out the slew time plus single time preiod for the non-slew times, and weighted by the total counts in the corresponding time period using addrmf. An average response file is needed becuase a spectral fit using the pre-slew DRM will introduce some errors in both a spectral shape and a normalization if the PHA file contains a lot of the slew/post-slew time interval.
- 3) For fits to more complicated models (e.g. a power-law over a cutoff power-law), the BAT team has decided to require a chi-square improvement of more than 6 for each extra dof.
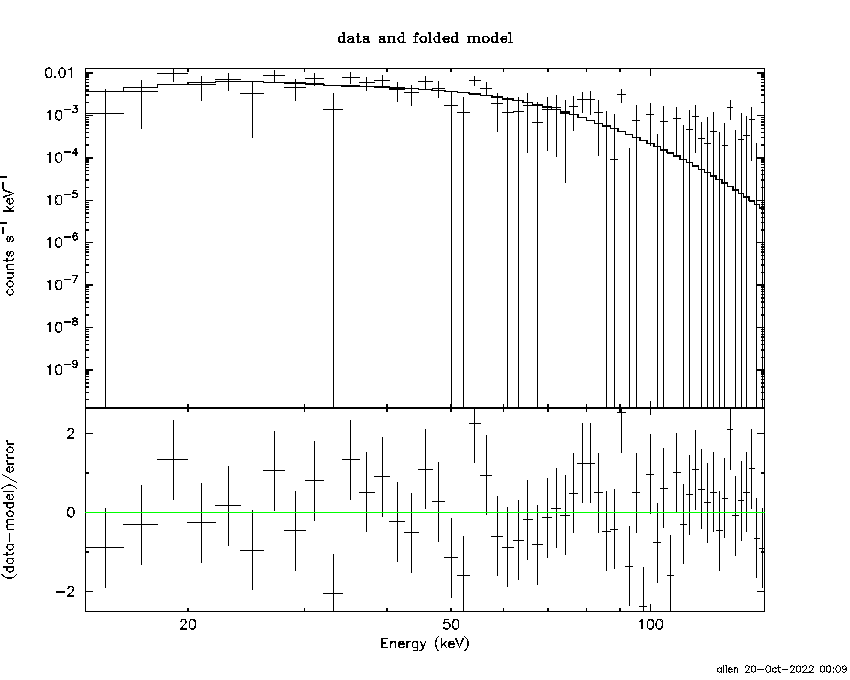
Time averaged spectrum fit using the average DRM
Power-law model
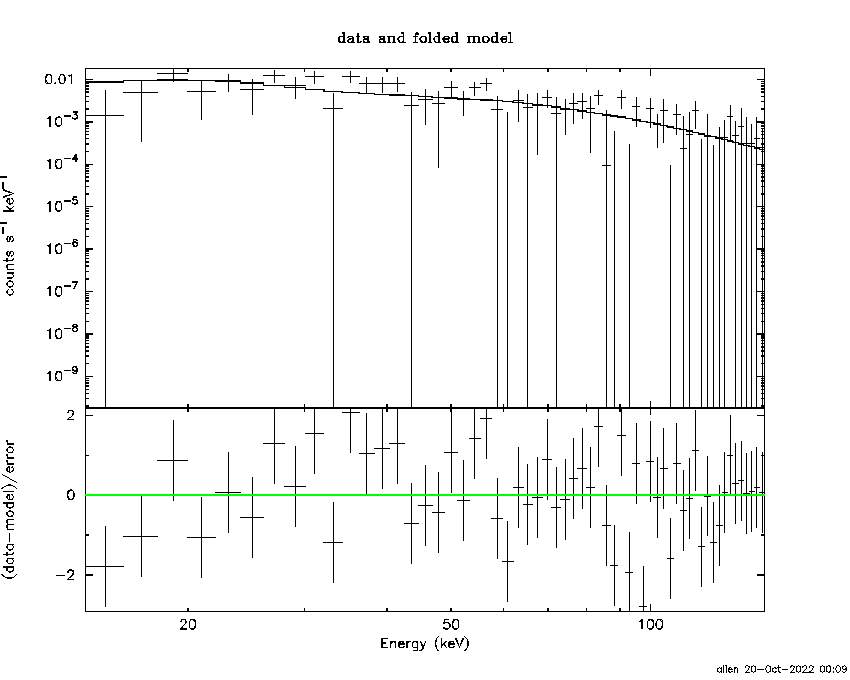
Time interval is from   -0.008 sec. to    0.548 sec.

Spectral model in power-law:
------------------------------------------------------------
Parameters  : value       lower 90%   higher 90%
Photon index: -1.42397     ( -0.244638   0.244088 )
Norm@50keV  : 2.39932E-02    ( -0.00399338   0.00398172 )
------------------------------------------------------------
#Fit statistic  : Chi-Squared                   64.37     using 59 bins.
 Reduced chi-squared = 1.1293
# Null hypothesis probability of 2.34e-01 with 57 degrees of freedom

Photon flux (15-150 keV)    in 0.556 sec: 2.93831 ( -0.4907  0.49153 ) ph/cm2/s
Energy fluence (15-150 keV)             : 1.28299e-07 ( -2.29055e-08  2.31074e-08 ) ergs/cm2
Cutoff power-law model
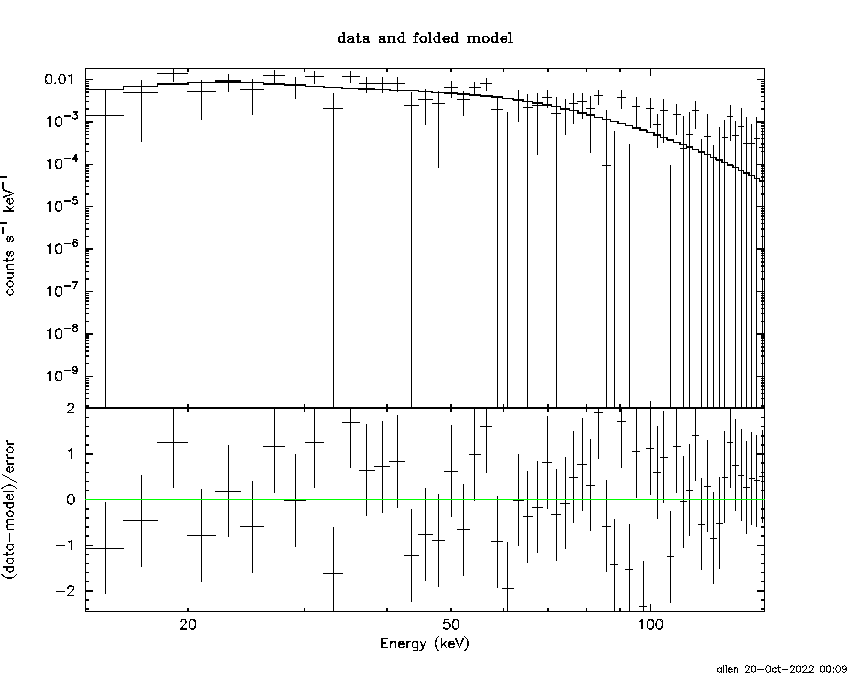
Time interval is from   -0.008 sec. to    0.548 sec.
Spectral model in the cutoff power-law:
------------------------------------------------------------
Parameters  : value       lower 90%   higher 90%
Photon index: 0.400334     ( -1.28481   1.80431 )
Epeak [keV] : 62.4757      ( -13.1064 40.669 )
Norm@50keV  : 0.221521    ( -0.221653   1.78347 )
------------------------------------------------------------
#Fit statistic  : Chi-Squared                   57.88     using 59 bins.
 Reduced chi-squared = 1.03357
# Null hypothesis probability of 4.06e-01 with 56 degrees of freedom

Photon flux (15-150 keV)    in 0.556 sec: 2.84932 ( -0.49707  0.4983 ) ph/cm2/s
Energy fluence (15-150 keV)             : 1.15485e-07 ( -2.39226e-08  2.5138e-08 ) ergs/cm2
1-s peak spectrum fit
Power-law model
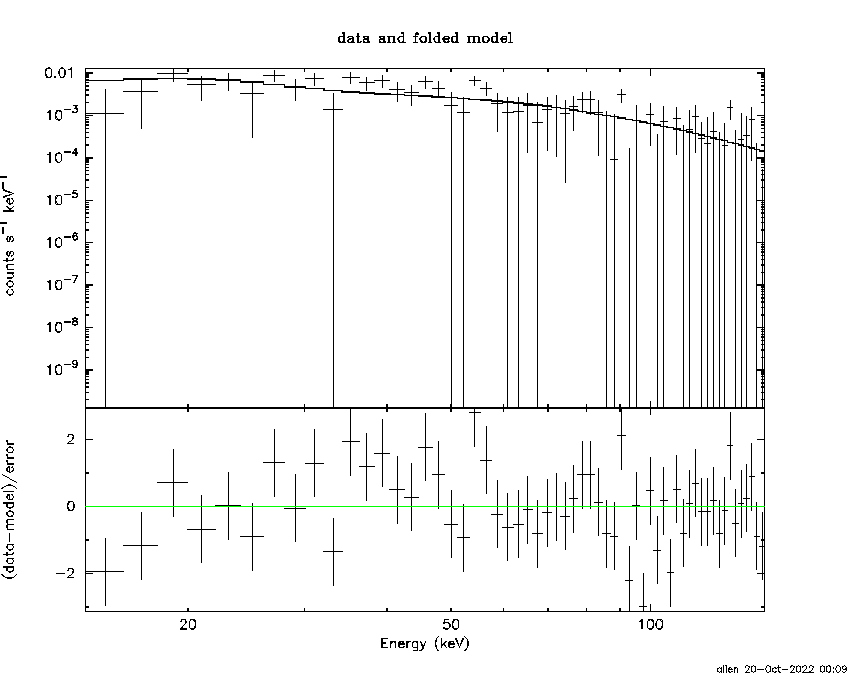
Time interval is from   -0.230 sec. to    0.770 sec.

Spectral model in power-law:
------------------------------------------------------------
Parameters  : value       lower 90%   higher 90%
Photon index: -1.49865     ( -0.240385   0.236243 )
Norm@50keV  : 1.72052E-02    ( -0.00286471   0.00284735 )
------------------------------------------------------------
#Fit statistic  : Chi-Squared                   72.75     using 59 bins.
 Reduced chi-squared = 1.27632
# Null hypothesis probability of 7.80e-02 with 57 degrees of freedom

Photon flux (15-150 keV)    in 1 sec: 2.14716 ( -0.34649  0.34684 ) ph/cm2/s
Energy fluence (15-150 keV)             : 1.63271e-07 ( -2.9115e-08  2.95392e-08 ) ergs/cm2
Cutoff power-law model
Time interval is from   -0.230 sec. to    0.770 sec.
Spectral model in the cutoff power-law:
------------------------------------------------------------
Parameters  : value       lower 90%   higher 90%
Photon index: 1.37334     ( -1.58291   2.37601 )
Epeak [keV] : 52.9620      ( -7.7439 9.60793 )
Norm@50keV  : 0.610603    ( -0.673718   11.394 )
------------------------------------------------------------
#Fit statistic  : Chi-Squared                   59.98     using 59 bins.
 Reduced chi-squared = 1.07107
# Null hypothesis probability of 3.34e-01 with 56 degrees of freedom

Photon flux (15-150 keV)    in 1 sec: 2.02157 ( -0.34777  0.3512 ) ph/cm2/s
Energy fluence (15-150 keV)             : 1.36842e-07 ( -2.6579e-08  2.99672e-08 ) ergs/cm2
Time-resolved spectra
Distribution
T90 vs. Hardness ratio plot
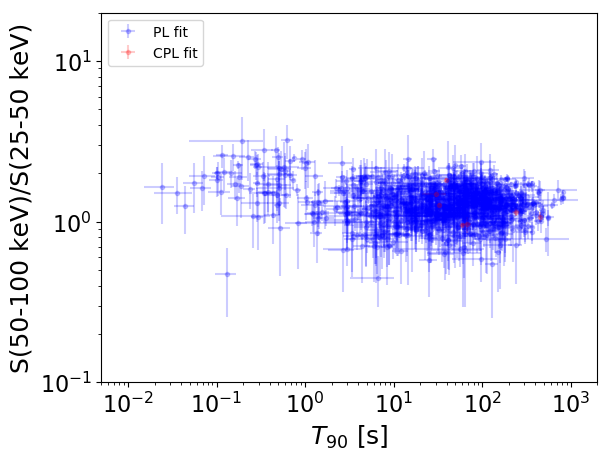
T90                                   = N/A sec.
Hardness ratio (energy fluence ratio) = N/A
S(15-50 keV) vs. S(50-150 keV) plot
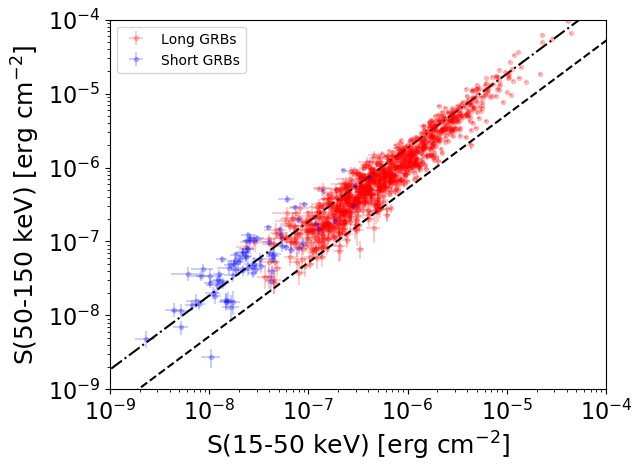
S(15-50 keV)  = N/A
S(50-150 keV) = N/A
The dash-dotted line and the dashed line traces the fluences calculated from the Band function with Epeak = 15 and 150 keV, respectively. Both lines assume a canonical values of alpha = -1 and beta = -2.5.
Mask shadow pattern
IMX = 4.977743143023378E-02, IMY = -6.072106334266935E-01
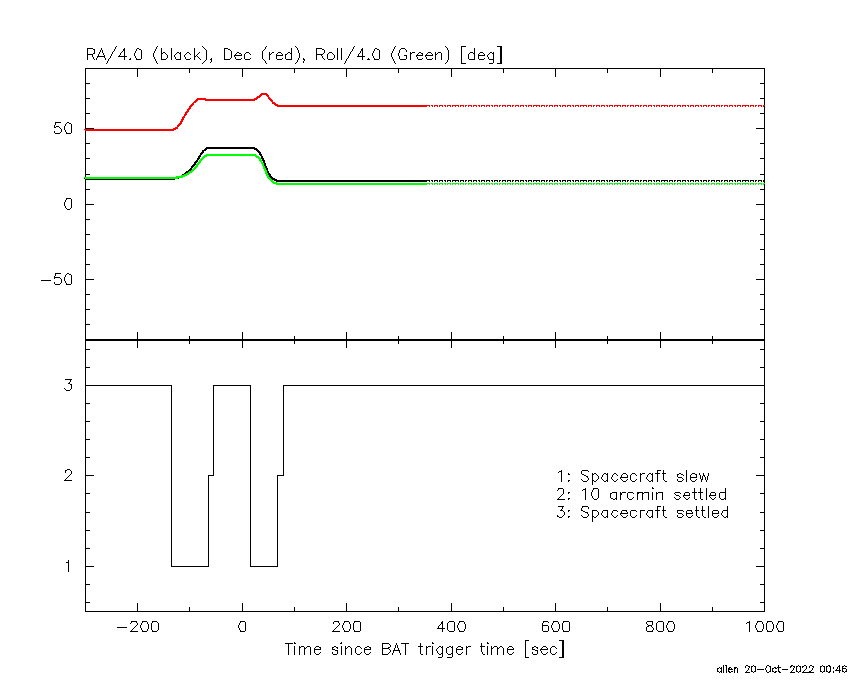
Spacecraft aspect plot
Bright source in the pre-burst/pre-slew/post-slew images
Pre-burst image of 15-350 keV band
Time interval of the image:
-65.291320 -0.008000

# RAcent  DECcent POSerr Theta    Phi  PeakCts   SNR AngSep     Name
#  [deg]    [deg]    ['] [deg]  [deg]                   [']
104.9906  23.7817    2.7  52.4   13.1   1.5217   4.2 ------	UNKNOWN
245.6056  62.1918    2.5  36.1 -168.9   0.6364   4.6 ------	UNKNOWN
250.7487  46.3380    2.4  51.1 -160.5   1.4684   4.8 ------	UNKNOWN
134.4238  11.2332    3.1  58.7  -23.5   2.6169   3.8 ------	UNKNOWN
223.2383  38.0551    3.1  49.1 -132.0   2.0452   3.7 ------	UNKNOWN
Pre-slew background subtracted image of 15-350 keV band
Time interval of the image:
-0.008000 0.548000

# RAcent  DECcent POSerr Theta    Phi  PeakCts   SNR AngSep     Name
#  [deg]    [deg]    ['] [deg]  [deg]                   [']
 61.9104  65.1482    1.1  31.4   85.3   0.2455  10.9 ------	UNKNOWN
206.6489  59.4624    2.9  25.5 -137.6   0.0479   4.0 ------	UNKNOWN
167.0389  26.4521    2.4  43.9  -63.8   0.1830   4.8 ------	UNKNOWN
224.4385  37.8204    3.0  49.8 -133.0   0.1699   3.9 ------	UNKNOWN
Post-slew image of 15-350 keV band
Time interval of the image:
68.308580 718.643400
720.208000 962.285900

# RAcent  DECcent POSerr Theta    Phi  PeakCts   SNR AngSep     Name
#  [deg]    [deg]    ['] [deg]  [deg]                   [']
 83.6155  22.0098    0.4  45.4    7.1  34.6127  27.2    1.0	Crab
 86.0569  12.2190    3.1  55.5    6.9  10.8455   3.7 ------	UNKNOWN
297.0647  57.2654    2.6  50.7 -179.1   9.7784   4.4 ------	UNKNOWN
 93.1301  14.1512    3.0  55.2   -1.8   8.5225   3.9 ------	UNKNOWN
 74.7586  61.5401    3.3   6.8  -27.8   2.9325   3.5 ------	UNKNOWN
121.7474  48.6130    4.2  34.9  -55.5   4.0195   2.7 ------	UNKNOWN
121.1820  29.5813    2.8  50.6  -39.4  11.4508   4.2 ------	UNKNOWN
123.3287  28.3711    3.1  52.5  -40.8  14.4027   3.7 ------	UNKNOWN