Analysis Summary
Notes:
- 1) No attempt has been made to eliminate the non-significant decimal places.
- 2) This batgrbproduct analysis is done using the HEASARC data.
- 3) This batgrbproduct analysis is using the flight position for the mask-weighting calculation.
======================================================================
                  BAT GRB EVENT DATA PROCESSING REPORT
    Process Script Ver: batgrbproduct v2.48
    Process Start Time: Wed Oct 19 23:33:05 EDT 2022
             Host Name: batproc1
   Current Working Dir: /local/data/bat1/alien/Swift_3rdBATcatalog/event/batevent_reproc/trigger999948
======================================================================

  Trigger: 00999948      Segment: 000

  BAT Trigger Time: 624253616.448   [s; MET]
      Trigger Stop: 624253616.576   [s; MET]
               UTC: 2020-10-13T03:46:30.651960    [includes UTCF correction]
       Where From?: TDRSS position message

  BAT
    RA: 107.387835387955   Dec: 57.0358898588483  [deg; J2000]

     Catalogged Source?: NO
     Point Source?:      YES
     GRB Indicated?:     YES    [ by BAT flight software ]
     Image S/N Ratio:    13.37
     Image Trigger?:     NO
     Rate S/N Ratio:     116.858889263932  [ if not an image trigger ]
     Image S/N Ratio:    13.37

  Analysis Position:   [ source = BAT ]
    RA: 107.387835387955   Dec: 57.0358898588483  [deg; J2000]

  Refined Position:   [ source = BAT pre-slew burst ]
    RA: 107.391724441058   Dec: 57.03116466483  [deg; J2000]
        { 07h 09m 34.0s , +57d 01' 52.2" }
         +/- 0.624191607961191 [arcmin] (estimated 90% radius based on SNR)
         +/- 0.175463504557986 [arcmin] (formal 1-sigma fit error)
    SNR: 59.6377628442747

  Angular difference between the analysis and refined position is 0.310646 arcmin

  Partial Coding Fraction: 0.640625    [ including projection effects ]

  Duration
     T90: 7.31599986553192 +/- 0.178392941915236
        Measured from: -0.0519999265670776
                   to: 7.26399993896484     [s; relative to TRIGTIME]
     T50: 5.3879998922348 +/- 0.0572712379609395
        Measured from: 0.552000045776367
                   to: 5.93999993801117     [s; relative to TRIGTIME]


  Fluence
     Peak Flux  (peak 1 second)
        Measured from: -0.0479999780654907
                   to: 0.952000021934509     [s; relative to TRIGTIME]
     Total Fluence
        Measured from: -0.847999930381775
                   to: 9.29200005531311     [s; relative to TRIGTIME]

             Band 1     Band 2     Band 3     Band 4
              15-25      25-50     50-100    100-350     keV
 Total     2.031375   3.424386   3.265379   0.877752
           0.042013   0.050667   0.049670   0.034195 [error]
 Peak      0.529774   1.026705   1.219173   0.388663
           0.018931   0.025343   0.028406   0.019962 [error]

     [ fluence units of on-axis counts / fully illuminated detector ]

======================================================================


====== Table of the duration information =============================

        Value   tstart    tstop
T100   10.140   -0.848    9.292
T90     7.316   -0.052    7.264
T50     5.388    0.552    5.940
Peak    1.000   -0.048    0.952


====== Spectral Analysis Summary =====================================

Model      : spectral model: simple power-law (PL) and cutoff power-law (CPL)
Ph_index   : photon index: E^{Ph_index}
Ph_90err   : 90% error of the photon index
Epeak      : Epeak in keV
Epeak_90err: 90% error of Epeak
Norm       : normalization at 50 keV in both the PL model and CPL model
Nomr_90err : 90% error of the normalization
chi2       : Chi-Squared
dof        : degree of freedo

=== Time-averaged spectral analysis ===
(Best model with acceptable fit: N/A)

Model Ph_index Ph_90err_low Ph_90err_hi  Epeak  Epeak_90err_low  Epeak_90err_hi  Norm       Nomr_90err_low    Norm_90err_hi    chi2    dof
PL      -1.221    -0.035      0.035       -           -               -         6.49e-02     -1.28e-03          1.28e-03      42.820   57
CPL     -0.847    -0.149      0.154      184.572     -36.357        79.018      9.34e-02     -1.23e-02          1.46e-02      23.550   56


=== 1-s peak spectral analysis ===
(Best model with acceptable fit: N/A)

Model Ph_index Ph_90err_low Ph_90err_hi  Epeak  Epeak_90err_low  Epeak_90err_hi  Norm       Nomr_90err_low    Norm_90err_hi    chi2    dof
PL      -0.920     -0.048     0.048       -           -               -         2.14e-01     -5.94e-03          5.93e-03      57.600   57
CPL     -0.529     -0.197     0.206      227.237     -57.635       161.617      3.14e-01     -5.37e-02          6.76e-02      45.740   56


=== Fluence/Peak Flux Summary ===

              Model    Band1     Band2     Band3     Band4     Band5     Total
                       15-25     25-50    50-100    100-350    15-150    15-350    keV
Fluence         PL   6.48e-07  1.41e-06  2.42e-06  9.60e-06  6.64e-06  1.41e-05   erg/cm2
      90%_error_low -2.66e-08 -3.45e-08 -5.23e-08 -4.75e-07 -1.34e-07 -4.97e-07   erg/cm2
      90%_error_hi   2.71e-08  3.44e-08  5.21e-08  4.91e-07  1.34e-07  5.11e-07   erg/cm2
Peak flux       PL   5.07e+00  7.22e+00  7.63e+00  1.49e+01  2.46e+01  3.48e+01   ph/cm2/s
      90%_error_low -2.90e-01 -2.53e-01 -2.25e-01 -9.43e-01 -6.86e-01 -1.09e+00   ph/cm2/s
      90%_error_hi   2.96e-01  2.52e-01  2.25e-01  9.83e-01  6.86e-01  1.10e+00   ph/cm2/s

Fluence        CPL   5.02e-07  6.58e-07  6.62e-07  1.52e-06  2.23e-06  3.32e-06   erg/cm2
      90%_error_low    N/A       N/A       N/A       N/A       N/A       N/A      erg/cm2
      90%_error_hi     N/A       N/A       N/A       N/A       N/A       N/A      erg/cm2
Peak flux      CPL   4.52e+00  7.32e+00  8.02e+00  1.05e+01  2.42e+01  3.03e+01   ph/cm2/s
      90%_error_low -3.80e-01 -2.67e-01 -2.95e-01 -1.64e+00 -7.07e-01 -1.80e+00   ph/cm2/s
      90%_error_hi   3.89e-01  2.67e-01  2.97e-01  2.03e+00  7.07e-01  2.13e+00   ph/cm2/s

======================================================================
Image
Pre-slew 15.0-350.0 keV image (Event data)
#   RAcent    DECcent   POSerr    Theta     Phi              Peak Cts       SNR   Name
  107.3917    57.0312   0.0032    23.0626   -76.0820         9.5582565     59.638 TRIG_00999948

Foreground time interval of the image:
 -0.848   9.292 (delta_t =  10.140 [sec])
Background time interval of the image:
-239.448  -0.848 (delta_t = 238.600 [sec])
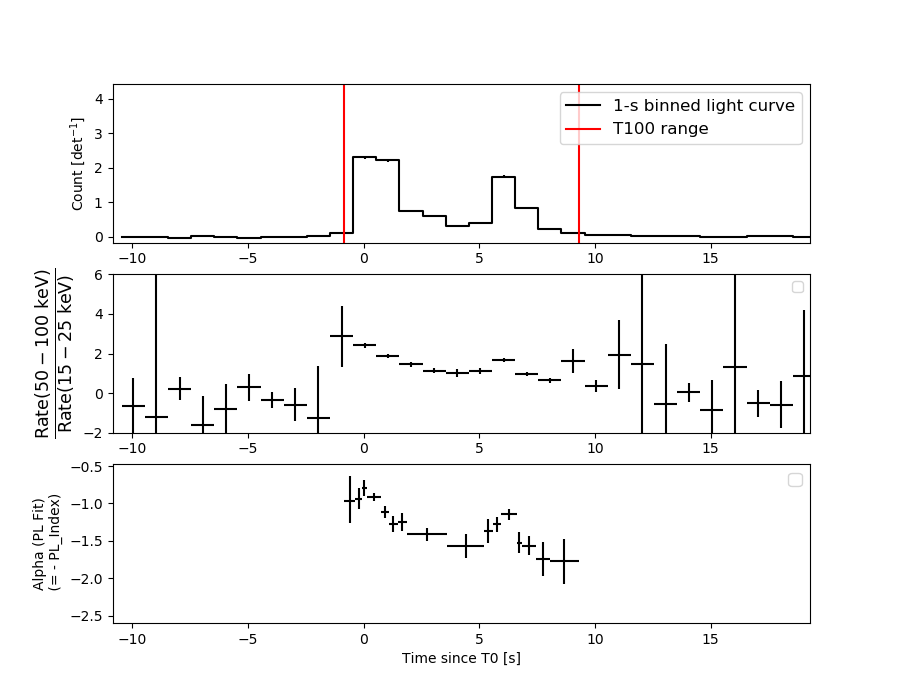
Light Curves
Note: The mask-weighted lightcurves have units of either count/det or counts/sec/det, where a det is 0.4 x 0.4 = 0.16 sq cm.
Full-time range; 1 s binning
Other quick-look light curves:
- 64 ms binning (zoomed)
- 16 ms binning (zoomed)
- 8 ms binning (zoomed)
- 2 ms binning (zoomed)
- SN=5 or 10 s binning (full-time range)
- Raw light curve
Spectra
- 64 ms binning (zoomed)
- 16 ms binning (zoomed)
- 8 ms binning (zoomed)
- 2 ms binning (zoomed)
- SN=5 or 10 s binning (full-time range)
- Raw light curve
Spectra
Notes:
- 1) The fitting includes the systematic errors.
- 2) When the burst includes telescope slew time periods, the fitting uses an average response file made from multiple 5-s response files through out the slew time plus single time preiod for the non-slew times, and weighted by the total counts in the corresponding time period using addrmf. An average response file is needed becuase a spectral fit using the pre-slew DRM will introduce some errors in both a spectral shape and a normalization if the PHA file contains a lot of the slew/post-slew time interval.
- 3) For fits to more complicated models (e.g. a power-law over a cutoff power-law), the BAT team has decided to require a chi-square improvement of more than 6 for each extra dof.
Time averaged spectrum fit using the average DRM
Power-law model
Time interval is from   -0.848 sec. to    9.292 sec.

Spectral model in power-law:
------------------------------------------------------------
Parameters  : value       lower 90%   higher 90%
Photon index: -1.22133     ( -0.0353454   0.0354238 )
Norm@50keV  : 6.49180E-02    ( -0.00127637   0.00127546 )
------------------------------------------------------------
#Fit statistic  : Chi-Squared                   42.82     using 59 bins.
 Reduced chi-squared = 0.751228
# Null hypothesis probability of 9.18e-01 with 57 degrees of freedom

Photon flux (15-150 keV)    in 10.14 sec: 7.64376 ( -0.16283  0.16314 ) ph/cm2/s
Energy fluence (15-150 keV)             : 6.63969e-06 ( -1.33933e-07  1.33882e-07 ) ergs/cm2
Cutoff power-law model
Time interval is from   -0.848 sec. to    9.292 sec.
Spectral model in the cutoff power-law:
------------------------------------------------------------
Parameters  : value       lower 90%   higher 90%
Photon index: -0.846669     ( -0.148738   0.153662 )
Epeak [keV] : 184.572      ( -36.357 79.0181 )
Norm@50keV  : 9.34143E-02    ( -0.0122761   0.0145805 )
------------------------------------------------------------
#Fit statistic  : Chi-Squared                   23.55     using 59 bins.
 Reduced chi-squared = 0.420536
# Null hypothesis probability of 1.00e+00 with 56 degrees of freedom

Photon flux (15-150 keV)    in 10.14 sec: 7.46306 ( -0.17505  0.17569 ) ph/cm2/s
Energy fluence (15-150 keV)             : 2.23032e-06 ( 0  0 ) ergs/cm2
1-s peak spectrum fit
Power-law model
Time interval is from   -0.048 sec. to    0.952 sec.

Spectral model in power-law:
------------------------------------------------------------
Parameters  : value       lower 90%   higher 90%
Photon index: -0.919749     ( -0.0480351   0.0482247 )
Norm@50keV  : 0.214166    ( -0.00594122   0.00593499 )
------------------------------------------------------------
#Fit statistic  : Chi-Squared                   57.60     using 59 bins.
 Reduced chi-squared = 1.01053
# Null hypothesis probability of 4.53e-01 with 57 degrees of freedom

Photon flux (15-150 keV)    in 1 sec: 24.5876 ( -0.6859  0.6861 ) ph/cm2/s
Energy fluence (15-150 keV)             : 2.38556e-06 ( -7.17377e-08  7.18635e-08 ) ergs/cm2
Cutoff power-law model
Time interval is from   -0.048 sec. to    0.952 sec.
Spectral model in the cutoff power-law:
------------------------------------------------------------
Parameters  : value       lower 90%   higher 90%
Photon index: -0.529416     ( -0.197334   0.206414 )
Epeak [keV] : 227.237      ( -57.6352 161.617 )
Norm@50keV  : 0.313593    ( -0.0536981   0.0676413 )
------------------------------------------------------------
#Fit statistic  : Chi-Squared                   45.74     using 59 bins.
 Reduced chi-squared = 0.816786
# Null hypothesis probability of 8.34e-01 with 56 degrees of freedom

Photon flux (15-150 keV)    in 1 sec: 24.2277 ( -0.7067  0.707 ) ph/cm2/s
Energy fluence (15-150 keV)             : 2.3557e-06 ( -7.47278e-08  7.45447e-08 ) ergs/cm2
Time-resolved spectra
Distribution
T90 vs. Hardness ratio plot
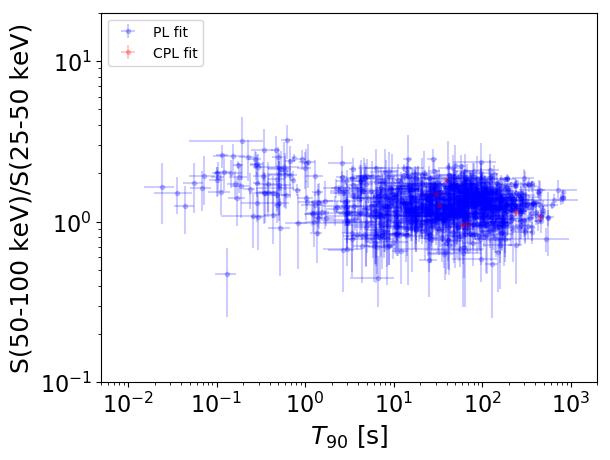
T90                                   = N/A sec.
Hardness ratio (energy fluence ratio) = N/A
S(15-50 keV) vs. S(50-150 keV) plot
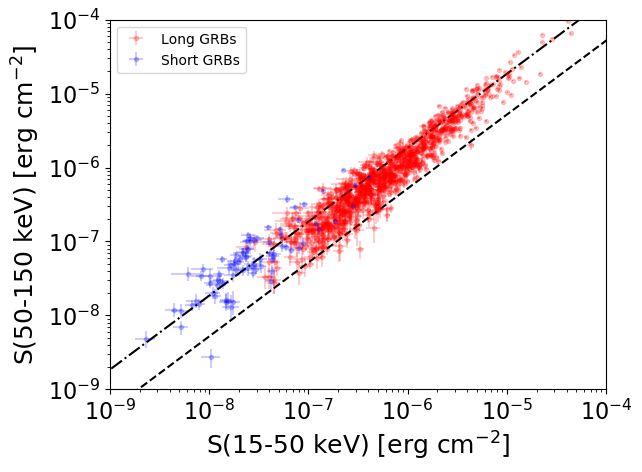
S(15-50 keV)  = N/A
S(50-150 keV) = N/A
The dash-dotted line and the dashed line traces the fluences calculated from the Band function with Epeak = 15 and 150 keV, respectively. Both lines assume a canonical values of alpha = -1 and beta = -2.5.
Mask shadow pattern
IMX = 1.024100542210024E-01, IMY = 4.132641197389955E-01
Spacecraft aspect plot
Bright source in the pre-burst/pre-slew/post-slew images
Pre-burst image of 15-350 keV band
Time interval of the image:
-239.448000 -0.848000

# RAcent  DECcent POSerr Theta    Phi  PeakCts   SNR AngSep     Name
#  [deg]    [deg]    ['] [deg]  [deg]                   [']
 83.6257  22.0169    0.6  36.7    4.5   8.2753  20.9    0.4	Crab
 70.7460   6.4089    2.2  49.8   26.8   5.0376   5.3 ------	UNKNOWN
347.6825  70.1121    3.2  34.8  178.7   1.3257   3.6 ------	UNKNOWN
295.0116  77.3813    2.8  43.1 -159.9   2.3097   4.1 ------	UNKNOWN
119.2396  23.9097    3.2  50.6  -39.5   3.6733   3.6 ------	UNKNOWN
Pre-slew background subtracted image of 15-350 keV band
Time interval of the image:
-0.848000 9.292000

# RAcent  DECcent POSerr Theta    Phi  PeakCts   SNR AngSep     Name
#  [deg]    [deg]    ['] [deg]  [deg]                   [']
 83.7833  21.9946    8.7  36.7    4.3  -0.2193  -1.3    8.4	Crab
 13.9387  33.7241    3.8  41.2  113.5   1.2478   3.1 ------	UNKNOWN
 52.9912  12.4207    2.5  44.5   51.1   1.9763   4.7 ------	UNKNOWN
 31.3894  27.4467    2.8  37.3   88.4   1.2197   4.1 ------	UNKNOWN
 23.3727  34.8623    3.2  35.2  105.2   0.8351   3.6 ------	UNKNOWN
 73.4583   3.0834    3.8  53.3   23.7   1.8130   3.0 ------	UNKNOWN
 49.1990  39.6259    3.6  19.4   73.4   0.4859   3.2 ------	UNKNOWN
 79.6639  16.3499    2.9  41.2   12.6   0.8081   4.0 ------	UNKNOWN
 14.6194  79.6432    2.4  28.4 -162.6   0.6096   4.9 ------	UNKNOWN
121.4339  87.4632    2.8  32.7 -141.8   0.6328   4.1 ------	UNKNOWN
107.3917  57.0312    0.2  23.1  -76.1   9.5578  59.6 ------	UNKNOWN
276.8520  70.0510    2.6  51.9 -158.9   1.6812   4.4 ------	UNKNOWN
Post-slew image of 15-350 keV band
Time interval of the image:
53.652620 962.614900

# RAcent  DECcent POSerr Theta    Phi  PeakCts   SNR AngSep     Name
#  [deg]    [deg]    ['] [deg]  [deg]                   [']
 83.6312  22.0184    0.5  39.1   33.3  33.2014  21.5    0.3	Crab
343.9303  67.1362    3.8  49.0  151.5  10.9482   3.0 ------	UNKNOWN
 87.7911  21.6211    2.4  38.2   27.2   6.7349   4.8 ------	UNKNOWN
 53.3524  68.0019    2.5  26.1  133.6   4.8711   4.6 ------	UNKNOWN
311.1491  66.7746    3.6  54.9  165.8  13.0356   3.2 ------	UNKNOWN
105.3623   6.2757    2.5  50.8   -0.5   8.3085   4.5 ------	UNKNOWN
116.6742  12.8238    2.9  44.8  -16.0   5.1281   4.0 ------	UNKNOWN
143.8362  40.2289    3.4  28.9  -73.2   4.3682   3.4 ------	UNKNOWN
136.9802   9.7250    3.0  52.6  -40.9  18.5582   3.9 ------	UNKNOWN
182.9401  48.9867    3.3  43.8 -116.3  14.5142   3.5 ------	UNKNOWN
206.8480  54.4593    3.2  50.9 -135.4  18.4431   3.7 ------	UNKNOWN