Analysis Summary
Notes:
- 1) No attempt has been made to eliminate the non-significant decimal places.
- 2) This batgrbproduct analysis is done using the HEASARC data.
- 3) This batgrbproduct analysis is using the flight position for the mask-weighting calculation.
======================================================================
                  BAT GRB EVENT DATA PROCESSING REPORT
    Process Script Ver: batgrbproduct v2.48
    Process Start Time: Sat Jul 30 01:13:09 EDT 2022
             Host Name: batproc1
   Current Working Dir: /local/data/bat1/alien/Swift_3rdBATcatalog/event/batevent_reproc/trigger1000452
======================================================================

  Trigger: 01000452      Segment: 000

  BAT Trigger Time: 624495039.04   [s; MET]
      Trigger Stop: 624495040.064   [s; MET]
               UTC: 2020-10-15T22:50:13.228080    [includes UTCF correction]
       Where From?: TDRSS position message

  BAT
    RA: 354.342753807982   Dec: 53.3932579228849  [deg; J2000]

     Catalogged Source?: NO
     Point Source?:      YES
     GRB Indicated?:     YES    [ by BAT flight software ]
     Image S/N Ratio:    6.85
     Image Trigger?:     NO
     Rate S/N Ratio:     12.328828005938  [ if not an image trigger ]
     Image S/N Ratio:    6.85

  Analysis Position:   [ source = BAT ]
    RA: 354.342753807982   Dec: 53.3932579228849  [deg; J2000]

  Refined Position:   [ source = BAT pre-slew burst ]
    RA: 354.309838474106   Dec: 53.4458316120034  [deg; J2000]
        { 23h 37m 14.4s , +53d 26' 45.0" }
         +/- 2.85700778812524 [arcmin] (estimated 90% radius based on SNR)
         +/- 1.32074476299214 [arcmin] (formal 1-sigma fit error)
    SNR: 6.78916471364376

  Angular difference between the analysis and refined position is 3.366838 arcmin

  Partial Coding Fraction: 0.3085938    [ including projection effects ]

  Duration
     T90: 9.77600002288818 +/- 3.47078317231481
        Measured from: 0.0800000429153442
                   to: 9.85600006580353     [s; relative to TRIGTIME]
     T50: 5.61600005626678 +/- 3.54576924455029
        Measured from: 0.448000073432922
                   to: 6.06400012969971     [s; relative to TRIGTIME]


  Fluence
     Peak Flux  (peak 1 second)
        Measured from: 0.0839999914169312
                   to: 1.08399999141693     [s; relative to TRIGTIME]
     Total Fluence
        Measured from: 0.0160000324249268
                   to: 10.3519999980927     [s; relative to TRIGTIME]

             Band 1     Band 2     Band 3     Band 4
              15-25      25-50     50-100    100-350     keV
 Total     0.278850   0.131204   0.030439   0.032479
           0.041976   0.041950   0.035741   0.030560 [error]
 Peak      0.111274   0.042507   0.032581   0.002479
           0.015487   0.014805   0.011953   0.009454 [error]

     [ fluence units of on-axis counts / fully illuminated detector ]

======================================================================


====== Table of the duration information =============================

        Value   tstart    tstop
T100   10.336    0.016   10.352
T90     9.776    0.080    9.856
T50     5.616    0.448    6.064
Peak    1.000    0.084    1.084


====== Spectral Analysis Summary =====================================

Model      : spectral model: simple power-law (PL) and cutoff power-law (CPL)
Ph_index   : photon index: E^{Ph_index}
Ph_90err   : 90% error of the photon index
Epeak      : Epeak in keV
Epeak_90err: 90% error of Epeak
Norm       : normalization at 50 keV in both the PL model and CPL model
Nomr_90err : 90% error of the normalization
chi2       : Chi-Squared
dof        : degree of freedo

=== Time-averaged spectral analysis ===
(Best model with acceptable fit: N/A)

Model Ph_index Ph_90err_low Ph_90err_hi  Epeak  Epeak_90err_low  Epeak_90err_hi  Norm       Nomr_90err_low    Norm_90err_hi    chi2    dof
PL      -3.025    -0.776      0.588       -           -               -         1.57e-03     -8.28e-04          9.48e-04      43.940   57
CPL     -1.956     N/A        N/A           1.103      N/A           N/A         9.57e-03        N/A               N/A         44.380   56


=== 1-s peak spectral analysis ===
(Best model with acceptable fit: N/A)

Model Ph_index Ph_90err_low Ph_90err_hi  Epeak  Epeak_90err_low  Epeak_90err_hi  Norm       Nomr_90err_low    Norm_90err_hi    chi2    dof
PL      -3.127     -0.705     0.548       -           -               -         6.07e-03     -2.99e-03          3.38e-03      48.110   57
CPL     -1.980     -0.011     0.063        0.644      -0.429        19.737      3.19e-02     -1.24e-02          8.98e-02      50.180   56


=== Fluence/Peak Flux Summary ===

              Model    Band1     Band2     Band3     Band4     Band5     Total
                       15-25     25-50    50-100    100-350    15-150    15-350    keV
Fluence         PL   8.86e-08  6.55e-08  3.22e-08  2.25e-08  1.97e-07  2.09e-07   erg/cm2
      90%_error_low -2.16e-08 -2.42e-08 -2.00e-08 -1.80e-08 -5.91e-08 -6.83e-08   erg/cm2
      90%_error_hi   2.14e-08  2.29e-08  2.89e-08  4.86e-08  6.70e-08  9.29e-08   erg/cm2
Peak flux       PL   1.22e+00  4.81e-01  1.10e-01  3.04e-02  1.83e+00  1.84e+00   ph/cm2/s
      90%_error_low -2.77e-01 -1.55e-01 -6.30e-02 -3.04e-02 -3.74e-01 -3.80e-01   ph/cm2/s
      90%_error_hi   2.74e-01  1.44e-01  8.62e-02  5.31e-02  3.75e-01  3.81e-01   ph/cm2/s

Fluence        CPL   8.86e-08  7.10e-08  1.73e-08  1.24e-09  1.77e-07  1.77e-07   erg/cm2
      90%_error_low -2.20e-08 -1.37e-08 -1.45e-08 -1.22e-09 -5.44e-08 -5.46e-08   erg/cm2
      90%_error_hi   2.31e-08  2.31e-08  3.61e-08  2.18e-08  6.58e-08  7.11e-08   erg/cm2
Peak flux      CPL   1.15e+00  5.11e-01  5.17e-02  1.09e-03  1.77e+00  1.77e+00   ph/cm2/s
      90%_error_low -2.74e-01 -8.54e-02 -5.17e-02 -1.09e-03 -3.69e-01 -3.69e-01   ph/cm2/s
      90%_error_hi   1.84e-01  1.59e-01  1.18e-01  2.62e-02  3.67e-01  3.70e-01   ph/cm2/s

======================================================================
Image
Pre-slew 15.0-350.0 keV image (Event data)
#   RAcent    DECcent   POSerr    Theta     Phi              Peak Cts       SNR   Name
  354.3098    53.4458   0.0283    32.2843   -86.2549         0.5139592      6.789 TRIG_01000452

Foreground time interval of the image:
  0.016  10.352 (delta_t =  10.336 [sec])
Background time interval of the image:
-239.040   0.016 (delta_t = 239.056 [sec])
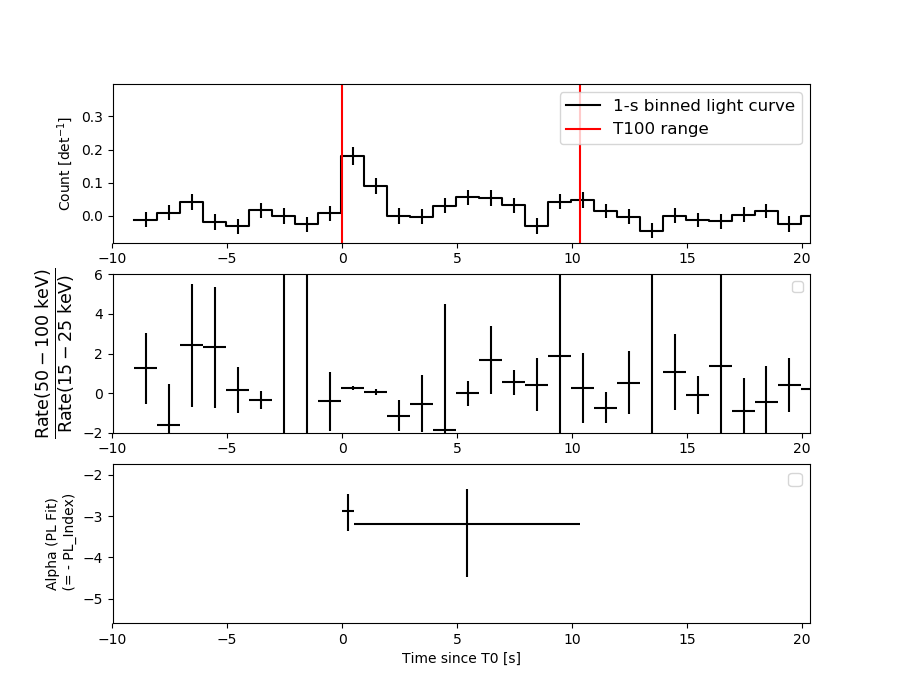
Light Curves
Note: The mask-weighted lightcurves have units of either count/det or counts/sec/det, where a det is 0.4 x 0.4 = 0.16 sq cm.
Full-time range; 1 s binning
Other quick-look light curves:
- 64 ms binning (zoomed)
- 16 ms binning (zoomed)
- 8 ms binning (zoomed)
- 2 ms binning (zoomed)
- SN=5 or 10 s binning (full-time range)
- Raw light curve
Spectra
- 64 ms binning (zoomed)
- 16 ms binning (zoomed)
- 8 ms binning (zoomed)
- 2 ms binning (zoomed)
- SN=5 or 10 s binning (full-time range)
- Raw light curve
Spectra
Notes:
- 1) The fitting includes the systematic errors.
- 2) When the burst includes telescope slew time periods, the fitting uses an average response file made from multiple 5-s response files through out the slew time plus single time preiod for the non-slew times, and weighted by the total counts in the corresponding time period using addrmf. An average response file is needed becuase a spectral fit using the pre-slew DRM will introduce some errors in both a spectral shape and a normalization if the PHA file contains a lot of the slew/post-slew time interval.
- 3) For fits to more complicated models (e.g. a power-law over a cutoff power-law), the BAT team has decided to require a chi-square improvement of more than 6 for each extra dof.
Time averaged spectrum fit using the average DRM
Power-law model
Time interval is from    0.016 sec. to   10.352 sec.

Spectral model in power-law:
------------------------------------------------------------
Parameters  : value       lower 90%   higher 90%
Photon index: -3.02547     ( -0.775984   0.587506 )
Norm@50keV  : 1.56535E-03    ( -0.000827564   0.000947945 )
------------------------------------------------------------
#Fit statistic  : Chi-Squared                   43.94     using 59 bins.
 Reduced chi-squared = 0.770877
# Null hypothesis probability of 8.98e-01 with 57 degrees of freedom

Photon flux (15-150 keV)    in 10.34 sec: 0.438650 ( -0.10051  0.100955 ) ph/cm2/s
Energy fluence (15-150 keV)             : 1.96852e-07 ( -5.90609e-08  6.70488e-08 ) ergs/cm2
Cutoff power-law model
Time interval is from    0.016 sec. to   10.352 sec.
Spectral model in the cutoff power-law:
------------------------------------------------------------
Parameters  : value       lower 90%   higher 90%
Photon index: -1.95609     (       )
Epeak [keV] : 1.10253      (   )
Norm@50keV  : 9.57122E-03    (     )
------------------------------------------------------------
#Fit statistic  : Chi-Squared                   44.38     using 59 bins.
 Reduced chi-squared = 0.7925
# Null hypothesis probability of 8.69e-01 with 56 degrees of freedom

Photon flux (15-150 keV)    in 10.34 sec: 0.422401 ( -0.137427  0.116648 ) ph/cm2/s
Energy fluence (15-150 keV)             : 1.76718e-07 ( -5.44138e-08  6.57648e-08 ) ergs/cm2
1-s peak spectrum fit
Power-law model
Time interval is from    0.084 sec. to    1.084 sec.

Spectral model in power-law:
------------------------------------------------------------
Parameters  : value       lower 90%   higher 90%
Photon index: -3.12683     ( -0.704803   0.548316 )
Norm@50keV  : 6.06878E-03    ( -0.00299047   0.00338436 )
------------------------------------------------------------
#Fit statistic  : Chi-Squared                   48.11     using 59 bins.
 Reduced chi-squared = 0.844035
# Null hypothesis probability of 7.93e-01 with 57 degrees of freedom

Photon flux (15-150 keV)    in 1 sec: 1.83344 ( -0.37416  0.37482 ) ph/cm2/s
Energy fluence (15-150 keV)             : 7.75336e-08 ( -2.05539e-08  2.26323e-08 ) ergs/cm2
Cutoff power-law model
Time interval is from    0.084 sec. to    1.084 sec.
Spectral model in the cutoff power-law:
------------------------------------------------------------
Parameters  : value       lower 90%   higher 90%
Photon index: -1.9677     ( -0.0229113   0.0509479 )
Epeak [keV] : 0.635505      ( -0.418462 19.7474 )
Norm@50keV  : 5.16659E-02    ( -0.0299143   0.0722902 )
------------------------------------------------------------
#Fit statistic  : Chi-Squared                   49.62     using 59 bins.
 Reduced chi-squared = 0.886071
# Null hypothesis probability of 7.14e-01 with 56 degrees of freedom

Photon flux (15-150 keV)    in 1 sec: 1.77393 ( -0.36939  0.36749 ) ph/cm2/s
Energy fluence (15-150 keV)             : 6.82072e-08 ( -1.84873e-08  2.28973e-08 ) ergs/cm2
Time-resolved spectra
Distribution
T90 vs. Hardness ratio plot
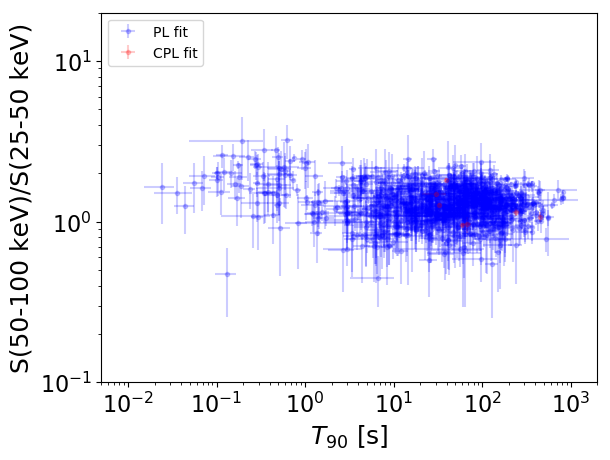
T90                                   = N/A sec.
Hardness ratio (energy fluence ratio) = N/A
S(15-50 keV) vs. S(50-150 keV) plot
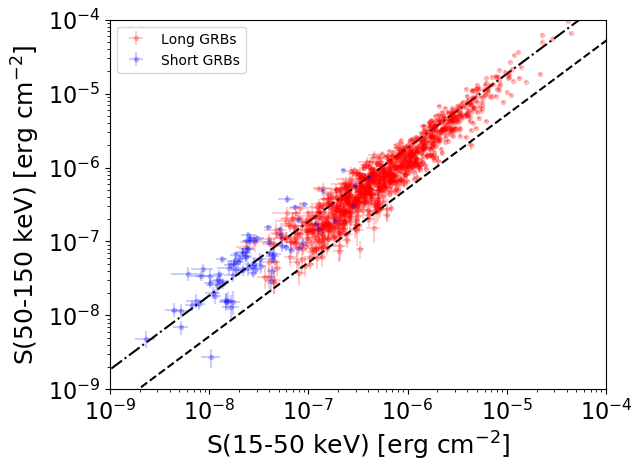
S(15-50 keV)  = N/A
S(50-150 keV) = N/A
The dash-dotted line and the dashed line traces the fluences calculated from the Band function with Epeak = 15 and 150 keV, respectively. Both lines assume a canonical values of alpha = -1 and beta = -2.5.
Mask shadow pattern
IMX = 4.126676935346126E-02, IMY = 6.304410812636503E-01
Spacecraft aspect plot
Bright source in the pre-burst/pre-slew/post-slew images
Pre-burst image of 15-350 keV band
Time interval of the image:
-239.040000 0.016000

# RAcent  DECcent POSerr Theta    Phi  PeakCts   SNR AngSep     Name
#  [deg]    [deg]    ['] [deg]  [deg]                   [']
 16.3759   2.0048    2.7  26.1  133.8   1.3797   4.3 ------	UNKNOWN
 80.3104  38.5405    2.5  50.1    5.1   2.5590   4.7 ------	UNKNOWN
  0.2254  11.5634    3.4  25.2  177.8   0.9562   3.5 ------	UNKNOWN
 48.2507  40.3318    2.3  25.8   -2.7   1.3213   5.0 ------	UNKNOWN
 43.9214  40.7669    3.6  23.0   -6.9   0.7898   3.2 ------	UNKNOWN
 51.4835  57.9814    2.4  37.0  -29.7   1.7693   4.8 ------	UNKNOWN
327.7237   5.4222    2.6  55.0 -160.1   4.8155   4.5 ------	UNKNOWN
  6.8515  54.8109    3.3  28.9  -73.1   1.1997   3.5 ------	UNKNOWN
Pre-slew background subtracted image of 15-350 keV band
Time interval of the image:
0.016000 10.352000

# RAcent  DECcent POSerr Theta    Phi  PeakCts   SNR AngSep     Name
#  [deg]    [deg]    ['] [deg]  [deg]                   [']
  6.7091 -17.1099    2.0  46.9  142.3   0.8963   5.7 ------	UNKNOWN
347.6495 -14.7348    2.2  53.3  165.0   0.9965   5.3 ------	UNKNOWN
354.3098  53.4458    1.7  32.3  -86.3   0.5139   6.8 ------	UNKNOWN
331.7255  24.6982    2.1  43.9 -138.7   0.4994   5.4 ------	UNKNOWN
Post-slew image of 15-350 keV band
Time interval of the image:
539.360610 963.002000

# RAcent  DECcent POSerr Theta    Phi  PeakCts   SNR AngSep     Name
#  [deg]    [deg]    ['] [deg]  [deg]                   [']
106.1462  30.0320    2.8  45.6   49.0   5.9717   4.2 ------	UNKNOWN
277.7578  79.8317    3.4  49.0  151.6   5.9567   3.4 ------	UNKNOWN
127.6900  35.6323    2.3  27.6   39.3   2.5256   5.1 ------	UNKNOWN
238.9970  46.2336    2.3  51.2 -160.5   6.0284   5.0 ------	UNKNOWN
161.9930  -6.3755    2.5  52.5  -40.8   8.4400   4.6 ------	UNKNOWN