Analysis Summary
Notes:
- 1) No attempt has been made to eliminate the non-significant decimal places.
- 2) This batgrbproduct analysis is done using the HEASARC data.
- 3) This batgrbproduct analysis is using the flight position for the mask-weighting calculation.
======================================================================
BAT GRB EVENT DATA PROCESSING REPORT
Process Script Ver: batgrbproduct v2.48
Process Start Time: Sat Jul 30 01:10:54 EDT 2022
Host Name: batproc1
Current Working Dir: /local/data/bat1/alien/Swift_3rdBATcatalog/event/batevent_reproc/trigger1000613
======================================================================
Trigger: 01000613 Segment: 000
BAT Trigger Time: 624620817.088 [s; MET]
Trigger Stop: 624620819.136 [s; MET]
UTC: 2020-10-17T09:46:31.267800 [includes UTCF correction]
Where From?: TDRSS position message
BAT
RA: 36.6334750470493 Dec: 66.6727003365269 [deg; J2000]
Catalogged Source?: NO
Point Source?: YES
GRB Indicated?: YES [ by BAT flight software ]
Image S/N Ratio: 7.33
Image Trigger?: NO
Rate S/N Ratio: 13.9283882771841 [ if not an image trigger ]
Image S/N Ratio: 7.33
Analysis Position: [ source = BAT ]
RA: 36.6334750470493 Dec: 66.6727003365269 [deg; J2000]
Refined Position: [ source = BAT pre-slew burst ]
RA: 36.6021095137194 Dec: 66.6707421185928 [deg; J2000]
{ 02h 26m 24.5s , +66d 40' 14.7" }
+/- 2.27364055643405 [arcmin] (estimated 90% radius based on SNR)
+/- 1.16885987910631 [arcmin] (formal 1-sigma fit error)
SNR: 9.40840053449997
Angular difference between the analysis and refined position is 0.754448 arcmin
Partial Coding Fraction: 0.3789062 [ including projection effects ]
Duration
T90: 22.0800000429153 +/- 6.25242363875111
Measured from: -2.28800010681152
to: 19.7919999361038 [s; relative to TRIGTIME]
T50: 9.4559999704361 +/- 4.88010503176866
Measured from: -0.432000041007996
to: 9.0239999294281 [s; relative to TRIGTIME]
Fluence
Peak Flux (peak 1 second)
Measured from: 0.867999911308289
to: 1.86799991130829 [s; relative to TRIGTIME]
Total Fluence
Measured from: -2.76800000667572
to: 23.8719999790192 [s; relative to TRIGTIME]
Band 1 Band 2 Band 3 Band 4
15-25 25-50 50-100 100-350 keV
Total 0.319378 0.499730 0.404992 0.150167
0.068774 0.070942 0.061082 0.052261 [error]
Peak 0.048818 0.086839 0.048016 0.019325
0.014638 0.015208 0.013333 0.011184 [error]
[ fluence units of on-axis counts / fully illuminated detector ]
======================================================================
====== Table of the duration information =============================
Value tstart tstop
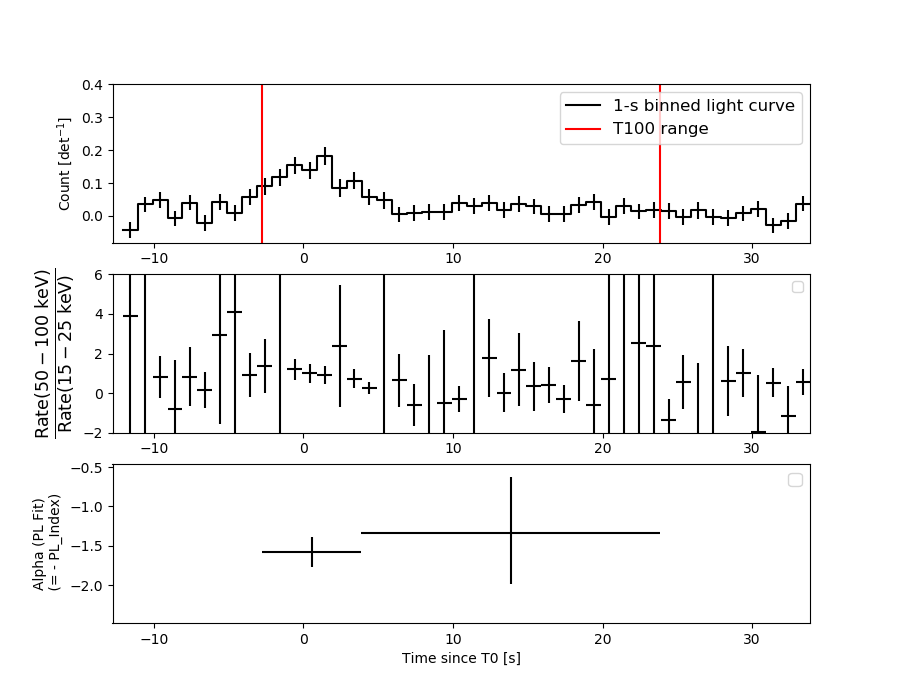
T100 26.640 -2.768 23.872
T90 22.080 -2.288 19.792
T50 9.456 -0.432 9.024
Peak 1.000 0.868 1.868
====== Spectral Analysis Summary =====================================
Model : spectral model: simple power-law (PL) and cutoff power-law (CPL)
Ph_index : photon index: E^{Ph_index}
Ph_90err : 90% error of the photon index
Epeak : Epeak in keV
Epeak_90err: 90% error of Epeak
Norm : normalization at 50 keV in both the PL model and CPL model
Nomr_90err : 90% error of the normalization
chi2 : Chi-Squared
dof : degree of freedo
=== Time-averaged spectral analysis ===
(Best model with acceptable fit: N/A)
Model Ph_index Ph_90err_low Ph_90err_hi Epeak Epeak_90err_low Epeak_90err_hi Norm Nomr_90err_low Norm_90err_hi chi2 dof
PL -1.484 -0.246 0.247 - - - 3.58e-03 -5.27e-04 5.26e-04 40.430 57
CPL -0.921 -0.754 1.286 95.895 -38.330 -95.895 6.91e-03 -3.75e-03 2.35e-02 39.530 56
=== 1-s peak spectral analysis ===
(Best model with acceptable fit: N/A)
Model Ph_index Ph_90err_low Ph_90err_hi Epeak Epeak_90err_low Epeak_90err_hi Norm Nomr_90err_low Norm_90err_hi chi2 dof
PL -1.666 -0.358 0.342 - - - 1.34e-02 -3.04e-03 2.99e-03 61.410 57
CPL -0.189 -1.690 3.289 56.319 -11.134 -56.319 8.37e-02 -8.37e-02 4.74e+00 59.550 56
=== Fluence/Peak Flux Summary ===
Model Band1 Band2 Band3 Band4 Band5 Total
15-25 25-50 50-100 100-350 15-150 15-350 keV
Fluence PL 1.20e-07 2.22e-07 3.18e-07 9.62e-07 9.06e-07 1.62e-06 erg/cm2
90%_error_low -2.93e-08 -3.52e-08 -5.84e-08 -3.27e-07 -1.43e-07 -3.81e-07 erg/cm2
90%_error_hi 3.12e-08 3.47e-08 5.78e-08 4.25e-07 1.44e-07 4.57e-07 erg/cm2
Peak flux PL 6.48e-01 5.91e-01 3.73e-01 3.60e-01 1.76e+00 1.97e+00 ph/cm2/s
90%_error_low -2.06e-01 -1.30e-01 -1.05e-01 -1.65e-01 -3.80e-01 -4.20e-01 ph/cm2/s
90%_error_hi 2.23e-01 1.29e-01 1.04e-01 2.27e-01 3.81e-01 4.22e-01 ph/cm2/s
Fluence CPL 1.09e-07 2.36e-07 3.30e-07 4.39e-07 8.73e-07 1.12e-06 erg/cm2
90%_error_low -3.48e-08 -4.29e-08 -6.41e-08 -3.19e-07 -1.59e-07 -3.58e-07 erg/cm2
90%_error_hi 3.60e-08 4.58e-08 6.61e-08 6.39e-07 1.57e-07 6.75e-07 erg/cm2
Peak flux CPL 5.26e-01 6.91e-01 3.95e-01 8.56e-02 1.68e+00 1.70e+00 ph/cm2/s
90%_error_low -2.68e-01 -1.80e-01 -1.39e-01 -8.56e-02 -4.06e-01 -4.20e-01 ph/cm2/s
90%_error_hi 2.70e-01 1.98e-01 1.28e-01 3.44e-01 3.99e-01 5.09e-01 ph/cm2/s
======================================================================
Image
Pre-slew 15.0-350.0 keV image (Event data)
#   RAcent    DECcent   POSerr    Theta     Phi              Peak Cts       SNR   Name
   36.6021    66.6707   0.0203    41.9154   170.3374         1.2993607      9.408 TRIG_01000613

Foreground time interval of the image:
 -2.768  23.872 (delta_t =  26.640 [sec])
Background time interval of the image:
-239.088  -2.768 (delta_t = 236.320 [sec])
Light Curves
Note: The mask-weighted lightcurves have units of either count/det or counts/sec/det, where a det is 0.4 x 0.4 = 0.16 sq cm.
Full-time range; 1 s binning
Other quick-look light curves:
- 64 ms binning (zoomed)
- 16 ms binning (zoomed)
- 8 ms binning (zoomed)
- 2 ms binning (zoomed)
- SN=5 or 10 s binning (full-time range)
- Raw light curve
Spectra
- 64 ms binning (zoomed)
- 16 ms binning (zoomed)
- 8 ms binning (zoomed)
- 2 ms binning (zoomed)
- SN=5 or 10 s binning (full-time range)
- Raw light curve
Spectra
Notes:
- 1) The fitting includes the systematic errors.
- 2) When the burst includes telescope slew time periods, the fitting uses an average response file made from multiple 5-s response files through out the slew time plus single time preiod for the non-slew times, and weighted by the total counts in the corresponding time period using addrmf. An average response file is needed becuase a spectral fit using the pre-slew DRM will introduce some errors in both a spectral shape and a normalization if the PHA file contains a lot of the slew/post-slew time interval.
- 3) For fits to more complicated models (e.g. a power-law over a cutoff power-law), the BAT team has decided to require a chi-square improvement of more than 6 for each extra dof.
Time averaged spectrum fit using the average DRM
Power-law model
Time interval is from   -2.768 sec. to   23.872 sec.

Spectral model in power-law:
------------------------------------------------------------
Parameters  : value       lower 90%   higher 90%
Photon index: -1.48355     ( -0.246246   0.246728 )
Norm@50keV  : 3.57583E-03    ( -0.000527377   0.000525867 )
------------------------------------------------------------
#Fit statistic  : Chi-Squared                   40.43     using 59 bins.
 Reduced chi-squared = 0.709298
# Null hypothesis probability of 9.53e-01 with 57 degrees of freedom

Photon flux (15-150 keV)    in 26.64 sec: 0.444471 ( -0.06738  0.067621 ) ph/cm2/s
Energy fluence (15-150 keV)             : 9.06285e-07 ( -1.43004e-07  1.44162e-07 ) ergs/cm2
Cutoff power-law model
Time interval is from   -2.768 sec. to   23.872 sec.
Spectral model in the cutoff power-law:
------------------------------------------------------------
Parameters  : value       lower 90%   higher 90%
Photon index: -0.920801     ( -0.753416   1.28655 )
Epeak [keV] : 95.8954      ( -38.3595 -95.9249 )
Norm@50keV  : 6.91033E-03    ( -0.00375115   0.0234671 )
------------------------------------------------------------
#Fit statistic  : Chi-Squared                   39.53     using 59 bins.
 Reduced chi-squared = 0.705893
# Null hypothesis probability of 9.53e-01 with 56 degrees of freedom

Photon flux (15-150 keV)    in 26.64 sec: 0.435409 ( -0.069693  0.0696 ) ph/cm2/s
Energy fluence (15-150 keV)             : 8.727e-07 ( -1.58739e-07  1.56629e-07 ) ergs/cm2
1-s peak spectrum fit
Power-law model
Time interval is from    0.868 sec. to    1.868 sec.

Spectral model in power-law:
------------------------------------------------------------
Parameters  : value       lower 90%   higher 90%
Photon index: -1.66578     ( -0.357869   0.342401 )
Norm@50keV  : 1.34234E-02    ( -0.00304333   0.0029909 )
------------------------------------------------------------
#Fit statistic  : Chi-Squared                   61.41     using 59 bins.
 Reduced chi-squared = 1.07737
# Null hypothesis probability of 3.21e-01 with 57 degrees of freedom

Photon flux (15-150 keV)    in 1 sec: 1.76207 ( -0.38008  0.38098 ) ph/cm2/s
Energy fluence (15-150 keV)             : 1.24669e-07 ( -2.92093e-08  2.9668e-08 ) ergs/cm2
Cutoff power-law model
Time interval is from    0.868 sec. to    1.868 sec.
Spectral model in the cutoff power-law:
------------------------------------------------------------
Parameters  : value       lower 90%   higher 90%
Photon index: -0.189064     ( -1.70598   3.2731 )
Epeak [keV] : 56.3185      ( -10.9124 -56.0966 )
Norm@50keV  : 8.36988E-02    ( -0.086747   4.73456 )
------------------------------------------------------------
#Fit statistic  : Chi-Squared                   59.55     using 59 bins.
 Reduced chi-squared = 1.06339
# Null hypothesis probability of 3.48e-01 with 56 degrees of freedom

Photon flux (15-150 keV)    in 1 sec: 1.68166 ( -0.40579  0.39888 ) ph/cm2/s
Energy fluence (15-150 keV)             : 8.81008e-08 ( -3.86333e-08  2.33312e-08 ) ergs/cm2
Time-resolved spectra
Distribution
T90 vs. Hardness ratio plot
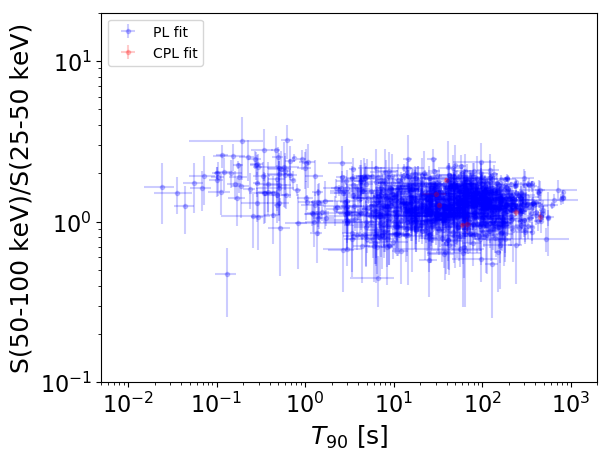
T90                                   = N/A sec.
Hardness ratio (energy fluence ratio) = N/A
S(15-50 keV) vs. S(50-150 keV) plot
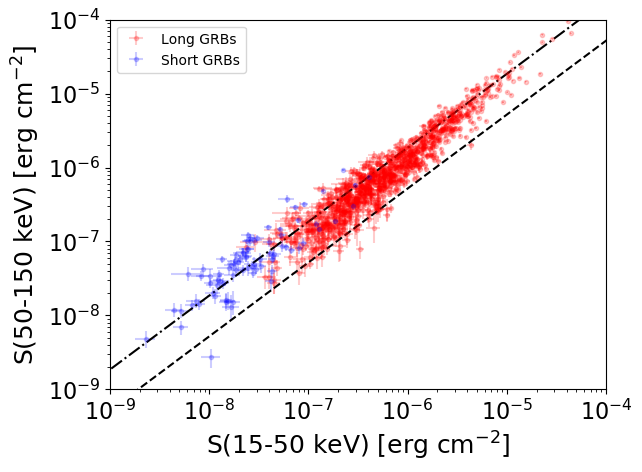
S(15-50 keV)  = N/A
S(50-150 keV) = N/A
The dash-dotted line and the dashed line traces the fluences calculated from the Band function with Epeak = 15 and 150 keV, respectively. Both lines assume a canonical values of alpha = -1 and beta = -2.5.
Mask shadow pattern
IMX = -8.849975337905884E-01, IMY = -1.506806050536204E-01
Spacecraft aspect plot
Bright source in the pre-burst/pre-slew/post-slew images
Pre-burst image of 15-350 keV band
Time interval of the image:
-239.088000 -2.768000

# RAcent  DECcent POSerr Theta    Phi  PeakCts   SNR AngSep     Name
#  [deg]    [deg]    ['] [deg]  [deg]                   [']
 83.6425  22.0059    0.4  12.2   10.6   9.0684  28.4    0.7	Crab
 53.0540   3.8135    2.4  40.9   64.1   5.6578   4.8 ------	UNKNOWN
 76.3976  -9.6393    3.3  44.2   24.2   1.9405   3.5 ------	UNKNOWN
 75.3891  11.6581    2.2  23.5   33.3   1.8169   5.3 ------	UNKNOWN
103.0833  -9.6081    2.6  48.0  -12.3   2.6481   4.5 ------	UNKNOWN
132.9999  36.0478    3.0  40.9  -92.0   5.5266   3.9 ------	UNKNOWN
146.2888  61.3334    2.7  48.0 -129.1   5.7371   4.2 ------	UNKNOWN
Pre-slew background subtracted image of 15-350 keV band
Time interval of the image:
-2.768000 23.872000

# RAcent  DECcent POSerr Theta    Phi  PeakCts   SNR AngSep     Name
#  [deg]    [deg]    ['] [deg]  [deg]                   [']
 83.8285  21.9071    0.0  12.4    9.8  -0.1553  -2.1   12.6	Crab
 36.6020  66.6707    1.2  41.9  170.3   1.2996   9.4 ------	UNKNOWN
135.2232  42.7403    2.3  41.5 -102.5   1.4355   5.1 ------	UNKNOWN
Post-slew image of 15-350 keV band
Time interval of the image:
87.812590 683.512610

# RAcent  DECcent POSerr Theta    Phi  PeakCts   SNR AngSep     Name
#  [deg]    [deg]    ['] [deg]  [deg]                   [']
 83.6119  21.9961    1.4  53.5   16.5  20.0587   8.1    1.6	Crab
308.1847  40.9475    6.8  52.4 -178.4  -3.8866  -1.7    3.4	Cyg X-3
325.9663  38.3318   74.7  47.8  164.4  -0.3052  -0.2    9.7	Cyg X-2
160.5749  67.6818    3.3  40.0  -76.8   8.2271   3.5 ------	UNKNOWN