Analysis Summary
Notes:
- 1) No attempt has been made to eliminate the non-significant decimal places.
- 2) This batgrbproduct analysis is done using the HEASARC data.
- 3) This batgrbproduct analysis is using the flight position for the mask-weighting calculation.
======================================================================
BAT GRB EVENT DATA PROCESSING REPORT
Process Script Ver: batgrbproduct v2.48
Process Start Time: Sat Jul 30 01:08:53 EDT 2022
Host Name: batproc1
Current Working Dir: /local/data/bat1/alien/Swift_3rdBATcatalog/event/batevent_reproc/trigger1000926
======================================================================
Trigger: 01000926 Segment: 000
BAT Trigger Time: 624865672 [s; MET]
Trigger Stop: 624865736 [s; MET]
UTC: 2020-10-20T05:47:26.163700 [includes UTCF correction]
Where From?: TDRSS position message
BAT
RA: 261.246012461438 Dec: 31.4249402594 [deg; J2000]
Catalogged Source?: NO
Point Source?: YES
GRB Indicated?: YES [ by BAT flight software ]
Image S/N Ratio: 12.2
Image Trigger?: YES
Rate S/N Ratio: 0 [ if not an image trigger ]
Image S/N Ratio: 12.2
Analysis Position: [ source = BAT ]
RA: 261.246012461438 Dec: 31.4249402594 [deg; J2000]
Refined Position: [ source = BAT pre-slew burst ]
RA: 261.239624507865 Dec: 31.427961223256 [deg; J2000]
{ 17h 24m 57.5s , +31d 25' 40.7" }
+/- 1.136074977336 [arcmin] (estimated 90% radius based on SNR)
+/- 0.380068937613371 [arcmin] (formal 1-sigma fit error)
SNR: 25.3492743017725
Angular difference between the analysis and refined position is 0.373924 arcmin
Partial Coding Fraction: 0.90625 [ including projection effects ]
Duration
T90: 14.3600000143051 +/- 4.7507310775274
Measured from: 11.1799999475479
to: 25.539999961853 [s; relative to TRIGTIME]
T50: 5.14399993419647 +/- 0.667892212469055
Measured from: 14.7039999961853
to: 19.8479999303818 [s; relative to TRIGTIME]
Fluence
Peak Flux (peak 1 second)
Measured from: 17.1720000505447
to: 18.1720000505447 [s; relative to TRIGTIME]
Total Fluence
Measured from: 7.85599994659424
to: 30.1720000505447 [s; relative to TRIGTIME]
Band 1 Band 2 Band 3 Band 4
15-25 25-50 50-100 100-350 keV
Total 0.791954 0.702471 0.327368 0.019252
0.043223 0.039924 0.032656 0.026855 [error]
Peak 0.083312 0.097361 0.057407 0.008153
0.009845 0.009728 0.007860 0.005782 [error]
[ fluence units of on-axis counts / fully illuminated detector ]
======================================================================
====== Table of the duration information =============================
Value tstart tstop
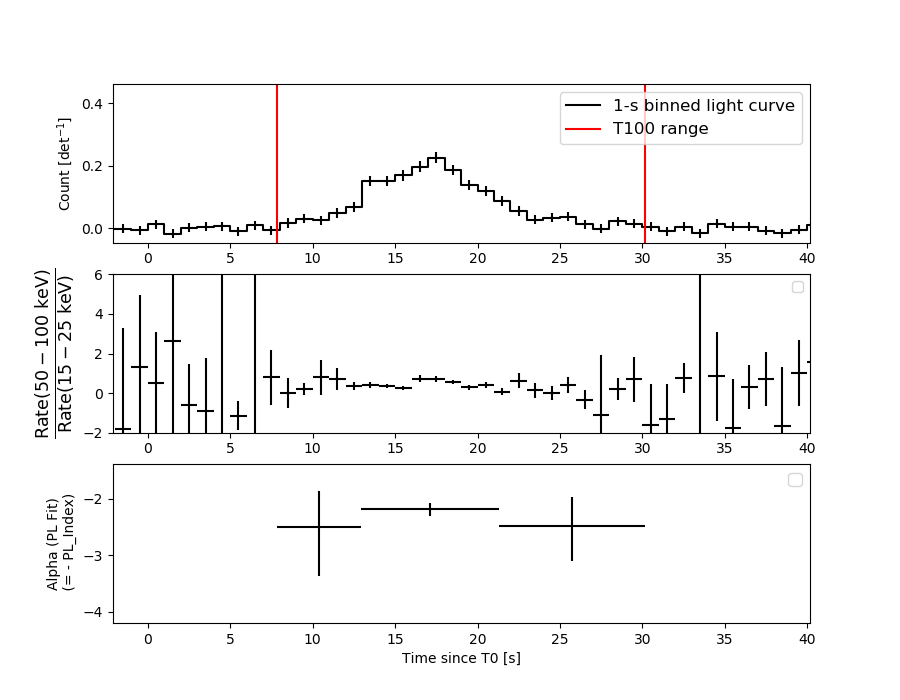
T100 22.316 7.856 30.172
T90 14.360 11.180 25.540
T50 5.144 14.704 19.848
Peak 1.000 17.172 18.172
====== Spectral Analysis Summary =====================================
Model : spectral model: simple power-law (PL) and cutoff power-law (CPL)
Ph_index : photon index: E^{Ph_index}
Ph_90err : 90% error of the photon index
Epeak : Epeak in keV
Epeak_90err: 90% error of Epeak
Norm : normalization at 50 keV in both the PL model and CPL model
Nomr_90err : 90% error of the normalization
chi2 : Chi-Squared
dof : degree of freedo
=== Time-averaged spectral analysis ===
(Best model with acceptable fit: N/A)
Model Ph_index Ph_90err_low Ph_90err_hi Epeak Epeak_90err_low Epeak_90err_hi Norm Nomr_90err_low Norm_90err_hi chi2 dof
PL -2.263 -0.143 0.138 - - - 4.35e-03 -3.96e-04 3.90e-04 45.340 57
CPL -2.256 -0.152 0.131 9999.360 N/A N/A 4.36e-03 N/A N/A 45.350 56
=== 1-s peak spectral analysis ===
(Best model with acceptable fit: N/A)
Model Ph_index Ph_90err_low Ph_90err_hi Epeak Epeak_90err_low Epeak_90err_hi Norm Nomr_90err_low Norm_90err_hi chi2 dof
PL -1.937 -0.199 0.190 - - - 1.45e-02 -1.92e-03 1.89e-03 47.140 57
CPL -1.099 -0.828 1.017 46.084 -16.283 92.818 4.36e-02 -4.36e-02 1.23e-01 44.160 56
=== Fluence/Peak Flux Summary ===
Model Band1 Band2 Band3 Band4 Band5 Total
15-25 25-50 50-100 100-350 15-150 15-350 keV
Fluence PL 2.55e-07 2.95e-07 2.46e-07 3.46e-07 9.21e-07 1.14e-06 erg/cm2
90%_error_low -2.50e-08 -2.00e-08 -3.09e-08 -7.92e-08 -7.01e-08 -1.17e-07 erg/cm2
90%_error_hi 2.55e-08 2.00e-08 3.16e-08 9.42e-08 7.10e-08 1.27e-07 erg/cm2
Peak flux PL 9.11e-01 7.08e-01 3.70e-01 2.79e-01 2.12e+00 2.27e+00 ph/cm2/s
90%_error_low -1.45e-01 -7.88e-02 -6.28e-02 -8.13e-02 -2.37e-01 -2.53e-01 ph/cm2/s
90%_error_hi 1.50e-01 7.88e-02 6.31e-02 9.87e-02 2.38e-01 2.53e-01 ph/cm2/s
Fluence CPL 2.41e-07 2.84e-07 2.42e-07 2.05e-07 8.95e-07 1.00e-06 erg/cm2
90%_error_low -1.85e-08 -1.20e-08 -3.42e-08 -8.23e-08 -4.09e-08 -1.41e-07 erg/cm2
90%_error_hi 1.38e-08 5.29e-08 3.40e-08 1.35e-07 7.81e-08 3.30e-07 erg/cm2
Peak flux CPL 8.36e-01 7.82e-01 3.72e-01 1.03e-01 2.07e+00 2.09e+00 ph/cm2/s
90%_error_low -1.66e-01 -1.07e-01 -7.47e-02 N/A -2.43e-01 -2.57e-01 ph/cm2/s
90%_error_hi 1.68e-01 1.11e-01 7.16e-02 N/A 2.43e-01 2.76e-01 ph/cm2/s
======================================================================
Image
Pre-slew 15.0-350.0 keV image (Event data)
#   RAcent    DECcent   POSerr    Theta     Phi              Peak Cts       SNR   Name
  261.2396    31.4280   0.0076    26.2682     1.4715         1.9500141     25.349 TRIG_01000926

Foreground time interval of the image:
  7.856  30.172 (delta_t =  22.316 [sec])
Background time interval of the image:
-239.000   7.856 (delta_t = 246.856 [sec])
Light Curves
Note: The mask-weighted lightcurves have units of either count/det or counts/sec/det, where a det is 0.4 x 0.4 = 0.16 sq cm.
Full-time range; 1 s binning
Other quick-look light curves:
- 64 ms binning (zoomed)
- 16 ms binning (zoomed)
- 8 ms binning (zoomed)
- 2 ms binning (zoomed)
- SN=5 or 10 s binning (full-time range)
- Raw light curve
Spectra
- 64 ms binning (zoomed)
- 16 ms binning (zoomed)
- 8 ms binning (zoomed)
- 2 ms binning (zoomed)
- SN=5 or 10 s binning (full-time range)
- Raw light curve
Spectra
Notes:
- 1) The fitting includes the systematic errors.
- 2) When the burst includes telescope slew time periods, the fitting uses an average response file made from multiple 5-s response files through out the slew time plus single time preiod for the non-slew times, and weighted by the total counts in the corresponding time period using addrmf. An average response file is needed becuase a spectral fit using the pre-slew DRM will introduce some errors in both a spectral shape and a normalization if the PHA file contains a lot of the slew/post-slew time interval.
- 3) For fits to more complicated models (e.g. a power-law over a cutoff power-law), the BAT team has decided to require a chi-square improvement of more than 6 for each extra dof.
Time averaged spectrum fit using the average DRM
Power-law model

Time interval is from    7.856 sec. to   30.172 sec.

Spectral model in power-law:
------------------------------------------------------------
Parameters  : value       lower 90%   higher 90%
Photon index: -2.26288     ( -0.143187   0.137806 )
Norm@50keV  : 4.34678E-03    ( -0.000396484   0.000390026 )
------------------------------------------------------------
#Fit statistic  : Chi-Squared                   45.34     using 59 bins.
 Reduced chi-squared = 0.795439
# Null hypothesis probability of 8.67e-01 with 57 degrees of freedom

Photon flux (15-150 keV)    in 22.32 sec: 0.744348 ( -0.051163  0.051245 ) ph/cm2/s
Energy fluence (15-150 keV)             : 9.21285e-07 ( -7.00993e-08  7.0995e-08 ) ergs/cm2
Cutoff power-law model
Time interval is from    7.856 sec. to   30.172 sec.
Spectral model in the cutoff power-law:
------------------------------------------------------------
Parameters  : value       lower 90%   higher 90%
Photon index: -2.2565     ( -0.149494   0.133409 )
Epeak [keV] : 9999.36      (   )
Norm@50keV  : 4.36421E-03    (     )
------------------------------------------------------------
#Fit statistic  : Chi-Squared                   45.35     using 59 bins.
 Reduced chi-squared = 0.809821
# Null hypothesis probability of 8.45e-01 with 56 degrees of freedom

Photon flux (15-150 keV)    in 22.32 sec: 0.743830 ( -0.05078  0.052038 ) ph/cm2/s
Energy fluence (15-150 keV)             : 8.9494e-07 ( -4.0928e-08  7.81298e-08 ) ergs/cm2
1-s peak spectrum fit
Power-law model
Time interval is from   17.172 sec. to   18.172 sec.

Spectral model in power-law:
------------------------------------------------------------
Parameters  : value       lower 90%   higher 90%
Photon index: -1.93738     ( -0.199356   0.189744 )
Norm@50keV  : 1.45147E-02    ( -0.00192357   0.00188545 )
------------------------------------------------------------
#Fit statistic  : Chi-Squared                   47.14     using 59 bins.
 Reduced chi-squared = 0.827018
# Null hypothesis probability of 8.21e-01 with 57 degrees of freedom

Photon flux (15-150 keV)    in 1 sec: 2.11700 ( -0.23739  0.23754 ) ph/cm2/s
Energy fluence (15-150 keV)             : 1.33552e-07 ( -1.70455e-08  1.72718e-08 ) ergs/cm2
Cutoff power-law model
Time interval is from   17.172 sec. to   18.172 sec.
Spectral model in the cutoff power-law:
------------------------------------------------------------
Parameters  : value       lower 90%   higher 90%
Photon index: -1.0987     ( -0.827825   1.01695 )
Epeak [keV] : 46.0839      ( -16.2829 92.8179 )
Norm@50keV  : 4.35937E-02    ( -0.0435942   0.123275 )
------------------------------------------------------------
#Fit statistic  : Chi-Squared                   44.16     using 59 bins.
 Reduced chi-squared = 0.788571
# Null hypothesis probability of 8.74e-01 with 56 degrees of freedom

Photon flux (15-150 keV)    in 1 sec: 2.06561 ( -0.24285  0.24302 ) ph/cm2/s
Energy fluence (15-150 keV)             : 1.24733e-07 ( -1.84142e-08  1.91999e-08 ) ergs/cm2
Time-resolved spectra
Distribution
T90 vs. Hardness ratio plot
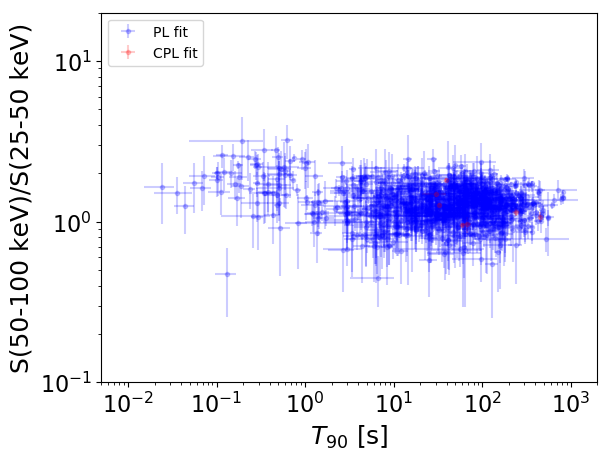
T90                                   = N/A sec.
Hardness ratio (energy fluence ratio) = N/A
S(15-50 keV) vs. S(50-150 keV) plot
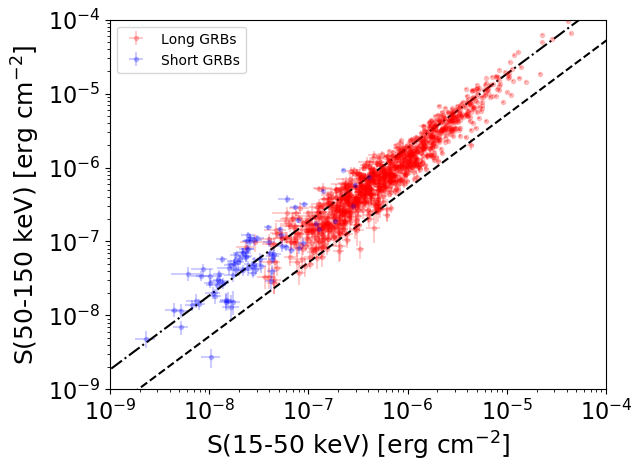
S(15-50 keV)  = N/A
S(50-150 keV) = N/A
The dash-dotted line and the dashed line traces the fluences calculated from the Band function with Epeak = 15 and 150 keV, respectively. Both lines assume a canonical values of alpha = -1 and beta = -2.5.
Mask shadow pattern
IMX = 4.933771844710977E-01, IMY = -1.267426044624128E-02
Spacecraft aspect plot
Bright source in the pre-burst/pre-slew/post-slew images
Pre-burst image of 15-350 keV band
Time interval of the image:
-239.000000 7.856000

# RAcent  DECcent POSerr Theta    Phi  PeakCts   SNR AngSep     Name
#  [deg]    [deg]    ['] [deg]  [deg]                   [']
244.9888 -15.6477    0.4  29.1 -127.4  11.6295  29.0    0.7	Sco X-1
254.4901  35.4052    2.6  31.6   -7.7   1.6802   4.5    4.1	Her X-1
255.9339 -37.9878    4.9  44.3 -160.2   1.4817   2.4    9.0	4U 1700-377
256.4909 -36.5678   17.1  42.8 -160.3   0.3819   0.7    9.1	GX 349+2
263.0174 -24.6947    3.3  30.2 -166.7   1.2651   3.5    3.1	GX 1+4
264.7412 -44.3006   13.2  49.7 -170.2  -0.7150  -0.9    9.0	4U 1735-44
268.4916  -1.4160    4.5   7.6  164.0  -0.7631  -2.6    7.7	SW J1753.5-0127
270.3096 -25.0775    5.9  30.9 -179.6   0.8350   2.0    1.4	GX 5-1
270.4125 -25.5729    0.0  31.4 -179.6   1.1199   2.6   11.8	GRS 1758-258
274.1126 -14.0573    3.4  21.4  165.1   1.0871   3.4    6.3	GX 17+2
275.9368 -30.3573   42.3  37.2  174.0   0.1446   0.3    0.8	H1820-303
284.9727 -24.7849    6.6  35.8  157.7   0.9792   1.8    8.8	HT1900.1-2455
288.6534  10.9266    6.9  23.8   84.4  -0.8552  -1.7    8.6	GRS 1915+105
299.7536  35.2307    9.3  43.5   51.4   1.6473   1.2    8.2	Cyg X-1
263.0128 -33.8544   18.6  39.3 -167.8   0.2863   0.6    1.7	GX 354-0
300.3235   1.0746    4.7  35.3  105.1   1.7781   2.5 ------	UNKNOWN
271.9198 -38.7183    2.9  44.6 -178.1   2.5330   4.0 ------	UNKNOWN
227.8449  -5.1900    3.1  38.9  -96.0   4.1027   3.7 ------	UNKNOWN
Pre-slew background subtracted image of 15-350 keV band
Time interval of the image:
7.856000 30.172000

# RAcent  DECcent POSerr Theta    Phi  PeakCts   SNR AngSep     Name
#  [deg]    [deg]    ['] [deg]  [deg]                   [']
244.9897 -15.7783    6.5  29.2 -127.6  -0.1671  -1.8    8.3	Sco X-1
254.5892  35.4556    5.5  31.6   -7.5   0.1812   2.1    9.4	Her X-1
256.0427 -37.6974    7.9  44.0 -160.2  -0.1860  -1.5    9.2	4U 1700-377
256.5206 -36.2747    4.1  42.5 -160.3  -0.3480  -2.8    9.8	GX 349+2
262.8781 -24.8199    5.1  30.3 -166.4   0.1880   2.3    8.4	GX 1+4
264.7871 -44.4567   15.8  49.9 -170.3   0.1394   0.7    1.9	4U 1735-44
268.4225  -1.5583    4.8   7.7  165.0   0.1602   2.4    7.1	SW J1753.5-0127
270.3430 -25.1421    3.4  31.0 -179.7   0.2917   3.4    4.9	GX 5-1
270.1783 -25.7737    7.6  31.6 -179.2  -0.1288  -1.5    7.0	GRS 1758-258
274.0288 -13.9612   16.9  21.3  165.2  -0.0508  -0.7    4.7	GX 17+2
275.7587 -30.2461    0.0  37.1  174.2   0.2213   2.2   11.3	H1820-303
285.1655 -24.9592    9.5  36.0  157.6   0.1375   1.2    7.4	HT1900.1-2455
288.8258  10.9035   64.6  23.9   84.6  -0.0179  -0.2    3.0	GRS 1915+105
299.6854  35.1572   13.0  43.4   51.5   0.2531   0.9    5.4	Cyg X-1
262.9238 -33.8410  740.4  39.3 -167.7  -0.0015  -0.0    3.3	GX 354-0
261.2396  31.4280    0.5  26.3    1.5   1.9499  25.3 ------	UNKNOWN
257.2076 -22.7391    2.1  29.3 -155.4   0.4328   5.5 ------	UNKNOWN
Post-slew image of 15-350 keV band
Time interval of the image:
125.500590 881.600600

# RAcent  DECcent POSerr Theta    Phi  PeakCts   SNR AngSep     Name
#  [deg]    [deg]    ['] [deg]  [deg]                   [']
254.4219  35.3029    2.1   6.9  -25.1   3.9434   5.5    2.9	Her X-1
263.0022 -24.6015   59.6  56.1 -153.2  -0.7078  -0.2    8.7	GX 1+4
268.4309  -1.4231    6.1  33.6 -164.4  -1.7149  -1.9    4.2	SW J1753.5-0127
270.4114 -25.0722    6.1  57.2 -161.2   6.9401   1.9    6.9	GX 5-1
274.1278 -14.1475   13.4  47.2 -168.5   1.4255   0.9    9.7	GX 17+2
288.9601  10.8542    0.0  32.9  151.3  -3.5188  -3.0   11.0	GRS 1915+105
299.6341  35.0777    5.6  32.1  101.6   2.5032   2.0    7.7	Cyg X-1
308.0183  40.8350   15.1  38.5   91.1   1.9690   0.8    8.2	Cyg X-3
302.6673  54.0923    3.2  37.1   68.7   5.7130   3.6 ------	UNKNOWN
264.8293  61.7577    4.2  30.4   32.1   2.7594   2.7 ------	UNKNOWN
252.5935  62.4135    3.5  31.5   21.1   3.0525   3.3 ------	UNKNOWN
197.3492  64.9079    3.6  50.8   -0.7   4.8729   3.2 ------	UNKNOWN
205.9114  27.3078    4.0  47.9  -51.4   9.8155   2.9 ------	UNKNOWN