Analysis Summary
Notes:
- 1) No attempt has been made to eliminate the non-significant decimal places.
- 2) This batgrbproduct analysis is done using the HEASARC data.
- 3) This batgrbproduct analysis is using the flight position for the mask-weighting calculation.
======================================================================
                  BAT GRB EVENT DATA PROCESSING REPORT
    Process Script Ver: batgrbproduct v2.48
    Process Start Time: Sat Jul 30 01:07:09 EDT 2022
             Host Name: batproc1
   Current Working Dir: /local/data/bat1/alien/Swift_3rdBATcatalog/event/batevent_reproc/trigger1001130
======================================================================

  Trigger: 01001130      Segment: 000

  BAT Trigger Time: 625004864.512   [s; MET]
      Trigger Stop: 625004868.608   [s; MET]
               UTC: 2020-10-21T20:27:18.666520    [includes UTCF correction]
       Where From?: TDRSS position message

  BAT
    RA: 12.549823305115   Dec: -55.8391953004332  [deg; J2000]

     Catalogged Source?: NO
     Point Source?:      YES
     GRB Indicated?:     YES    [ by BAT flight software ]
     Image S/N Ratio:    11.84
     Image Trigger?:     NO
     Rate S/N Ratio:     12.2882057274445  [ if not an image trigger ]
     Image S/N Ratio:    11.84

  Analysis Position:   [ source = BAT ]
    RA: 12.549823305115   Dec: -55.8391953004332  [deg; J2000]

  Refined Position:   [ source = BAT pre-slew burst ]
    RA: 12.5027063090947   Dec: -55.8622169282304  [deg; J2000]
        { 00h 50m 00.6s , -55d 51' 44.0" }
         +/- 1.33561878799544 [arcmin] (estimated 90% radius based on SNR)
         +/- 0.654015750808458 [arcmin] (formal 1-sigma fit error)
    SNR: 20.1174033452512

  Angular difference between the analysis and refined position is 2.103900 arcmin

  Partial Coding Fraction: 0.8046875    [ including projection effects ]

  Duration
     T90: 24.3839999437332 +/- 6.76097773129311
        Measured from: -3.12000000476837
                   to: 21.2639999389648     [s; relative to TRIGTIME]
     T50: 9.70799994468689 +/- 2.4339737203546
        Measured from: 1.1360000371933
                   to: 10.8439999818802     [s; relative to TRIGTIME]


  Fluence
     Peak Flux  (peak 1 second)
        Measured from: -3.62399995326996
                   to: -2.62399995326996     [s; relative to TRIGTIME]
     Total Fluence
        Measured from: -4.18799996376038
                   to: 27.9520000219345     [s; relative to TRIGTIME]

             Band 1     Band 2     Band 3     Band 4
              15-25      25-50     50-100    100-350     keV
 Total     0.522343   0.630853   0.466862   0.104708
           0.045453   0.047545   0.041327   0.035200 [error]
 Peak      0.042761   0.044248   0.030672   0.009365
           0.008366   0.008668   0.007357   0.006306 [error]

     [ fluence units of on-axis counts / fully illuminated detector ]

======================================================================


====== Table of the duration information =============================

        Value   tstart    tstop
T100   32.140   -4.188   27.952
T90    24.384   -3.120   21.264
T50     9.708    1.136   10.844
Peak    1.000   -3.624   -2.624


====== Spectral Analysis Summary =====================================

Model      : spectral model: simple power-law (PL) and cutoff power-law (CPL)
Ph_index   : photon index: E^{Ph_index}
Ph_90err   : 90% error of the photon index
Epeak      : Epeak in keV
Epeak_90err: 90% error of Epeak
Norm       : normalization at 50 keV in both the PL model and CPL model
Nomr_90err : 90% error of the normalization
chi2       : Chi-Squared
dof        : degree of freedo

=== Time-averaged spectral analysis ===
(Best model with acceptable fit: N/A)

Model Ph_index Ph_90err_low Ph_90err_hi  Epeak  Epeak_90err_low  Epeak_90err_hi  Norm       Nomr_90err_low    Norm_90err_hi    chi2    dof
PL      -1.626    -0.150      0.148       -           -               -         3.42e-03     -2.99e-04          2.96e-04      46.150   57
CPL     -1.550    -0.645      0.527      261.139    -261.139      -261.139      3.74e-03     -2.12e-03          3.12e-03      46.190   56


=== 1-s peak spectral analysis ===
(Best model with acceptable fit: N/A)

Model Ph_index Ph_90err_low Ph_90err_hi  Epeak  Epeak_90err_low  Epeak_90err_hi  Norm       Nomr_90err_low    Norm_90err_hi    chi2    dof
PL      -1.984     -0.386     0.347       -           -               -         6.57e-03     -1.75e-03          1.69e-03      55.220   57
CPL     -1.075     -1.052     1.712       41.941     -40.496       -41.941      2.25e-02     -2.25e-02          2.25e-01      53.780   56


=== Fluence/Peak Flux Summary ===

              Model    Band1     Band2     Band3     Band4     Band5     Total
                       15-25     25-50    50-100    100-350    15-150    15-350    keV
Fluence         PL   1.58e-07  2.69e-07  3.48e-07  9.12e-07  1.02e-06  1.69e-06   erg/cm2
      90%_error_low -2.11e-08 -2.24e-08 -4.09e-08 -2.07e-07 -9.57e-08 -2.45e-07   erg/cm2
      90%_error_hi   2.18e-08  2.24e-08  4.07e-08  2.46e-07  9.67e-08  2.75e-07   erg/cm2
Peak flux       PL   4.31e-01  3.27e-01  1.65e-01  1.20e-01  9.79e-01  1.04e+00   ph/cm2/s
      90%_error_low -1.17e-01 -6.79e-02 -5.50e-02 -6.13e-02 -2.02e-01 -2.19e-01   ph/cm2/s
      90%_error_hi   1.22e-01  6.77e-02  5.69e-02  9.00e-02  2.02e-01  2.20e-01   ph/cm2/s

Fluence        CPL   1.57e-07  2.70e-07  3.49e-07  8.54e-07  1.02e-06  1.55e-06   erg/cm2
      90%_error_low -2.43e-08 -2.35e-08 -3.97e-08 -4.86e-07 -1.06e-07 -4.24e-07   erg/cm2
      90%_error_hi   1.95e-08  2.75e-08  4.25e-08  1.12e-07  9.90e-08  2.05e-07   erg/cm2
Peak flux      CPL   4.02e-01  3.67e-01  1.63e-01  3.87e-02  9.63e-01  9.71e-01   ph/cm2/s
      90%_error_low -1.31e-01 -8.79e-02 -6.89e-02 -3.87e-02 -2.01e-01 -2.05e-01   ph/cm2/s
      90%_error_hi   1.31e-01  9.31e-02  6.49e-02  1.13e-01  2.02e-01  2.23e-01   ph/cm2/s

======================================================================
Image
Pre-slew 15.0-350.0 keV image (Event data)
#   RAcent    DECcent   POSerr    Theta     Phi              Peak Cts       SNR   Name
   12.5027   -55.8622   0.0095    29.1128    12.9936         1.8343177     20.117 TRIG_01001130

Foreground time interval of the image:
 -4.188  27.952 (delta_t =  32.140 [sec])
Background time interval of the image:
-239.512  -4.188 (delta_t = 235.324 [sec])
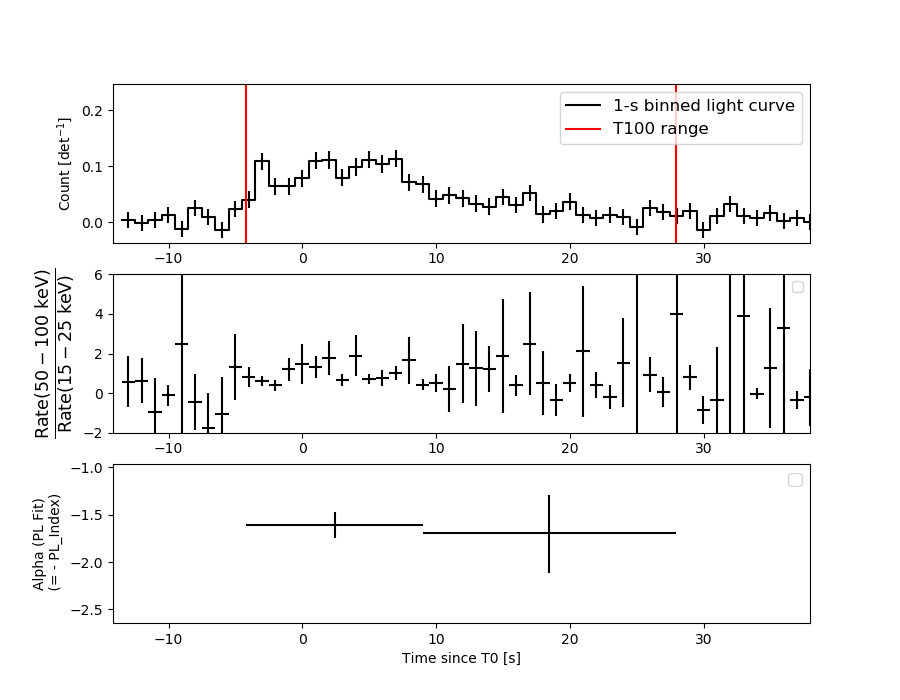
Light Curves
Note: The mask-weighted lightcurves have units of either count/det or counts/sec/det, where a det is 0.4 x 0.4 = 0.16 sq cm.
Full-time range; 1 s binning
Other quick-look light curves:
- 64 ms binning (zoomed)
- 16 ms binning (zoomed)
- 8 ms binning (zoomed)
- 2 ms binning (zoomed)
- SN=5 or 10 s binning (full-time range)
- Raw light curve
Spectra
- 64 ms binning (zoomed)
- 16 ms binning (zoomed)
- 8 ms binning (zoomed)
- 2 ms binning (zoomed)
- SN=5 or 10 s binning (full-time range)
- Raw light curve
Spectra
Notes:
- 1) The fitting includes the systematic errors.
- 2) When the burst includes telescope slew time periods, the fitting uses an average response file made from multiple 5-s response files through out the slew time plus single time preiod for the non-slew times, and weighted by the total counts in the corresponding time period using addrmf. An average response file is needed becuase a spectral fit using the pre-slew DRM will introduce some errors in both a spectral shape and a normalization if the PHA file contains a lot of the slew/post-slew time interval.
- 3) For fits to more complicated models (e.g. a power-law over a cutoff power-law), the BAT team has decided to require a chi-square improvement of more than 6 for each extra dof.
Time averaged spectrum fit using the average DRM
Power-law model
Time interval is from   -4.188 sec. to   27.952 sec.

Spectral model in power-law:
------------------------------------------------------------
Parameters  : value       lower 90%   higher 90%
Photon index: -1.62583     ( -0.150283   0.147874 )
Norm@50keV  : 3.41855E-03    ( -0.000298831   0.000295852 )
------------------------------------------------------------
#Fit statistic  : Chi-Squared                   46.15     using 59 bins.
 Reduced chi-squared = 0.809649
# Null hypothesis probability of 8.48e-01 with 57 degrees of freedom

Photon flux (15-150 keV)    in 32.14 sec: 0.442903 ( -0.03676  0.036812 ) ph/cm2/s
Energy fluence (15-150 keV)             : 1.0246e-06 ( -9.56891e-08  9.67067e-08 ) ergs/cm2
Cutoff power-law model

Time interval is from   -4.188 sec. to   27.952 sec.
Spectral model in the cutoff power-law:
------------------------------------------------------------
Parameters  : value       lower 90%   higher 90%
Photon index: -1.55024     ( -0.629536   0.542977 )
Epeak [keV] : 261.139      ( -390.827 -390.827 )
Norm@50keV  : 3.73832E-03    ( -0.00198731   0.00324655 )
------------------------------------------------------------
#Fit statistic  : Chi-Squared                   46.19     using 59 bins.
 Reduced chi-squared = 0.824821
# Null hypothesis probability of 8.22e-01 with 56 degrees of freedom

Photon flux (15-150 keV)    in 32.14 sec: 0.442135 ( -0.038142  0.037418 ) ph/cm2/s
Energy fluence (15-150 keV)             : 1.02133e-06 ( -1.05539e-07  9.89751e-08 ) ergs/cm2
1-s peak spectrum fit
Power-law model
Time interval is from   -3.624 sec. to   -2.624 sec.

Spectral model in power-law:
------------------------------------------------------------
Parameters  : value       lower 90%   higher 90%
Photon index: -1.98377     ( -0.38614   0.346917 )
Norm@50keV  : 6.57166E-03    ( -0.0017547   0.00169303 )
------------------------------------------------------------
#Fit statistic  : Chi-Squared                   55.22     using 59 bins.
 Reduced chi-squared = 0.968772
# Null hypothesis probability of 5.42e-01 with 57 degrees of freedom

Photon flux (15-150 keV)    in 1 sec: 0.978536 ( -0.201858  0.201854 ) ph/cm2/s
Energy fluence (15-150 keV)             : 6.05662e-08 ( -1.49468e-08  1.5505e-08 ) ergs/cm2
Cutoff power-law model
Time interval is from   -3.624 sec. to   -2.624 sec.
Spectral model in the cutoff power-law:
------------------------------------------------------------
Parameters  : value       lower 90%   higher 90%
Photon index: -1.07451     ( -1.05153   1.71231 )
Epeak [keV] : 41.9411      ( -40.497 -41.9421 )
Norm@50keV  : 2.25474E-02    ( -0.0225433   0.224852 )
------------------------------------------------------------
#Fit statistic  : Chi-Squared                   53.78     using 59 bins.
 Reduced chi-squared = 0.960357
# Null hypothesis probability of 5.59e-01 with 56 degrees of freedom

Photon flux (15-150 keV)    in 1 sec: 0.962681 ( -0.201233  0.202179 ) ph/cm2/s
Energy fluence (15-150 keV)             : 5.63417e-08 ( -1.48224e-08  1.63475e-08 ) ergs/cm2
Time-resolved spectra
Distribution
T90 vs. Hardness ratio plot
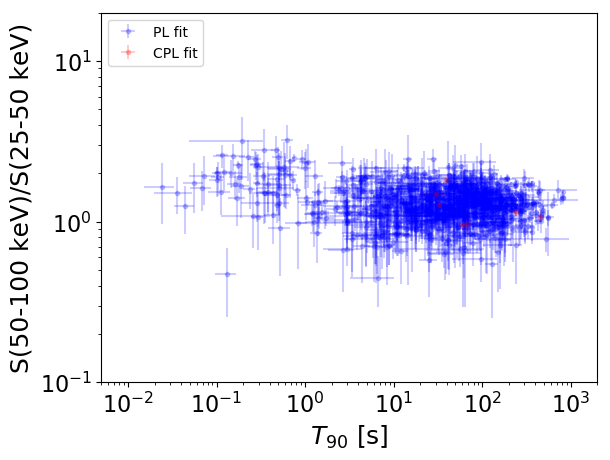
T90                                   = N/A sec.
Hardness ratio (energy fluence ratio) = N/A
S(15-50 keV) vs. S(50-150 keV) plot
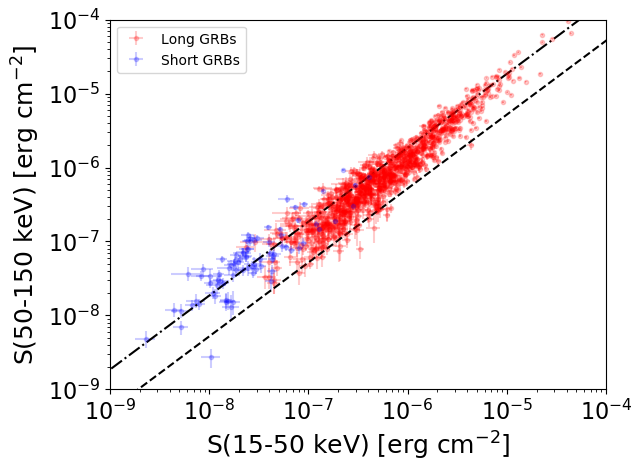
S(15-50 keV)  = N/A
S(50-150 keV) = N/A
The dash-dotted line and the dashed line traces the fluences calculated from the Band function with Epeak = 15 and 150 keV, respectively. Both lines assume a canonical values of alpha = -1 and beta = -2.5.
Mask shadow pattern
IMX = 5.426257485623531E-01, IMY = -1.252113140484960E-01
Spacecraft aspect plot
Bright source in the pre-burst/pre-slew/post-slew images
Pre-burst image of 15-350 keV band
Time interval of the image:
-239.512000 -4.188000

# RAcent  DECcent POSerr Theta    Phi  PeakCts   SNR AngSep     Name
#  [deg]    [deg]    ['] [deg]  [deg]                   [']
135.6163 -40.4993    6.3  47.4 -130.1   2.0289   1.8    5.2	Vela X-1
  0.0334 -52.3766    2.6  37.2   13.0   1.7400   4.5 ------	UNKNOWN
275.8011 -70.5796    3.9  52.6  -40.8   4.1478   2.9 ------	UNKNOWN
148.2935 -61.7937    3.7  41.2  -98.7   3.4608   3.2 ------	UNKNOWN
135.9069 -37.2959    2.8  49.8 -133.0   5.2639   4.1 ------	UNKNOWN
Pre-slew background subtracted image of 15-350 keV band
Time interval of the image:
-4.188000 27.952000

# RAcent  DECcent POSerr Theta    Phi  PeakCts   SNR AngSep     Name
#  [deg]    [deg]    ['] [deg]  [deg]                   [']
135.5457 -40.5341    9.5  47.4 -130.1  -0.4008  -1.2    1.5	Vela X-1
 28.8062 -24.4720    2.0  40.4   70.8   1.7599   5.6 ------	UNKNOWN
 47.6077 -28.9056    2.7  28.8   94.0   0.5343   4.3 ------	UNKNOWN
 58.0369 -47.4452    2.2   8.6   93.7   0.4164   5.1 ------	UNKNOWN
 12.5027 -55.8622    0.6  29.1   13.0   1.8344  20.1 ------	UNKNOWN
Post-slew image of 15-350 keV band
Time interval of the image:
85.988620 916.788600

# RAcent  DECcent POSerr Theta    Phi  PeakCts   SNR AngSep     Name
#  [deg]    [deg]    ['] [deg]  [deg]                   [']
 41.1089 -37.9249    2.8  26.2  133.8   3.9295   4.1 ------	UNKNOWN
 25.1144 -47.8780    2.5  11.1  124.3   3.1642   4.6 ------	UNKNOWN
291.1834 -38.6342    3.0  54.4  -33.2  16.0317   3.9 ------	UNKNOWN
289.9973 -44.8292    2.8  50.6  -39.5   9.5226   4.1 ------	UNKNOWN