Analysis Summary
Notes:
- 1) No attempt has been made to eliminate the non-significant decimal places.
- 2) This batgrbproduct analysis is done using the HEASARC data.
- 3) This batgrbproduct analysis is using the flight position for the mask-weighting calculation.
======================================================================
                  BAT GRB EVENT DATA PROCESSING REPORT
    Process Script Ver: batgrbproduct v2.48
    Process Start Time: Sat Jul 30 01:05:28 EDT 2022
             Host Name: batproc1
   Current Working Dir: /local/data/bat1/alien/Swift_3rdBATcatalog/event/batevent_reproc/trigger1001514
======================================================================

  Trigger: 01001514      Segment: 000

  BAT Trigger Time: 625200564.992   [s; MET]
      Trigger Stop: 625200565.504   [s; MET]
               UTC: 2020-10-24T02:48:59.133600    [includes UTCF correction]
       Where From?: TDRSS position message

  BAT
    RA: 125.947616961099   Dec: 3.37711306985024  [deg; J2000]

     Catalogged Source?: NO
     Point Source?:      YES
     GRB Indicated?:     YES    [ by BAT flight software ]
     Image S/N Ratio:    9.01
     Image Trigger?:     NO
     Rate S/N Ratio:     15.6204993518133  [ if not an image trigger ]
     Image S/N Ratio:    9.01

  Analysis Position:   [ source = BAT ]
    RA: 125.947616961099   Dec: 3.37711306985024  [deg; J2000]

  Refined Position:   [ source = BAT pre-slew burst ]
    RA: 125.959594374339   Dec: 3.3567347924688  [deg; J2000]
        { 08h 23m 50.3s , +03d 21' 24.2" }
         +/- 1.59473498746149 [arcmin] (estimated 90% radius based on SNR)
         +/- 0.673615129985825 [arcmin] (formal 1-sigma fit error)
    SNR: 15.6157679901746

  Angular difference between the analysis and refined position is 1.417623 arcmin

  Partial Coding Fraction: 0.2207031    [ including projection effects ]

  Duration
     T90: 5 +/- 2.23606797749979
        Measured from: 0.00800001621246338
                   to: 5.00800001621246     [s; relative to TRIGTIME]
     T50: 3 +/- 1
        Measured from: 0.00800001621246338
                   to: 3.00800001621246     [s; relative to TRIGTIME]


  Fluence
     Peak Flux  (peak 1 second)
        Measured from: 1.00800001621246
                   to: 2.00800001621246     [s; relative to TRIGTIME]
     Total Fluence
        Measured from: 0.00800001621246338
                   to: 6.00800001621246     [s; relative to TRIGTIME]

             Band 1     Band 2     Band 3     Band 4
              15-25      25-50     50-100    100-350     keV
 Total     0.603586   0.587051   0.255934   0.052952
           0.047669   0.047611   0.038468   0.031564 [error]
 Peak      0.164000   0.154784   0.082786   0.015239
           0.021999   0.021414   0.017710   0.013615 [error]

     [ fluence units of on-axis counts / fully illuminated detector ]

======================================================================


====== Table of the duration information =============================

        Value   tstart    tstop
T100    6.000    0.008    6.008
T90     5.000    0.008    5.008
T50     3.000    0.008    3.008
Peak    1.000    1.008    2.008


====== Spectral Analysis Summary =====================================

Model      : spectral model: simple power-law (PL) and cutoff power-law (CPL)
Ph_index   : photon index: E^{Ph_index}
Ph_90err   : 90% error of the photon index
Epeak      : Epeak in keV
Epeak_90err: 90% error of Epeak
Norm       : normalization at 50 keV in both the PL model and CPL model
Nomr_90err : 90% error of the normalization
chi2       : Chi-Squared
dof        : degree of freedo

=== Time-averaged spectral analysis ===
(Best model with acceptable fit: N/A)

Model Ph_index Ph_90err_low Ph_90err_hi  Epeak  Epeak_90err_low  Epeak_90err_hi  Norm       Nomr_90err_low    Norm_90err_hi    chi2    dof
PL      -2.103    -0.186      0.177       -           -               -         1.46e-02     -1.69e-03          1.65e-03      58.010   57
CPL     -1.991    -0.013      0.609        4.102      N/A           N/A         1.67e-02        N/A               N/A         58.170   56


=== 1-s peak spectral analysis ===
(Best model with acceptable fit: N/A)

Model Ph_index Ph_90err_low Ph_90err_hi  Epeak  Epeak_90err_low  Epeak_90err_hi  Norm       Nomr_90err_low    Norm_90err_hi    chi2    dof
PL      -2.120     -0.308     0.277       -           -               -         2.31e-02     -4.59e-03          4.39e-03      50.220   57
CPL     -1.832     -0.296     1.318       25.887     -20.610       -25.887      3.35e-02     -1.81e-02          1.48e-01      50.020   56


=== Fluence/Peak Flux Summary ===

              Model    Band1     Band2     Band3     Band4     Band5     Total
                       15-25     25-50    50-100    100-350    15-150    15-350    keV
Fluence         PL   1.97e-07  2.52e-07  2.34e-07  3.83e-07  8.13e-07  1.07e-06   erg/cm2
      90%_error_low -2.66e-08 -2.29e-08 -3.73e-08 -1.10e-07 -8.45e-08 -1.53e-07   erg/cm2
      90%_error_hi   2.74e-08  2.29e-08  3.77e-08  1.36e-07  8.57e-08  1.71e-07   erg/cm2
Peak flux       PL   1.73e+00  1.21e+00  5.57e-01  3.58e-01  3.67e+00  3.86e+00   ph/cm2/s
      90%_error_low -3.64e-01 -1.81e-01 -1.43e-01 -1.50e-01 -5.50e-01 -5.73e-01   ph/cm2/s
      90%_error_hi   3.81e-01  1.80e-01  1.44e-01  2.01e-01  5.50e-01  5.73e-01   ph/cm2/s

Fluence        CPL   1.92e-07  2.54e-07  2.35e-07  3.07e-07  8.08e-07  9.93e-07   erg/cm2
      90%_error_low -1.27e-08 -2.26e-08 -3.75e-08    N/A    -9.23e-08 -2.21e-07   erg/cm2
      90%_error_hi   2.19e-08  2.42e-08  3.66e-08    N/A     9.79e-08  3.12e-07   erg/cm2
Peak flux      CPL   1.67e+00  1.25e+00  5.63e-01  2.49e-01  3.64e+00  3.74e+00   ph/cm2/s
      90%_error_low -4.30e-01 -2.03e-01 -1.50e-01 -2.49e-01 -5.69e-01 -6.30e-01   ph/cm2/s
      90%_error_hi   3.67e-01  2.45e-01  1.54e-01  3.06e-01  5.59e-01  6.29e-01   ph/cm2/s

======================================================================
Image
Pre-slew 15.0-350.0 keV image (Event data)
#   RAcent    DECcent   POSerr    Theta     Phi              Peak Cts       SNR   Name
  125.9596     3.3567   0.0123    35.5876   -99.7446         1.5358368     15.616 TRIG_01001514

Foreground time interval of the image:
  0.008   6.008 (delta_t =   6.000 [sec])
Background time interval of the image:
-239.992   0.008 (delta_t = 240.000 [sec])
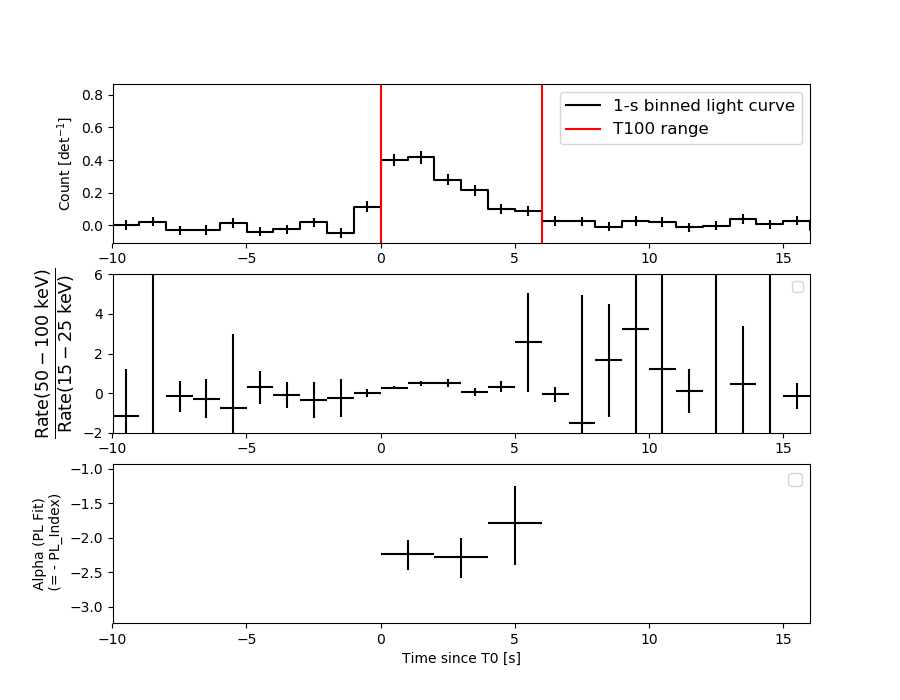
Light Curves
Note: The mask-weighted lightcurves have units of either count/det or counts/sec/det, where a det is 0.4 x 0.4 = 0.16 sq cm.
Full-time range; 1 s binning
Other quick-look light curves:
- 64 ms binning (zoomed)
- 16 ms binning (zoomed)
- 8 ms binning (zoomed)
- 2 ms binning (zoomed)
- SN=5 or 10 s binning (full-time range)
- Raw light curve
Spectra
- 64 ms binning (zoomed)
- 16 ms binning (zoomed)
- 8 ms binning (zoomed)
- 2 ms binning (zoomed)
- SN=5 or 10 s binning (full-time range)
- Raw light curve
Spectra
Notes:
- 1) The fitting includes the systematic errors.
- 2) When the burst includes telescope slew time periods, the fitting uses an average response file made from multiple 5-s response files through out the slew time plus single time preiod for the non-slew times, and weighted by the total counts in the corresponding time period using addrmf. An average response file is needed becuase a spectral fit using the pre-slew DRM will introduce some errors in both a spectral shape and a normalization if the PHA file contains a lot of the slew/post-slew time interval.
- 3) For fits to more complicated models (e.g. a power-law over a cutoff power-law), the BAT team has decided to require a chi-square improvement of more than 6 for each extra dof.
Time averaged spectrum fit using the average DRM
Power-law model
Time interval is from    0.008 sec. to    6.008 sec.

Spectral model in power-law:
------------------------------------------------------------
Parameters  : value       lower 90%   higher 90%
Photon index: -2.10342     ( -0.186299   0.176988 )
Norm@50keV  : 1.45787E-02    ( -0.00169491   0.00165153 )
------------------------------------------------------------
#Fit statistic  : Chi-Squared                   58.01     using 59 bins.
 Reduced chi-squared = 1.01772
# Null hypothesis probability of 4.38e-01 with 57 degrees of freedom

Photon flux (15-150 keV)    in 6 sec: 2.29769 ( -0.21355  0.21397 ) ph/cm2/s
Energy fluence (15-150 keV)             : 8.13132e-07 ( -8.4495e-08  8.56644e-08 ) ergs/cm2
Cutoff power-law model
Time interval is from    0.008 sec. to    6.008 sec.
Spectral model in the cutoff power-law:
------------------------------------------------------------
Parameters  : value       lower 90%   higher 90%
Photon index: -2.16183     ( -0.0057792   0.615652 )
Epeak [keV] : 117.533      (   )
Norm@50keV  : 1.35174E-02    (     )
------------------------------------------------------------
#Fit statistic  : Chi-Squared                   57.98     using 59 bins.
 Reduced chi-squared = 1.03536
# Null hypothesis probability of 4.02e-01 with 56 degrees of freedom

Photon flux (15-150 keV)    in 6 sec: 2.27301 ( -0.20683  0.20677 ) ph/cm2/s
Energy fluence (15-150 keV)             : 8.08056e-07 ( -9.22896e-08  9.78672e-08 ) ergs/cm2
1-s peak spectrum fit
Power-law model
Time interval is from    1.008 sec. to    2.008 sec.

Spectral model in power-law:
------------------------------------------------------------
Parameters  : value       lower 90%   higher 90%
Photon index: -2.11966     ( -0.307992   0.277021 )
Norm@50keV  : 2.31208E-02    ( -0.00458717   0.0043891 )
------------------------------------------------------------
#Fit statistic  : Chi-Squared                   50.22     using 59 bins.
 Reduced chi-squared = 0.881053
# Null hypothesis probability of 7.26e-01 with 57 degrees of freedom

Photon flux (15-150 keV)    in 1 sec: 3.67353 ( -0.54986  0.55039 ) ph/cm2/s
Energy fluence (15-150 keV)             : 2.15283e-07 ( -3.73895e-08  3.81248e-08 ) ergs/cm2
Cutoff power-law model
Time interval is from    1.008 sec. to    2.008 sec.
Spectral model in the cutoff power-law:
------------------------------------------------------------
Parameters  : value       lower 90%   higher 90%
Photon index: -1.83226     ( -0.295829   1.31798 )
Epeak [keV] : 25.8867      ( -20.6072 -25.8844 )
Norm@50keV  : 3.34594E-02    ( -0.0180697   0.14785 )
------------------------------------------------------------
#Fit statistic  : Chi-Squared                   50.02     using 59 bins.
 Reduced chi-squared = 0.893214
# Null hypothesis probability of 7.00e-01 with 56 degrees of freedom

Photon flux (15-150 keV)    in 1 sec: 3.63735 ( -0.56883  0.5586 ) ph/cm2/s
Energy fluence (15-150 keV)             : 2.11106e-07 ( -3.98405e-08  4.10156e-08 ) ergs/cm2
Time-resolved spectra
Distribution
T90 vs. Hardness ratio plot
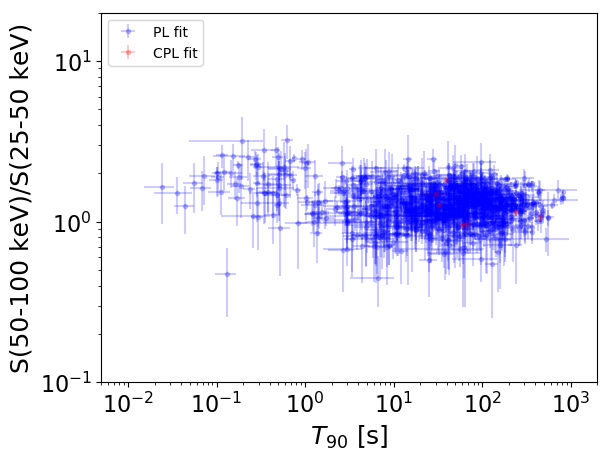
T90                                   = N/A sec.
Hardness ratio (energy fluence ratio) = N/A
S(15-50 keV) vs. S(50-150 keV) plot
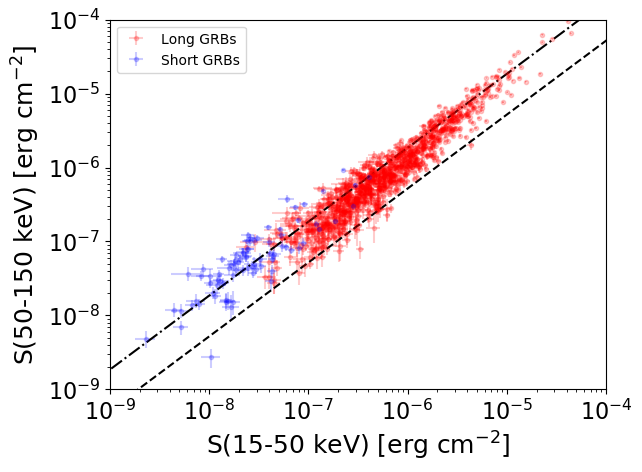
S(15-50 keV)  = N/A
S(50-150 keV) = N/A
The dash-dotted line and the dashed line traces the fluences calculated from the Band function with Epeak = 15 and 150 keV, respectively. Both lines assume a canonical values of alpha = -1 and beta = -2.5.
Mask shadow pattern
IMX = -1.211199638972073E-01, IMY = 7.052772742202933E-01
Spacecraft aspect plot
Bright source in the pre-burst/pre-slew/post-slew images
Pre-burst image of 15-350 keV band
Time interval of the image:
-239.992000 0.008000

# RAcent  DECcent POSerr Theta    Phi  PeakCts   SNR AngSep     Name
#  [deg]    [deg]    ['] [deg]  [deg]                   [']
 83.6185  22.0024    0.4  18.2  148.8   9.2848  26.2    1.1	Crab
 86.2568   2.1479    2.6   5.0   43.8   1.3509   4.4 ------	UNKNOWN
 79.1421 -44.8284    2.4  50.8   -0.8   3.4111   4.8 ------	UNKNOWN
103.7910 -50.9142    2.5  57.1  -21.1   7.0913   4.6 ------	UNKNOWN
117.4817 -38.7650    3.4  50.5  -38.5   3.8061   3.4 ------	UNKNOWN
127.0611 -11.2836    2.8  40.0  -76.8   4.8509   4.1 ------	UNKNOWN
137.6589  29.4801    3.9  50.9 -135.4   5.2775   3.0 ------	UNKNOWN
Pre-slew background subtracted image of 15-350 keV band
Time interval of the image:
0.008000 6.008000

# RAcent  DECcent POSerr Theta    Phi  PeakCts   SNR AngSep     Name
#  [deg]    [deg]    ['] [deg]  [deg]                   [']
 83.7306  21.8520    6.8  18.0  148.9   0.0661   1.7   11.2	Crab
 57.7935 -18.8809    3.5  40.0   41.4   0.2547   3.3 ------	UNKNOWN
122.4724  47.8513    3.1  50.9 -163.6   0.3646   3.8 ------	UNKNOWN
110.4483  -2.2839    2.2  21.4  -81.5   0.2480   5.4 ------	UNKNOWN
125.9596   3.3567    0.7  35.6  -99.7   1.5362  15.6 ------	UNKNOWN
Post-slew image of 15-350 keV band
Time interval of the image:
64.508600 962.059700

# RAcent  DECcent POSerr Theta    Phi  PeakCts   SNR AngSep     Name
#  [deg]    [deg]    ['] [deg]  [deg]                   [']
135.4929 -40.6223    7.4  44.9  -22.5   2.7712   1.5    4.4	Vela X-1
116.1521   7.1699    3.3  10.4   99.6   3.4540   3.5 ------	UNKNOWN
113.1824 -32.6810    2.9  38.0    5.4   5.0856   4.0 ------	UNKNOWN
135.1028  34.6286    3.6  32.4 -177.9   3.9754   3.3 ------	UNKNOWN
142.4803 -38.6344    4.6  44.7  -30.6   4.6260   2.6 ------	UNKNOWN
162.6226 -13.3095    2.9  40.1  -76.8  13.2007   4.0 ------	UNKNOWN