Analysis Summary
Notes:
- 1) No attempt has been made to eliminate the non-significant decimal places.
- 2) This batgrbproduct analysis is done using the HEASARC data.
- 3) This batgrbproduct analysis is using the flight position for the mask-weighting calculation.
======================================================================
BAT GRB EVENT DATA PROCESSING REPORT
Process Script Ver: batgrbproduct v2.48
Process Start Time: Sat Jul 30 01:03:18 EDT 2022
Host Name: batproc1
Current Working Dir: /local/data/bat1/alien/Swift_3rdBATcatalog/event/batevent_reproc/trigger1002103
======================================================================
Trigger: 01002103 Segment: 000
BAT Trigger Time: 625444680.064 [s; MET]
Trigger Stop: 625444681.088 [s; MET]
UTC: 2020-10-26T22:37:34.189480 [includes UTCF correction]
Where From?: TDRSS position message
BAT
RA: 196.664384320839 Dec: 83.7606316325239 [deg; J2000]
Catalogged Source?: NO
Point Source?: YES
GRB Indicated?: YES [ by BAT flight software ]
Image S/N Ratio: 6.67
Image Trigger?: NO
Rate S/N Ratio: 12.0415945787923 [ if not an image trigger ]
Image S/N Ratio: 6.67
Analysis Position: [ source = BAT ]
RA: 196.664384320839 Dec: 83.7606316325239 [deg; J2000]
Refined Position: [ source = BAT pre-slew burst ]
RA: 196.664107907484 Dec: 83.7846921612754 [deg; J2000]
{ 13h 06m 39.4s , +83d 47' 04.9" }
+/- 0.999246034010519 [arcmin] (estimated 90% radius based on SNR)
+/- 0.374192331069698 [arcmin] (formal 1-sigma fit error)
SNR: 30.4499323787849
Angular difference between the analysis and refined position is 1.443633 arcmin
Partial Coding Fraction: 0.46875 [ including projection effects ]
Duration
T90: 271.783999919891 +/- 10.6831070202307
Measured from: -40.6640000343323
to: 231.119999885559 [s; relative to TRIGTIME]
T50: 199.251999974251 +/- 6.20614926936312
Measured from: -1.33200001716614
to: 197.919999957085 [s; relative to TRIGTIME]
Fluence
Peak Flux (peak 1 second)
Measured from: 1.05200004577637
to: 2.05200004577637 [s; relative to TRIGTIME]
Total Fluence
Measured from: -54
to: 250.103999972343 [s; relative to TRIGTIME]
Band 1 Band 2 Band 3 Band 4
15-25 25-50 50-100 100-350 keV
Total 3.821668 4.587583 2.450368 0.519091
0.127649 0.133484 0.118151 0.108873 [error]
Peak 0.069258 0.098776 0.075916 0.015658
0.011157 0.011831 0.010375 0.008835 [error]
[ fluence units of on-axis counts / fully illuminated detector ]
======================================================================
====== Table of the duration information =============================
Value tstart tstop
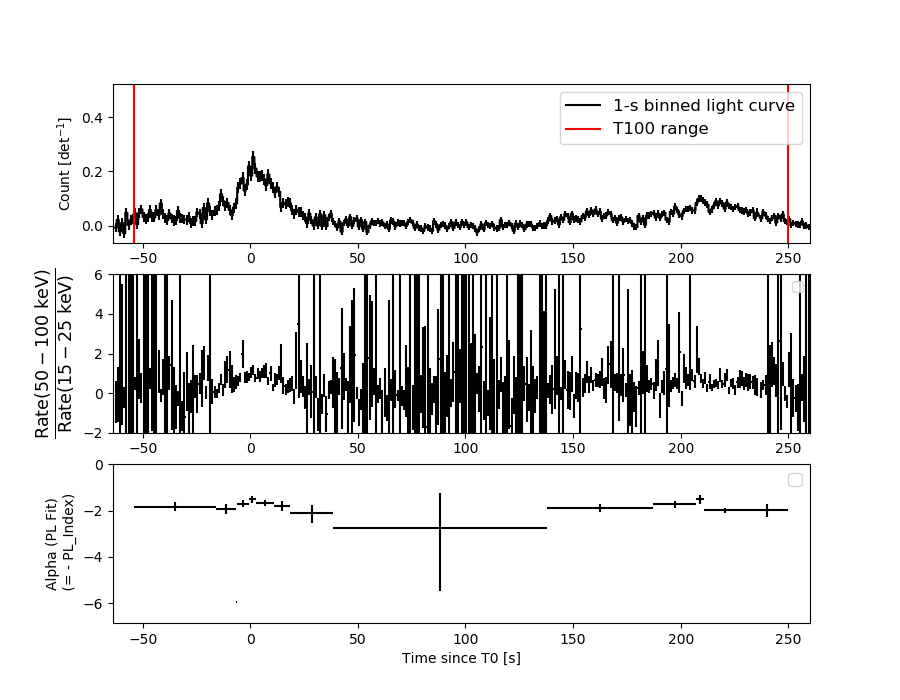
T100 304.104 -54.000 250.104
T90 271.784 -40.664 231.120
T50 199.252 -1.332 197.920
Peak 1.000 1.052 2.052
====== Spectral Analysis Summary =====================================
Model : spectral model: simple power-law (PL) and cutoff power-law (CPL)
Ph_index : photon index: E^{Ph_index}
Ph_90err : 90% error of the photon index
Epeak : Epeak in keV
Epeak_90err: 90% error of Epeak
Norm : normalization at 50 keV in both the PL model and CPL model
Nomr_90err : 90% error of the normalization
chi2 : Chi-Squared
dof : degree of freedo
=== Time-averaged spectral analysis ===
(Best model with acceptable fit: N/A)
Model Ph_index Ph_90err_low Ph_90err_hi Epeak Epeak_90err_low Epeak_90err_hi Norm Nomr_90err_low Norm_90err_hi chi2 dof
PL -1.900 -0.075 0.074 - - - 2.28e-03 -9.82e-05 9.76e-05 67.850 57
CPL -1.389 -0.315 0.342 54.523 -7.885 18.266 4.28e-03 -1.35e-03 2.21e-03 59.810 56
=== 1-s peak spectral analysis ===
(Best model with acceptable fit: N/A)
Model Ph_index Ph_90err_low Ph_90err_hi Epeak Epeak_90err_low Epeak_90err_hi Norm Nomr_90err_low Norm_90err_hi chi2 dof
PL -1.439 -0.218 0.216 - - - 1.78e-02 -2.32e-03 2.31e-03 61.340 57
CPL -0.947 -0.658 1.024 113.315 -46.037 -113.315 3.09e-02 -1.49e-02 6.23e-02 60.380 56
=== Fluence/Peak Flux Summary ===
Model Band1 Band2 Band3 Band4 Band5 Total
15-25 25-50 50-100 100-350 15-150 15-350 keV
Fluence PL 1.29e-06 1.85e-06 1.99e-06 3.96e-06 6.35e-06 9.09e-06 erg/cm2
90%_error_low -8.18e-08 -7.21e-08 -1.18e-07 -4.73e-07 -2.70e-07 -5.79e-07 erg/cm2
90%_error_hi 8.34e-08 7.21e-08 1.18e-07 5.15e-07 2.71e-07 6.11e-07 erg/cm2
Peak flux PL 6.92e-01 7.22e-01 5.32e-01 6.33e-01 2.19e+00 2.58e+00 ph/cm2/s
90%_error_low -1.51e-01 -1.03e-01 -8.41e-02 -1.83e-01 -2.89e-01 -3.35e-01 ph/cm2/s
90%_error_hi 1.61e-01 1.01e-01 8.29e-02 2.21e-01 2.90e-01 3.37e-01 ph/cm2/s
Fluence CPL 1.19e-06 1.94e-06 1.98e-06 1.80e-06 6.03e-06 6.91e-06 erg/cm2
90%_error_low -9.81e-08 -9.00e-08 -1.28e-07 -6.39e-07 -3.28e-07 -7.30e-07 erg/cm2
90%_error_hi 9.94e-08 9.13e-08 1.27e-07 1.06e-06 3.30e-07 1.10e-06 erg/cm2
Peak flux CPL 6.26e-01 7.53e-01 5.62e-01 3.90e-01 2.15e+00 2.33e+00 ph/cm2/s
90%_error_low -1.87e-01 -1.16e-01 -9.82e-02 -2.18e-01 -2.99e-01 -3.90e-01 ph/cm2/s
90%_error_hi 1.95e-01 1.21e-01 1.02e-01 3.16e-01 2.98e-01 4.59e-01 ph/cm2/s
======================================================================
Image
Pre-slew 15.0-350.0 keV image (Event data)
#   RAcent    DECcent   POSerr    Theta     Phi              Peak Cts       SNR   Name
  196.6641    83.7847   0.0063    34.2608    21.8808         5.5991735     30.450 TRIG_01002103

Foreground time interval of the image:
-54.000  13.637 (delta_t =  67.637 [sec])
Background time interval of the image:
-239.064 -54.000 (delta_t = 185.064 [sec])
Light Curves
Note: The mask-weighted lightcurves have units of either count/det or counts/sec/det, where a det is 0.4 x 0.4 = 0.16 sq cm.
Full-time range; 1 s binning
Other quick-look light curves:
- 64 ms binning (zoomed)
- 16 ms binning (zoomed)
- 8 ms binning (zoomed)
- 2 ms binning (zoomed)
- SN=5 or 10 s binning (full-time range)
- Raw light curve
Spectra
- 64 ms binning (zoomed)
- 16 ms binning (zoomed)
- 8 ms binning (zoomed)
- 2 ms binning (zoomed)
- SN=5 or 10 s binning (full-time range)
- Raw light curve
Spectra
Notes:
- 1) The fitting includes the systematic errors.
- 2) When the burst includes telescope slew time periods, the fitting uses an average response file made from multiple 5-s response files through out the slew time plus single time preiod for the non-slew times, and weighted by the total counts in the corresponding time period using addrmf. An average response file is needed becuase a spectral fit using the pre-slew DRM will introduce some errors in both a spectral shape and a normalization if the PHA file contains a lot of the slew/post-slew time interval.
- 3) For fits to more complicated models (e.g. a power-law over a cutoff power-law), the BAT team has decided to require a chi-square improvement of more than 6 for each extra dof.
Time averaged spectrum fit using the average DRM
Power-law model
Multiple GTIs in the spectrum
tstart tstop
-54.000000 235.376500
236.936000 250.104000

Spectral model in power-law:
------------------------------------------------------------
Parameters  : value       lower 90%   higher 90%
Photon index: -1.89968     ( -0.0752047   0.0742968 )
Norm@50keV  : 2.28399E-03    ( -9.82358e-05   9.76494e-05 )
------------------------------------------------------------
#Fit statistic  : Chi-Squared                   67.85     using 59 bins.
 Reduced chi-squared = 1.19035
# Null hypothesis probability of 1.54e-01 with 57 degrees of freedom

Photon flux (15-150 keV)    in 302.5 sec: 0.327753 ( -0.013218  0.013246 ) ph/cm2/s
Energy fluence (15-150 keV)             : 6.35295e-06 ( -2.69848e-07  2.71276e-07 ) ergs/cm2
Cutoff power-law model
Multiple GTIs in the spectrum
tstart tstop
-54.000000 235.376500
236.936000 250.104000
Spectral model in the cutoff power-law:
------------------------------------------------------------
Parameters  : value       lower 90%   higher 90%
Photon index: -1.38891     ( -0.314871   0.342353 )
Epeak [keV] : 54.5230      ( -7.88473 18.2664 )
Norm@50keV  : 4.27759E-03    ( -0.00134688   0.00220658 )
------------------------------------------------------------
#Fit statistic  : Chi-Squared                   59.81     using 59 bins.
 Reduced chi-squared = 1.06804
# Null hypothesis probability of 3.39e-01 with 56 degrees of freedom

Photon flux (15-150 keV)    in 302.5 sec: 0.317070 ( -0.014627  0.014646 ) ph/cm2/s
Energy fluence (15-150 keV)             : 6.03013e-06 ( -3.28412e-07  3.29994e-07 ) ergs/cm2
1-s peak spectrum fit
Power-law model
Time interval is from    1.052 sec. to    2.052 sec.

Spectral model in power-law:
------------------------------------------------------------
Parameters  : value       lower 90%   higher 90%
Photon index: -1.43888     ( -0.217797   0.215909 )
Norm@50keV  : 1.78182E-02    ( -0.00231504   0.00230814 )
------------------------------------------------------------
#Fit statistic  : Chi-Squared                   61.34     using 59 bins.
 Reduced chi-squared = 1.07614
# Null hypothesis probability of 3.23e-01 with 57 degrees of freedom

Photon flux (15-150 keV)    in 1 sec: 2.18990 ( -0.28947  0.29008 ) ph/cm2/s
Energy fluence (15-150 keV)             : 1.7088e-07 ( -2.40956e-08  2.42617e-08 ) ergs/cm2
Cutoff power-law model
Time interval is from    1.052 sec. to    2.052 sec.
Spectral model in the cutoff power-law:
------------------------------------------------------------
Parameters  : value       lower 90%   higher 90%
Photon index: -0.94673     ( -0.657812   1.0244 )
Epeak [keV] : 113.315      ( -46.0375 -113.315 )
Norm@50keV  : 3.08946E-02    ( -0.0148833   0.0623197 )
------------------------------------------------------------
#Fit statistic  : Chi-Squared                   60.38     using 59 bins.
 Reduced chi-squared = 1.07821
# Null hypothesis probability of 3.20e-01 with 56 degrees of freedom

Photon flux (15-150 keV)    in 1 sec: 2.15085 ( -0.29909  0.29797 ) ph/cm2/s
Energy fluence (15-150 keV)             : 1.66948e-07 ( -2.53393e-08  2.5308e-08 ) ergs/cm2
Time-resolved spectra
Distribution
T90 vs. Hardness ratio plot
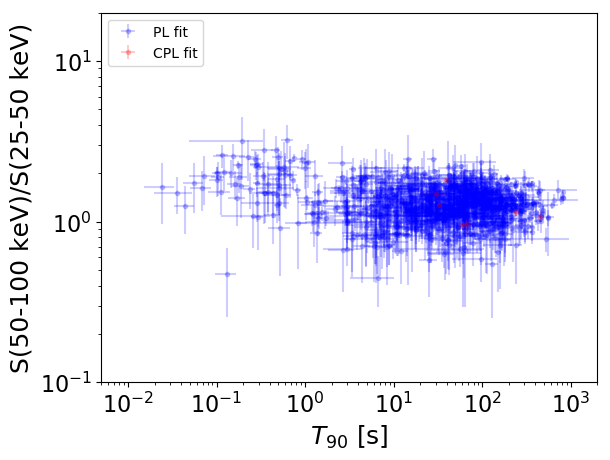
T90                                   = N/A sec.
Hardness ratio (energy fluence ratio) = N/A
S(15-50 keV) vs. S(50-150 keV) plot
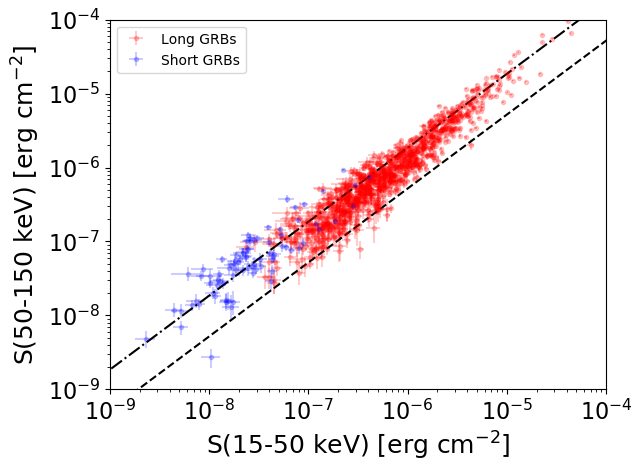
S(15-50 keV)  = N/A
S(50-150 keV) = N/A
The dash-dotted line and the dashed line traces the fluences calculated from the Band function with Epeak = 15 and 150 keV, respectively. Both lines assume a canonical values of alpha = -1 and beta = -2.5.
Mask shadow pattern
IMX = 6.320832793948350E-01, IMY = -2.538499748894549E-01
Spacecraft aspect plot
Bright source in the pre-burst/pre-slew/post-slew images
Pre-burst image of 15-350 keV band
Time interval of the image:
-239.064000 -54.000000

# RAcent  DECcent POSerr Theta    Phi  PeakCts   SNR AngSep     Name
#  [deg]    [deg]    ['] [deg]  [deg]                   [']
254.4218  35.2517    4.0  19.4 -126.5   0.6645   2.9    5.7	Her X-1
268.2360  -1.4273    4.9  55.3 -154.4  -2.2842  -2.3    8.1	SW J1753.5-0127
288.9372  10.8325    0.0  47.6  176.4   1.3529   2.5   10.6	GRS 1915+105
299.6853  35.1878    4.0  31.5  142.9   1.0040   2.9    4.7	Cyg X-1
307.8993  40.8095    0.0  32.4  126.8   0.6885   1.6   12.9	Cyg X-3
316.5334  28.6968    2.1  45.9  132.9   5.9338   5.5 ------	UNKNOWN
248.0970  38.5029    2.8  18.3 -108.0   0.9426   4.1 ------	UNKNOWN
160.6231  51.8950    3.4  56.3  -14.4   2.5493   3.4 ------	UNKNOWN
Pre-slew background subtracted image of 15-350 keV band
Time interval of the image:
-54.000000 13.636600

# RAcent  DECcent POSerr Theta    Phi  PeakCts   SNR AngSep     Name
#  [deg]    [deg]    ['] [deg]  [deg]                   [']
254.4659  35.3871  320.0  19.2 -126.4  -0.0048  -0.0    2.7	Her X-1
268.2336  -1.4201    3.3  55.2 -154.4   1.7584   3.5    8.3	SW J1753.5-0127
288.6817  10.9774    9.2  47.3  176.7   0.3462   1.3    7.1	GRS 1915+105
299.7482  35.3558    5.2  31.4  142.6  -0.4246  -2.2   12.1	Cyg X-1
308.0204  40.8139  127.4  32.5  126.7   0.0210   0.1    9.3	Cyg X-3
278.9207  74.8034    2.4  22.1   43.1   0.6513   4.7 ------	UNKNOWN
196.6641  83.7847    0.4  34.3   21.9   5.5982  30.4 ------	UNKNOWN
152.5619  64.1538    2.2  50.6    0.1   1.7364   5.2 ------	UNKNOWN
Post-slew image of 15-350 keV band
Time interval of the image:
67.836600 235.376500
236.936000 903.936590

# RAcent  DECcent POSerr Theta    Phi  PeakCts   SNR AngSep     Name
#  [deg]    [deg]    ['] [deg]  [deg]                   [']
254.4268  35.3287    5.3  51.5 -136.9   7.6595   2.2    1.7	Her X-1
299.6878  35.2449  162.2  56.4  177.8   0.2713   0.1    5.4	Cyg X-1
308.2474  40.9846    3.3  51.6  168.6   9.7937   3.5    6.5	Cyg X-3
 86.0986  45.7313    2.7  46.8   41.2  11.9375   4.3 ------	UNKNOWN
 15.5310  61.1888    3.4  35.1  105.9   5.4365   3.4 ------	UNKNOWN
196.5827  83.8095    1.5   0.1  102.8   5.3079   7.7 ------	UNKNOWN
134.3720  35.7257    2.6  51.6   -8.5   7.1326   4.5 ------	UNKNOWN
155.0007  60.7569    3.5  24.9  -24.5   2.4165   3.3 ------	UNKNOWN
139.4381  30.5444    3.8  56.2  -14.4   7.6963   3.1 ------	UNKNOWN
217.6987  42.9633    3.9  41.2  -98.5   9.2941   3.0 ------	UNKNOWN