Analysis Summary
Notes:
- 1) No attempt has been made to eliminate the non-significant decimal places.
- 2) This batgrbproduct analysis is done using the HEASARC data.
- 3) This batgrbproduct analysis is using the flight position for the mask-weighting calculation.
======================================================================
                  BAT GRB EVENT DATA PROCESSING REPORT
    Process Script Ver: batgrbproduct v2.48
    Process Start Time: Sat Jul 30 00:57:02 EDT 2022
             Host Name: batproc1
   Current Working Dir: /local/data/bat1/alien/Swift_3rdBATcatalog/event/batevent_reproc/trigger1004168
======================================================================

  Trigger: 01004168      Segment: 000

  BAT Trigger Time: 626204000.704   [s; MET]
      Trigger Stop: 626204001.088   [s; MET]
               UTC: 2020-11-04T17:32:54.779360    [includes UTCF correction]
       Where From?: TDRSS position message

  BAT
    RA: 5.21659807530782   Dec: 7.82039469041078  [deg; J2000]

     Catalogged Source?: NO
     Point Source?:      YES
     GRB Indicated?:     YES    [ by BAT flight software ]
     Image S/N Ratio:    11.43
     Image Trigger?:     NO
     Rate S/N Ratio:     44.7772263544762  [ if not an image trigger ]
     Image S/N Ratio:    11.43

  Analysis Position:   [ source = BAT ]
    RA: 5.21659807530782   Dec: 7.82039469041078  [deg; J2000]

  Refined Position:   [ source = BAT pre-slew burst ]
    RA: 5.21483624812214   Dec: 7.83453810714096  [deg; J2000]
        { 00h 20m 51.6s , +07d 50' 04.3" }
         +/- 0.814644087139038 [arcmin] (estimated 90% radius based on SNR)
         +/- 0.313788239006559 [arcmin] (formal 1-sigma fit error)
    SNR: 40.7668429674515

  Angular difference between the analysis and refined position is 0.855043 arcmin

  Partial Coding Fraction: 0.53125    [ including projection effects ]

  Duration
     T90: 8.6599999666214 +/- 0.161839373016547
        Measured from: -8.32000005245209
                   to: 0.339999914169312     [s; relative to TRIGTIME]
     T50: 5.27199995517731 +/- 0.211357516693095
        Measured from: -6.91600000858307
                   to: -1.64400005340576     [s; relative to TRIGTIME]


  Fluence
     Peak Flux  (peak 1 second)
        Measured from: -8.51999998092651
                   to: -7.51999998092651     [s; relative to TRIGTIME]
     Total Fluence
        Measured from: -8.8639999628067
                   to: 0.879999995231628     [s; relative to TRIGTIME]

             Band 1     Band 2     Band 3     Band 4
              15-25      25-50     50-100    100-350     keV
 Total     0.723391   1.027291   0.814917   0.233022
           0.030226   0.033323   0.029938   0.024122 [error]
 Peak      0.131294   0.184914   0.128900   0.031950
           0.010772   0.012111   0.010315   0.007536 [error]

     [ fluence units of on-axis counts / fully illuminated detector ]

======================================================================


====== Table of the duration information =============================

        Value   tstart    tstop
T100    9.744   -8.864    0.880
T90     8.660   -8.320    0.340
T50     5.272   -6.916   -1.644
Peak    1.000   -8.520   -7.520


====== Spectral Analysis Summary =====================================

Model      : spectral model: simple power-law (PL) and cutoff power-law (CPL)
Ph_index   : photon index: E^{Ph_index}
Ph_90err   : 90% error of the photon index
Epeak      : Epeak in keV
Epeak_90err: 90% error of Epeak
Norm       : normalization at 50 keV in both the PL model and CPL model
Nomr_90err : 90% error of the normalization
chi2       : Chi-Squared
dof        : degree of freedo

=== Time-averaged spectral analysis ===
(Best model with acceptable fit: N/A)

Model Ph_index Ph_90err_low Ph_90err_hi  Epeak  Epeak_90err_low  Epeak_90err_hi  Norm       Nomr_90err_low    Norm_90err_hi    chi2    dof
PL      -1.476    -0.069      0.069       -           -               -         1.98e-02     -7.39e-04          7.39e-04      61.170   57
CPL     -1.426    -0.114      0.251      563.601    -563.601      -563.601      2.09e-02     -1.75e-03          6.21e-03      61.250   56


=== 1-s peak spectral analysis ===
(Best model with acceptable fit: N/A)

Model Ph_index Ph_90err_low Ph_90err_hi  Epeak  Epeak_90err_low  Epeak_90err_hi  Norm       Nomr_90err_low    Norm_90err_hi    chi2    dof
PL      -1.563     -0.128     0.126       -           -               -         3.23e-02     -2.40e-03          2.39e-03      55.600   57
CPL     -1.482     -0.204     0.439      320.082    -320.082      -320.082      3.56e-02     -1.83e-02          2.27e-02      55.640   56


=== Fluence/Peak Flux Summary ===

              Model    Band1     Band2     Band3     Band4     Band5     Total
                       15-25     25-50    50-100    100-350    15-150    15-350    keV
Fluence         PL   2.41e-07  4.50e-07  6.47e-07  1.97e-06  1.84e-06  3.31e-06   erg/cm2
      90%_error_low -1.71e-08 -1.88e-08 -3.04e-08 -2.02e-07 -7.38e-08 -2.21e-07   erg/cm2
      90%_error_hi   1.76e-08  1.87e-08  3.03e-08  2.17e-07  7.40e-08  2.34e-07   erg/cm2
Peak flux       PL   1.41e+00  1.37e+00  9.27e-01  9.83e-01  4.11e+00  4.69e+00   ph/cm2/s
      90%_error_low -1.75e-01 -1.06e-01 -8.67e-02 -1.76e-01 -3.05e-01 -3.39e-01   ph/cm2/s
      90%_error_hi   1.81e-01  1.05e-01  8.60e-02  1.98e-01  3.05e-01  3.40e-01   ph/cm2/s

Fluence        CPL   2.40e-07  2.97e-07  6.48e-07  1.97e-06  1.84e-06  3.23e-06   erg/cm2
      90%_error_low -2.19e-08 -3.08e-08 -3.13e-08 -6.64e-07 -7.94e-08 -5.98e-07   erg/cm2
      90%_error_hi   1.48e-08  2.94e-08  3.38e-08  1.29e-07  7.71e-08  2.94e-07   erg/cm2
Peak flux      CPL   1.41e+00  1.37e+00  9.29e-01  9.80e-01  4.10e+00  4.66e+00   ph/cm2/s
      90%_error_low -2.06e-01 -1.08e-01 -8.85e-02 -4.41e-01 -3.02e-01 -5.37e-01   ph/cm2/s
      90%_error_hi   1.55e-01  1.24e-01  9.59e-02  1.18e-01  3.08e-01  3.65e-01   ph/cm2/s

======================================================================
Image
Pre-slew 15.0-350.0 keV image (Event data)

#   RAcent    DECcent   POSerr    Theta     Phi              Peak Cts       SNR   Name
    5.2148     7.8345   0.0047    33.6722   153.7123         2.8816942     40.767 TRIG_01004168

Foreground time interval of the image:
 -8.864   0.880 (delta_t =   9.744 [sec])
Background time interval of the image:
-54.003  -8.864 (delta_t =  45.139 [sec])
Light Curves
Note: The mask-weighted lightcurves have units of either count/det or counts/sec/det, where a det is 0.4 x 0.4 = 0.16 sq cm.
Full-time range; 1 s binning
Other quick-look light curves:
- 64 ms binning (zoomed)
- 16 ms binning (zoomed)
- 8 ms binning (zoomed)
- 2 ms binning (zoomed)
- SN=5 or 10 s binning (full-time range)
- Raw light curve
Spectra
- 64 ms binning (zoomed)
- 16 ms binning (zoomed)
- 8 ms binning (zoomed)
- 2 ms binning (zoomed)
- SN=5 or 10 s binning (full-time range)
- Raw light curve
Spectra
Notes:
- 1) The fitting includes the systematic errors.
- 2) When the burst includes telescope slew time periods, the fitting uses an average response file made from multiple 5-s response files through out the slew time plus single time preiod for the non-slew times, and weighted by the total counts in the corresponding time period using addrmf. An average response file is needed becuase a spectral fit using the pre-slew DRM will introduce some errors in both a spectral shape and a normalization if the PHA file contains a lot of the slew/post-slew time interval.
- 3) For fits to more complicated models (e.g. a power-law over a cutoff power-law), the BAT team has decided to require a chi-square improvement of more than 6 for each extra dof.
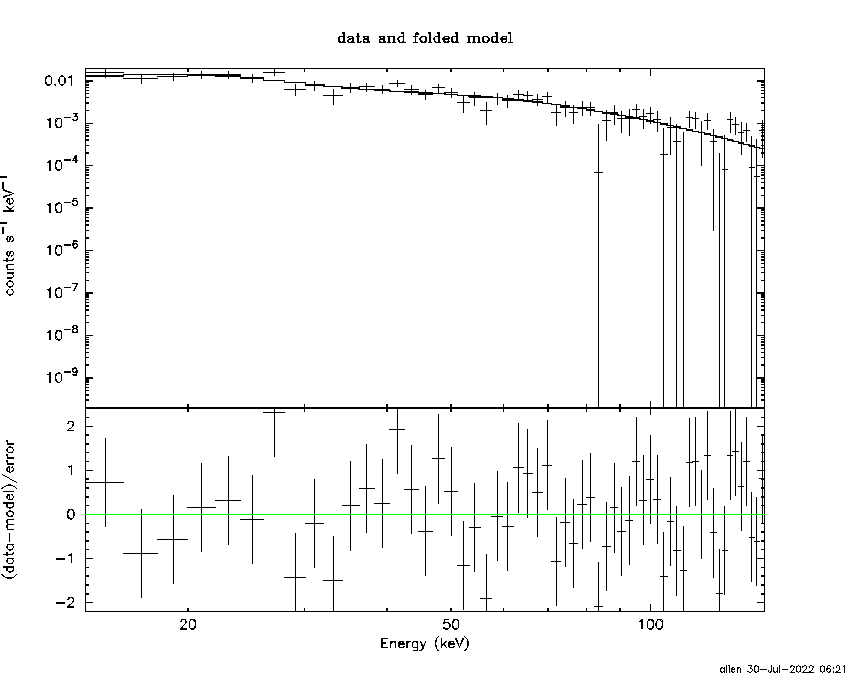
Time averaged spectrum fit using the average DRM
Power-law model

Time interval is from   -8.864 sec. to    0.880 sec.

Spectral model in power-law:
------------------------------------------------------------
Parameters  : value       lower 90%   higher 90%
Photon index: -1.47594     ( -0.0693829   0.0692759 )
Norm@50keV  : 1.98277E-02    ( -0.000739104   0.000738696 )
------------------------------------------------------------
#Fit statistic  : Chi-Squared                   61.17     using 59 bins.
 Reduced chi-squared = 1.07316
# Null hypothesis probability of 3.29e-01 with 57 degrees of freedom

Photon flux (15-150 keV)    in 9.744 sec: 2.45966 ( -0.09793  0.09827 ) ph/cm2/s
Energy fluence (15-150 keV)             : 1.84047e-06 ( -7.38294e-08  7.40422e-08 ) ergs/cm2
Cutoff power-law model

Time interval is from   -8.864 sec. to    0.880 sec.
Spectral model in the cutoff power-law:
------------------------------------------------------------
Parameters  : value       lower 90%   higher 90%
Photon index: -1.42588     ( -0.0941255   0.271109 )
Epeak [keV] : 563.601      ( -994.385 -994.385 )
Norm@50keV  : 2.09393E-02    ( -0.00129308   0.00666427 )
------------------------------------------------------------
#Fit statistic  : Chi-Squared                   61.25     using 59 bins.
 Reduced chi-squared = 1.09375
# Null hypothesis probability of 2.93e-01 with 56 degrees of freedom

Photon flux (15-150 keV)    in 9.744 sec: 2.45650 ( -0.10621  0.10101 ) ph/cm2/s
Energy fluence (15-150 keV)             : 1.83648e-06 ( -7.94182e-08  7.7146e-08 ) ergs/cm2
1-s peak spectrum fit
Power-law model

Time interval is from   -8.520 sec. to   -7.520 sec.

Spectral model in power-law:
------------------------------------------------------------
Parameters  : value       lower 90%   higher 90%
Photon index: -1.5634     ( -0.127552   0.126402 )
Norm@50keV  : 3.23162E-02    ( -0.00240035   0.00238945 )
------------------------------------------------------------
#Fit statistic  : Chi-Squared                   55.60     using 59 bins.
 Reduced chi-squared = 0.975439
# Null hypothesis probability of 5.28e-01 with 57 degrees of freedom

Photon flux (15-150 keV)    in 1 sec: 4.10720 ( -0.30493  0.30549 ) ph/cm2/s
Energy fluence (15-150 keV)             : 3.03697e-07 ( -2.42432e-08  2.43983e-08 ) ergs/cm2
Cutoff power-law model
Time interval is from   -8.520 sec. to   -7.520 sec.
Spectral model in the cutoff power-law:
------------------------------------------------------------
Parameters  : value       lower 90%   higher 90%
Photon index: -1.56117     ( -0.198917   0.444341 )
Epeak [keV] : 9984.86      ( -9955.86 -9955.86 )
Norm@50keV  : 3.24023E-02    ( -0.0151158   0.0258679 )
------------------------------------------------------------
#Fit statistic  : Chi-Squared                   55.60     using 59 bins.
 Reduced chi-squared = 0.992857
# Null hypothesis probability of 4.90e-01 with 56 degrees of freedom

Photon flux (15-150 keV)    in 1 sec: 4.10436 ( -0.3023  0.30752 ) ph/cm2/s
Energy fluence (15-150 keV)             : 3.03235e-07 ( -2.59988e-08  2.46866e-08 ) ergs/cm2
Time-resolved spectra

Distribution
T90 vs. Hardness ratio plot

T90                                   = N/A sec.
Hardness ratio (energy fluence ratio) = N/A
S(15-50 keV) vs. S(50-150 keV) plot

S(15-50 keV)  = N/A
S(50-150 keV) = N/A
The dash-dotted line and the dashed line traces the fluences calculated from the Band function with Epeak = 15 and 150 keV, respectively. Both lines assume a canonical values of alpha = -1 and beta = -2.5.
Mask shadow pattern

IMX = -5.973174420300765E-01, IMY = -2.950537594947298E-01
Spacecraft aspect plot

Bright source in the pre-burst/pre-slew/post-slew images
Pre-burst image of 15-350 keV band
Time interval of the image:
-54.003400 -8.864000

# RAcent  DECcent POSerr Theta    Phi  PeakCts   SNR AngSep     Name
#  [deg]    [deg]    ['] [deg]  [deg]                   [']
326.2541  38.2983    3.4  34.0 -116.1   0.4812   3.4    4.1	Cyg X-2
Pre-slew background subtracted image of 15-350 keV band
Time interval of the image:
-8.864000 0.880000

# RAcent  DECcent POSerr Theta    Phi  PeakCts   SNR AngSep     Name
#  [deg]    [deg]    ['] [deg]  [deg]                   [']
326.0783  38.3954    6.3  34.1 -115.8   0.1447   1.8    6.2	Cyg X-2
 79.9856  38.8368    2.4  51.6   32.1   1.2255   4.8 ------	UNKNOWN
 59.2990  34.0046    3.0  38.6   48.3   0.4055   3.8 ------	UNKNOWN
 38.8391  22.9962    2.8  29.7   82.8   0.3223   4.1 ------	UNKNOWN
  5.2148   7.8345    0.3  33.7  153.7   2.8819  40.8  564.1	UNKNOWN
356.7526  -3.0191    2.2  46.0  163.4   0.6784   5.1  266.0	UNKNOWN
Post-slew image of 15-350 keV band
Time interval of the image:
87.196600 509.896590

# RAcent  DECcent POSerr Theta    Phi  PeakCts   SNR AngSep     Name
#  [deg]    [deg]    ['] [deg]  [deg]                   [']
326.2023  38.4097    4.6  46.5  -26.4   1.6218   2.5    5.5	Cyg X-2
 42.3986  28.2070    2.8  40.6   71.4   5.6397   4.2 ------	UNKNOWN
352.7095 -41.1477    2.4  50.3 -151.5   4.6019   4.9 ------	UNKNOWN
342.5808 -41.1504    3.1  53.2 -142.5   7.7994   3.7 ------	UNKNOWN
335.6855 -30.9532    2.6  48.0 -129.0   7.5753   4.4 ------	UNKNOWN