Analysis Summary
Notes:
- 1) No attempt has been made to eliminate the non-significant decimal places.
- 2) This batgrbproduct analysis is done using the HEASARC data.
- 3) This batgrbproduct analysis is using the flight position for the mask-weighting calculation.
======================================================================
BAT GRB EVENT DATA PROCESSING REPORT
Process Script Ver: batgrbproduct v2.48
Process Start Time: Sat Jul 30 00:53:44 EDT 2022
Host Name: batproc1
Current Working Dir: /local/data/bat1/alien/Swift_3rdBATcatalog/event/batevent_reproc/trigger1004239
======================================================================
Trigger: 01004239 Segment: 000
BAT Trigger Time: 626247096.32 [s; MET]
Trigger Stop: 626247097.344 [s; MET]
UTC: 2020-11-05T05:31:10.392500 [includes UTCF correction]
Where From?: TDRSS position message
BAT
RA: 245.626275813377 Dec: 12.7301449302437 [deg; J2000]
Catalogged Source?: NO
Point Source?: YES
GRB Indicated?: YES [ by BAT flight software ]
Image S/N Ratio: 24.04
Image Trigger?: NO
Rate S/N Ratio: 222.506179689464 [ if not an image trigger ]
Image S/N Ratio: 24.04
Analysis Position: [ source = BAT ]
RA: 245.626275813377 Dec: 12.7301449302437 [deg; J2000]
Refined Position: [ source = BAT pre-slew burst ]
RA: 245.610883088777 Dec: 12.734105095692 [deg; J2000]
{ 16h 22m 26.6s , +12d 44' 02.8" }
+/- 0.614656821841044 [arcmin] (estimated 90% radius based on SNR)
+/- 0.147062150395927 [arcmin] (formal 1-sigma fit error)
SNR: 60.9637476970861
Angular difference between the analysis and refined position is 0.931663 arcmin
Partial Coding Fraction: 0.609375 [ including projection effects ]
Duration
T90: 33.6799999475479 +/- 4.02717970554488
Measured from: -0.820000052452087
to: 32.8599998950958 [s; relative to TRIGTIME]
T50: 8.67999994754791 +/- 0.348390612572339
Measured from: 1.29199993610382
to: 9.97199988365173 [s; relative to TRIGTIME]
Fluence
Peak Flux (peak 1 second)
Measured from: 0.763999938964844
to: 1.76399993896484 [s; relative to TRIGTIME]
Total Fluence
Measured from: -2.85199999809265
to: 72.107999920845 [s; relative to TRIGTIME]
Band 1 Band 2 Band 3 Band 4
15-25 25-50 50-100 100-350 keV
Total 3.203238 5.706714 5.917301 1.893654
0.073136 0.081597 0.079320 0.068540 [error]
Peak 0.319772 0.561488 0.706670 0.238566
0.013278 0.017109 0.019192 0.014970 [error]
[ fluence units of on-axis counts / fully illuminated detector ]
======================================================================
====== Table of the duration information =============================
Value tstart tstop
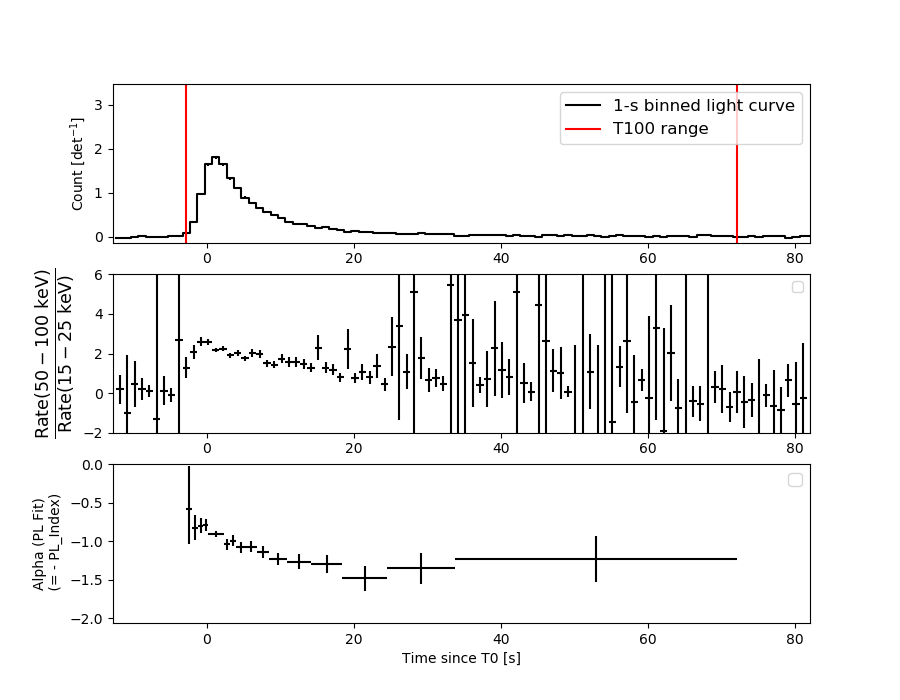
T100 74.960 -2.852 72.108
T90 33.680 -0.820 32.860
T50 8.680 1.292 9.972
Peak 1.000 0.764 1.764
====== Spectral Analysis Summary =====================================
Model : spectral model: simple power-law (PL) and cutoff power-law (CPL)
Ph_index : photon index: E^{Ph_index}
Ph_90err : 90% error of the photon index
Epeak : Epeak in keV
Epeak_90err: 90% error of Epeak
Norm : normalization at 50 keV in both the PL model and CPL model
Nomr_90err : 90% error of the normalization
chi2 : Chi-Squared
dof : degree of freedo
=== Time-averaged spectral analysis ===
(Best model with acceptable fit: N/A)
Model Ph_index Ph_90err_low Ph_90err_hi Epeak Epeak_90err_low Epeak_90err_hi Norm Nomr_90err_low Norm_90err_hi chi2 dof
PL -1.084 -0.035 0.035 - - - 1.52e-02 -2.89e-04 2.89e-04 40.700 57
CPL -0.900 -0.138 0.144 368.741 -133.605 864.399 1.81e-02 -2.10e-03 2.56e-03 35.660 56
=== 1-s peak spectral analysis ===
(Best model with acceptable fit: N/A)
Model Ph_index Ph_90err_low Ph_90err_hi Epeak Epeak_90err_low Epeak_90err_hi Norm Nomr_90err_low Norm_90err_hi chi2 dof
PL -0.906 -0.058 0.058 - - - 1.21e-01 -3.92e-03 3.91e-03 54.330 57
CPL -0.627 -0.232 0.247 295.716 -109.974 1018.244 1.59e-01 -3.08e-02 4.18e-02 50.170 56
=== Fluence/Peak Flux Summary ===
Model Band1 Band2 Band3 Band4 Band5 Total
15-25 25-50 50-100 100-350 15-150 15-350 keV
Fluence PL 9.89e-07 2.35e-06 4.43e-06 2.03e-05 1.20e-05 2.80e-05 erg/cm2
90%_error_low -4.12e-08 -5.75e-08 -8.69e-08 -9.51e-07 -2.27e-07 -9.78e-07 erg/cm2
90%_error_hi 4.20e-08 5.73e-08 8.67e-08 9.85e-07 2.27e-07 1.01e-06 erg/cm2
Peak flux PL 2.82e+00 4.05e+00 4.32e+00 8.56e+00 1.39e+01 1.98e+01 ph/cm2/s
90%_error_low -1.91e-01 -1.66e-01 -1.51e-01 -6.50e-01 -4.50e-01 -7.38e-01 ph/cm2/s
90%_error_hi 1.96e-01 1.66e-01 1.51e-01 6.84e-01 4.51e-01 7.50e-01 ph/cm2/s
Fluence CPL 9.34e-07 2.36e-06 4.52e-06 1.63e-05 1.19e-05 2.41e-05 erg/cm2
90%_error_low -5.66e-08 -5.89e-08 -1.09e-07 -2.43e-06 -2.39e-07 -2.41e-06 erg/cm2
90%_error_hi 5.79e-08 5.90e-08 1.10e-07 2.82e-06 2.38e-07 2.88e-06 erg/cm2
Peak flux CPL 2.60e+00 4.09e+00 4.47e+00 6.55e+00 1.37e+01 1.77e+01 ph/cm2/s
90%_error_low -2.56e-01 -1.73e-01 -1.96e-01 -1.28e+00 -4.69e-01 -1.37e+00 ph/cm2/s
90%_error_hi 2.63e-01 1.74e-01 1.98e-01 1.66e+00 4.69e-01 1.72e+00 ph/cm2/s
======================================================================
Image
Pre-slew 15.0-350.0 keV image (Event data)
#   RAcent    DECcent   POSerr    Theta     Phi              Peak Cts       SNR   Name
  245.6109    12.7341   0.0031    23.1513  -102.0465        16.6180069     60.964 TRIG_01004239

Foreground time interval of the image:
 -2.852  72.108 (delta_t =  74.960 [sec])
Background time interval of the image:
-239.320  -2.852 (delta_t = 236.468 [sec])
Light Curves
Note: The mask-weighted lightcurves have units of either count/det or counts/sec/det, where a det is 0.4 x 0.4 = 0.16 sq cm.
Full-time range; 1 s binning
Other quick-look light curves:
- 64 ms binning (zoomed)
- 16 ms binning (zoomed)
- 8 ms binning (zoomed)
- 2 ms binning (zoomed)
- SN=5 or 10 s binning (full-time range)
- Raw light curve
Spectra
- 64 ms binning (zoomed)
- 16 ms binning (zoomed)
- 8 ms binning (zoomed)
- 2 ms binning (zoomed)
- SN=5 or 10 s binning (full-time range)
- Raw light curve
Spectra
Notes:
- 1) The fitting includes the systematic errors.
- 2) When the burst includes telescope slew time periods, the fitting uses an average response file made from multiple 5-s response files through out the slew time plus single time preiod for the non-slew times, and weighted by the total counts in the corresponding time period using addrmf. An average response file is needed becuase a spectral fit using the pre-slew DRM will introduce some errors in both a spectral shape and a normalization if the PHA file contains a lot of the slew/post-slew time interval.
- 3) For fits to more complicated models (e.g. a power-law over a cutoff power-law), the BAT team has decided to require a chi-square improvement of more than 6 for each extra dof.
Time averaged spectrum fit using the average DRM
Power-law model
Time interval is from   -2.852 sec. to   72.108 sec.

Spectral model in power-law:
------------------------------------------------------------
Parameters  : value       lower 90%   higher 90%
Photon index: -1.08366     ( -0.0346596   0.0348096 )
Norm@50keV  : 1.52385E-02    ( -0.000289117   0.000288631 )
------------------------------------------------------------
#Fit statistic  : Chi-Squared                   40.70     using 59 bins.
 Reduced chi-squared = 0.714035
# Null hypothesis probability of 9.49e-01 with 57 degrees of freedom

Photon flux (15-150 keV)    in 74.96 sec: 1.76487 ( -0.03547  0.03554 ) ph/cm2/s
Energy fluence (15-150 keV)             : 1.20072e-05 ( -2.27052e-07  2.27145e-07 ) ergs/cm2
Cutoff power-law model
Time interval is from   -2.852 sec. to   72.108 sec.
Spectral model in the cutoff power-law:
------------------------------------------------------------
Parameters  : value       lower 90%   higher 90%
Photon index: -0.899877     ( -0.138074   0.144482 )
Epeak [keV] : 368.741      ( -133.605 864.398 )
Norm@50keV  : 1.81106E-02    ( -0.00210495   0.00256062 )
------------------------------------------------------------
#Fit statistic  : Chi-Squared                   35.66     using 59 bins.
 Reduced chi-squared = 0.636786
# Null hypothesis probability of 9.84e-01 with 56 degrees of freedom

Photon flux (15-150 keV)    in 74.96 sec: 1.74341 ( -0.03864  0.03878 ) ph/cm2/s
Energy fluence (15-150 keV)             : 1.19149e-05 ( -2.38745e-07  2.38278e-07 ) ergs/cm2
1-s peak spectrum fit
Power-law model
Time interval is from    0.764 sec. to    1.764 sec.

Spectral model in power-law:
------------------------------------------------------------
Parameters  : value       lower 90%   higher 90%
Photon index: -0.906476     ( -0.0577894   0.058032 )
Norm@50keV  : 0.120703    ( -0.00391615   0.00390916 )
------------------------------------------------------------
#Fit statistic  : Chi-Squared                   54.33     using 59 bins.
 Reduced chi-squared = 0.953158
# Null hypothesis probability of 5.76e-01 with 57 degrees of freedom

Photon flux (15-150 keV)    in 1 sec: 13.8548 ( -0.4505  0.4508 ) ph/cm2/s
Energy fluence (15-150 keV)             : 1.35136e-06 ( -4.84033e-08  4.85174e-08 ) ergs/cm2
Cutoff power-law model
Time interval is from    0.764 sec. to    1.764 sec.
Spectral model in the cutoff power-law:
------------------------------------------------------------
Parameters  : value       lower 90%   higher 90%
Photon index: -0.627483     ( -0.231619   0.246698 )
Epeak [keV] : 295.716      ( -109.974 1018.25 )
Norm@50keV  : 0.158563    ( -0.0308289   0.0417627 )
------------------------------------------------------------
#Fit statistic  : Chi-Squared                   50.17     using 59 bins.
 Reduced chi-squared = 0.895893
# Null hypothesis probability of 6.94e-01 with 56 degrees of freedom

Photon flux (15-150 keV)    in 1 sec: 13.6946 ( -0.4689  0.4692 ) ph/cm2/s
Energy fluence (15-150 keV)             : 1.33706e-06 ( -5.06186e-08  5.04624e-08 ) ergs/cm2
Time-resolved spectra
Distribution
T90 vs. Hardness ratio plot
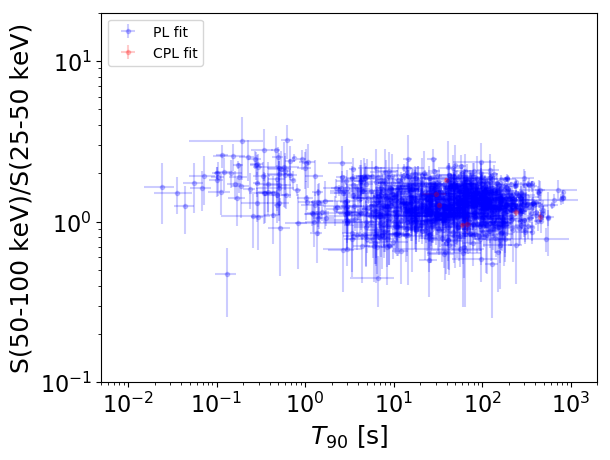
T90                                   = N/A sec.
Hardness ratio (energy fluence ratio) = N/A
S(15-50 keV) vs. S(50-150 keV) plot
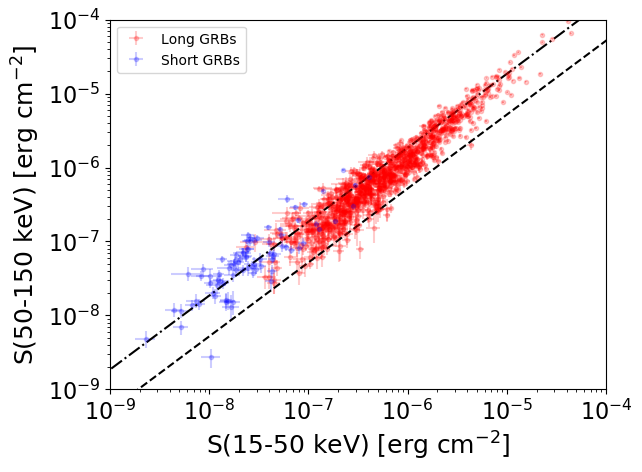
S(15-50 keV)  = N/A
S(50-150 keV) = N/A
The dash-dotted line and the dashed line traces the fluences calculated from the Band function with Epeak = 15 and 150 keV, respectively. Both lines assume a canonical values of alpha = -1 and beta = -2.5.
Mask shadow pattern
IMX = -8.924167356901987E-02, IMY = 4.181789610806486E-01
Spacecraft aspect plot
Bright source in the pre-burst/pre-slew/post-slew images
Pre-burst image of 15-350 keV band
Time interval of the image:
-239.320000 -2.852000

# RAcent  DECcent POSerr Theta    Phi  PeakCts   SNR AngSep     Name
#  [deg]    [deg]    ['] [deg]  [deg]                   [']
254.2017  35.3052    0.0   1.0   31.9  -0.3157  -1.5   12.7	Her X-1
268.4860  -1.5350    6.4  38.2 -147.8  -0.7101  -1.8    8.6	SW J1753.5-0127
274.0606 -14.1716    3.5  51.9 -149.2   2.3044   3.2    8.7	GX 17+2
288.7495  10.8398    3.5  38.9  173.8   1.1989   3.3    7.0	GRS 1915+105
299.7119  35.3242  421.0  36.6  130.2   0.0132   0.0    9.5	Cyg X-1
190.7714  74.7238    3.5  50.2   37.0   3.6220   3.3 ------	UNKNOWN
205.9054  67.5932    2.5  43.2   30.1   2.0184   4.7 ------	UNKNOWN
212.5707  48.9587    3.7  34.1    3.2   0.9327   3.1 ------	UNKNOWN
190.9738  40.6369    2.7  49.8   -8.0   2.1294   4.4 ------	UNKNOWN
269.0613  -9.4801    2.7  45.9 -145.0   2.3237   4.3 ------	UNKNOWN
248.5651  -9.1463    2.5  43.9 -116.4   4.9443   4.6 ------	UNKNOWN
Pre-slew background subtracted image of 15-350 keV band
Time interval of the image:
-2.852000 72.108000

# RAcent  DECcent POSerr Theta    Phi  PeakCts   SNR AngSep     Name
#  [deg]    [deg]    ['] [deg]  [deg]                   [']
254.5028  35.1336    0.0   0.8   43.6  -0.3172  -1.6   12.7	Her X-1
268.5215  -1.4996    5.2  38.1 -147.9   0.6882   2.2    9.6	SW J1753.5-0127
273.9312 -14.1245   13.1  51.8 -149.1   0.6573   0.9    6.8	GX 17+2
288.9831  10.9088    0.0  39.1  173.5   0.5927   1.9   11.1	GRS 1915+105
299.3838  35.2476    0.0  36.4  130.4   0.3553   1.0   10.5	Cyg X-1
181.4756  69.6661    3.2  52.3   30.0   3.4615   3.6 ------	UNKNOWN
301.6733  -0.2653    3.1  55.9  172.9   4.1085   3.8 ------	UNKNOWN
245.6109  12.7341    0.2  23.2 -102.0  16.6179  61.0 ------	UNKNOWN
Post-slew image of 15-350 keV band
Time interval of the image:
728.880590 962.768800

# RAcent  DECcent POSerr Theta    Phi  PeakCts   SNR AngSep     Name
#  [deg]    [deg]    ['] [deg]  [deg]                   [']
299.5898  35.2136    3.0  41.9 -125.2   2.2244   3.8    0.7	Cyg X-1
308.0413  41.0535    2.5  33.0 -125.0   1.7230   4.7    6.8	Cyg X-3
325.9764  38.2320 1216.0  24.6 -148.8  -0.0022  -0.0   10.7	Cyg X-2
 27.9985  32.9899    2.9  31.5   84.7   1.5813   3.9 ------	UNKNOWN
357.0481  10.1896    2.5  43.3  143.9   3.0203   4.6 ------	UNKNOWN
355.4884  36.3656    2.7  17.1  144.5   1.0456   4.3 ------	UNKNOWN
135.5374  78.4415    2.9  46.1  -22.1   1.7286   3.9 ------	UNKNOWN
237.7981  72.2336    2.6  46.9  -54.1   4.4180   4.5 ------	UNKNOWN