Analysis Summary
Notes:
- 1) No attempt has been made to eliminate the non-significant decimal places.
- 2) This batgrbproduct analysis is done using the HEASARC data.
- 3) This batgrbproduct analysis is using the flight position for the mask-weighting calculation.
======================================================================
                  BAT GRB EVENT DATA PROCESSING REPORT
    Process Script Ver: batgrbproduct v2.48
    Process Start Time: Sun Nov 13 11:58:46 EST 2022
             Host Name: batproc1
   Current Working Dir: /local/data/bat1/alien/Swift_3rdBATcatalog/event/batevent_reproc/trigger1010946
======================================================================

  Trigger: 01010946      Segment: 000

  BAT Trigger Time: 628671173.248   [s; MET]
      Trigger Stop: 628671185.408   [s; MET]
               UTC: 2020-12-03T06:52:27.160660    [includes UTCF correction]
       Where From?: TDRSS position message

  BAT
    RA: 38.0799197655575   Dec: -26.5375146309371  [deg; J2000]

     Catalogged Source?: NO
     Point Source?:      YES
     GRB Indicated?:     YES    [ by BAT flight software ]
     Image S/N Ratio:    8.4
     Image Trigger?:     NO
     Rate S/N Ratio:     14  [ if not an image trigger ]
     Image S/N Ratio:    8.4

  Analysis Position:   [ source = BAT ]
    RA: 38.0799197655575   Dec: -26.5375146309371  [deg; J2000]

  Refined Position:   [ source = BAT pre-slew burst ]
    RA: 38.0547758527732   Dec: -26.5053405517262  [deg; J2000]
        { 02h 32m 13.1s , -26d 30' 19.2" }
         +/- 1.92927508619372 [arcmin] (estimated 90% radius based on SNR)
         +/- 1.1346427448692 [arcmin] (formal 1-sigma fit error)
    SNR: 11.8963146579422

  Angular difference between the analysis and refined position is 2.355586 arcmin

  Partial Coding Fraction: 0.9140625    [ including projection effects ]

  Duration
     T90: 12.1840000152588 +/- 2.09745091306972
        Measured from: -0.856000065803528
                   to: 11.3279999494553     [s; relative to TRIGTIME]
     T50: 8.09599995613098 +/- 2.11640938663064
        Measured from: 1.62000000476837
                   to: 9.71599996089935     [s; relative to TRIGTIME]


  Fluence
     Peak Flux  (peak 1 second)
        Measured from: 11.4879999160767
                   to: 12.4879999160767     [s; relative to TRIGTIME]
     Total Fluence
        Measured from: -2.73199999332428
                   to: 12.8400000333786     [s; relative to TRIGTIME]

             Band 1     Band 2     Band 3     Band 4
              15-25      25-50     50-100    100-350     keV
 Total     0.146797   0.235692   0.111147   0.040718
           0.025001   0.026124   0.022502   0.019237 [error]
 Peak      0.025249   0.023028   0.013552  -0.000109
           0.006430   0.006584   0.005714   0.004643 [error]

     [ fluence units of on-axis counts / fully illuminated detector ]

======================================================================


====== Table of the duration information =============================

        Value   tstart    tstop
T100   15.572   -2.732   12.840
T90    12.184   -0.856   11.328
T50     8.096    1.620    9.716
Peak    1.000   11.488   12.488


====== Spectral Analysis Summary =====================================

Model      : spectral model: simple power-law (PL) and cutoff power-law (CPL)
Ph_index   : photon index: E^{Ph_index}
Ph_90err   : 90% error of the photon index
Epeak      : Epeak in keV
Epeak_90err: 90% error of Epeak
Norm       : normalization at 50 keV in both the PL model and CPL model
Nomr_90err : 90% error of the normalization
chi2       : Chi-Squared
dof        : degree of freedo

=== Time-averaged spectral analysis ===
(Best model with acceptable fit: N/A)

Model Ph_index Ph_90err_low Ph_90err_hi  Epeak  Epeak_90err_low  Epeak_90err_hi  Norm       Nomr_90err_low    Norm_90err_hi    chi2    dof
PL      -1.781    -0.267      0.251       -           -               -         1.99e-03     -3.42e-04          3.33e-04      69.650   57
CPL     -1.172    -1.039      1.447       58.059     -21.665       -58.059      4.44e-03     -4.44e-03          2.61e-02      68.780   56


=== 1-s peak spectral analysis ===
(Best model with acceptable fit: N/A)

Model Ph_index Ph_90err_low Ph_90err_hi  Epeak  Epeak_90err_low  Epeak_90err_hi  Norm       Nomr_90err_low    Norm_90err_hi    chi2    dof
PL      -2.004     -0.645     0.546       -           -               -         3.32e-03     -1.39e-03          1.32e-03      59.140   57
CPL     -1.961     -0.156     1.961       33.771     -33.760       -33.771      3.54e-03     -3.54e-03          1.58e+01      59.140   56


=== Fluence/Peak Flux Summary ===

              Model    Band1     Band2     Band3     Band4     Band5     Total
                       15-25     25-50    50-100    100-350    15-150    15-350    keV
Fluence         PL   5.16e-08  8.00e-08  9.31e-08  2.09e-07  2.86e-07  4.34e-07   erg/cm2
      90%_error_low -1.04e-08 -1.13e-08 -2.13e-08 -8.23e-08 -4.94e-08 -1.07e-07   erg/cm2
      90%_error_hi   1.08e-08  1.13e-08  2.17e-08  1.12e-07  5.08e-08  1.31e-07   erg/cm2
Peak flux       PL   2.22e-01  1.66e-01  8.29e-02  5.90e-02  4.99e-01  5.30e-01   ph/cm2/s
      90%_error_low -8.56e-02 -5.09e-02 -4.23e-02 -5.90e-02 -1.47e-01 -1.61e-01   ph/cm2/s
      90%_error_hi   8.90e-02  5.00e-02  4.63e-02  8.14e-02  1.47e-01  1.65e-01   ph/cm2/s

Fluence        CPL   4.89e-08  8.63e-08  9.15e-08  7.47e-08  2.68e-07  3.01e-07   erg/cm2
      90%_error_low -1.19e-08 -1.50e-08 -2.60e-08    N/A    -5.64e-08 -8.71e-08   erg/cm2
      90%_error_hi   1.18e-08  1.69e-08  2.37e-08    N/A     6.04e-08  1.77e-07   erg/cm2
Peak flux      CPL   2.22e-01  1.67e-01  8.30e-02  5.11e-02  4.99e-01  5.31e-01   ph/cm2/s
      90%_error_low -8.74e-02 -7.75e-02 -8.30e-02 -5.11e-02 -1.69e-01 -1.58e-01   ph/cm2/s
      90%_error_hi   8.81e-02  9.77e-02  4.61e-02  4.07e-02  1.47e-01  1.56e-01   ph/cm2/s

======================================================================
Image
Pre-slew 15.0-350.0 keV image (Event data)

#   RAcent    DECcent   POSerr    Theta     Phi              Peak Cts       SNR   Name
   38.0548   -26.5053   0.0161    16.7346  -129.5056         0.5769580     11.896 TRIG_01010946

Foreground time interval of the image:
 -2.732  12.840 (delta_t =  15.572 [sec])
Background time interval of the image:
-239.248  -2.732 (delta_t = 236.516 [sec])
Light Curves
Note: The mask-weighted lightcurves have units of either count/det or counts/sec/det, where a det is 0.4 x 0.4 = 0.16 sq cm.
Full-time range; 1 s binning
Other quick-look light curves:
- 64 ms binning (zoomed)
- 16 ms binning (zoomed)
- 8 ms binning (zoomed)
- 2 ms binning (zoomed)
- SN=5 or 10 s binning (full-time range)
- Raw light curve
Spectra
- 64 ms binning (zoomed)
- 16 ms binning (zoomed)
- 8 ms binning (zoomed)
- 2 ms binning (zoomed)
- SN=5 or 10 s binning (full-time range)
- Raw light curve
Spectra
Notes:
- 1) The fitting includes the systematic errors.
- 2) When the burst includes telescope slew time periods, the fitting uses an average response file made from multiple 5-s response files through out the slew time plus single time preiod for the non-slew times, and weighted by the total counts in the corresponding time period using addrmf. An average response file is needed becuase a spectral fit using the pre-slew DRM will introduce some errors in both a spectral shape and a normalization if the PHA file contains a lot of the slew/post-slew time interval.
- 3) For fits to more complicated models (e.g. a power-law over a cutoff power-law), the BAT team has decided to require a chi-square improvement of more than 6 for each extra dof.
Time averaged spectrum fit using the average DRM
Power-law model

Time interval is from   -2.732 sec. to   12.840 sec.

Spectral model in power-law:
------------------------------------------------------------
Parameters  : value       lower 90%   higher 90%
Photon index: -1.78051     ( -0.266671   0.251486 )
Norm@50keV  : 1.99429E-03    ( -0.000342221   0.000332643 )
------------------------------------------------------------
#Fit statistic  : Chi-Squared                   69.65     using 59 bins.
 Reduced chi-squared = 1.22193
# Null hypothesis probability of 1.21e-01 with 57 degrees of freedom

Photon flux (15-150 keV)    in 15.57 sec: 0.272775 ( -0.038544  0.038546 ) ph/cm2/s
Energy fluence (15-150 keV)             : 2.86121e-07 ( -4.93877e-08  5.08009e-08 ) ergs/cm2
Cutoff power-law model

Time interval is from   -2.732 sec. to   12.840 sec.
Spectral model in the cutoff power-law:
------------------------------------------------------------
Parameters  : value       lower 90%   higher 90%
Photon index: -1.17164     ( -1.0391   1.44735 )
Epeak [keV] : 58.0590      ( -21.6605 -58.0544 )
Norm@50keV  : 4.44138E-03    ( -0.00444236   0.0261281 )
------------------------------------------------------------
#Fit statistic  : Chi-Squared                   68.78     using 59 bins.
 Reduced chi-squared = 1.22821
# Null hypothesis probability of 1.17e-01 with 56 degrees of freedom

Photon flux (15-150 keV)    in 15.57 sec: 0.266653 ( -0.040148  0.040045 ) ph/cm2/s
Energy fluence (15-150 keV)             : 2.67552e-07 ( -5.63981e-08  6.03914e-08 ) ergs/cm2
1-s peak spectrum fit
Power-law model

Time interval is from   11.488 sec. to   12.488 sec.

Spectral model in power-law:
------------------------------------------------------------
Parameters  : value       lower 90%   higher 90%
Photon index: -2.00439     ( -0.644865   0.546461 )
Norm@50keV  : 3.31904E-03    ( -0.00139377   0.00132339 )
------------------------------------------------------------
#Fit statistic  : Chi-Squared                   59.14     using 59 bins.
 Reduced chi-squared = 1.03754
# Null hypothesis probability of 3.97e-01 with 57 degrees of freedom

Photon flux (15-150 keV)    in 1 sec: 0.498902 ( -0.147398  0.147469 ) ph/cm2/s
Energy fluence (15-150 keV)             : 3.06203e-08 ( -1.13246e-08  1.2363e-08 ) ergs/cm2
Cutoff power-law model

Time interval is from   11.488 sec. to   12.488 sec.
Spectral model in the cutoff power-law:
------------------------------------------------------------
Parameters  : value       lower 90%   higher 90%
Photon index: -1.96078     ( -0.179765   1.93694 )
Epeak [keV] : 33.7714      ( -34.8736 -34.8852 )
Norm@50keV  : 3.53871E-03    ( -0.0037001   15.801 )
------------------------------------------------------------
#Fit statistic  : Chi-Squared                   59.14     using 59 bins.
 Reduced chi-squared = 1.05607
# Null hypothesis probability of 3.62e-01 with 56 degrees of freedom

Photon flux (15-150 keV)    in 1 sec: 0.498797 ( -0.169263  0.147217 ) ph/cm2/s
Energy fluence (15-150 keV)             : 3.02294e-08 ( -1.64538e-08  1.18956e-08 ) ergs/cm2
Time-resolved spectra

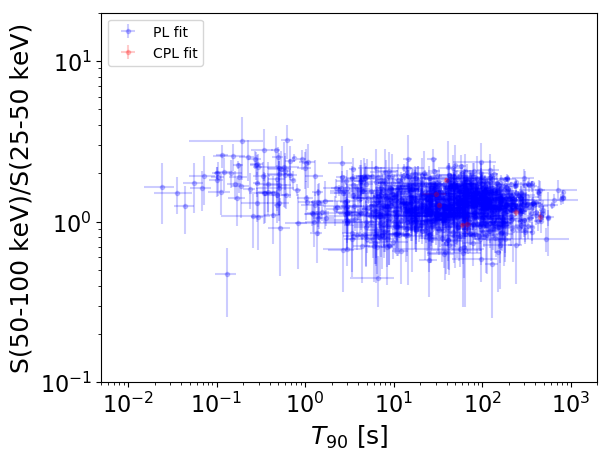
Distribution
T90 vs. Hardness ratio plot
T90                                   = N/A sec.
Hardness ratio (energy fluence ratio) = N/A
S(15-50 keV) vs. S(50-150 keV) plot

S(15-50 keV)  = N/A
S(50-150 keV) = N/A
The dash-dotted line and the dashed line traces the fluences calculated from the Band function with Epeak = 15 and 150 keV, respectively. Both lines assume a canonical values of alpha = -1 and beta = -2.5.
Mask shadow pattern
IMX = -1.912734942294735E-01, IMY = 2.319874738279152E-01
Spacecraft aspect plot

Bright source in the pre-burst/pre-slew/post-slew images
Pre-burst image of 15-350 keV band
Time interval of the image:
-239.248000 -2.732000

# RAcent  DECcent POSerr Theta    Phi  PeakCts   SNR AngSep     Name
#  [deg]    [deg]    ['] [deg]  [deg]                   [']
 76.6416  11.6244    2.4  40.8   96.6   4.4594   4.9 ------	UNKNOWN
 95.9221 -35.5798    3.1  54.9  164.7   5.3502   3.7 ------	UNKNOWN
  1.1369  33.2398    3.2  58.3   -1.9   5.1521   3.6 ------	UNKNOWN
 12.3856   2.8346    2.4  32.2  -29.6   1.3886   4.9 ------	UNKNOWN
357.1987  11.3766    2.9  49.5  -27.2   2.3843   3.9 ------	UNKNOWN
Pre-slew background subtracted image of 15-350 keV band
Time interval of the image:
-2.732000 12.840000

# RAcent  DECcent POSerr Theta    Phi  PeakCts   SNR AngSep     Name
#  [deg]    [deg]    ['] [deg]  [deg]                   [']
 65.3732  23.3064    3.8  40.6   72.2   0.5185   3.0 ------	UNKNOWN
 21.3285  15.6321    2.2  33.0   -0.6   0.2868   5.1 ------	UNKNOWN
 38.0548 -26.5054    1.0  16.7 -129.5   0.5773  11.9 ------	UNKNOWN
  4.0892  14.2548    2.1  44.8  -19.5   0.4343   5.5 ------	UNKNOWN
Post-slew image of 15-350 keV band
Time interval of the image:
103.652600 242.832000

# RAcent  DECcent POSerr Theta    Phi  PeakCts   SNR AngSep     Name
#  [deg]    [deg]    ['] [deg]  [deg]                   [']
103.4159 -35.1755    2.5  55.8  170.8   2.7319   4.7 ------	UNKNOWN
104.5366 -42.2535    2.2  55.6  179.4   2.6341   5.2 ------	UNKNOWN
358.9291   4.9963    2.5  49.3   -1.3   0.8419   4.6  306.6	UNKNOWN
  4.4735  -1.5666    2.4  40.8   -3.1   0.6289   4.7  284.4	UNKNOWN
343.0172 -10.5836    2.6  54.1  -29.1   1.8212   4.3 ------	UNKNOWN
340.6823 -12.4658    2.5  55.4  -32.4   2.8170   4.6 ------	UNKNOWN