Analysis Summary
Notes:
- 1) No attempt has been made to eliminate the non-significant decimal places.
- 2) This batgrbproduct analysis is done using the HEASARC data.
- 3) This batgrbproduct analysis is using the flight position for the mask-weighting calculation.
======================================================================
BAT GRB EVENT DATA PROCESSING REPORT
Process Script Ver: batgrbproduct v2.48
Process Start Time: Sat Jul 30 00:47:25 EDT 2022
Host Name: batproc1
Current Working Dir: /local/data/bat1/alien/Swift_3rdBATcatalog/event/batevent_reproc/trigger1011980
======================================================================
Trigger: 01011980 Segment: 000
BAT Trigger Time: 629185518.656 [s; MET]
Trigger Stop: 629185519.68 [s; MET]
UTC: 2020-12-09T05:44:52.534740 [includes UTCF correction]
Where From?: TDRSS position message
BAT
RA: 23.1056567215306 Dec: -1.76338021356593 [deg; J2000]
Catalogged Source?: NO
Point Source?: YES
GRB Indicated?: YES [ by BAT flight software ]
Image S/N Ratio: 10.19
Image Trigger?: NO
Rate S/N Ratio: 43.2434966208793 [ if not an image trigger ]
Image S/N Ratio: 10.19
Analysis Position: [ source = BAT ]
RA: 23.1056567215306 Dec: -1.76338021356593 [deg; J2000]
Refined Position: [ source = BAT pre-slew burst ]
RA: 23.0969626925961 Dec: -1.76291815011866 [deg; J2000]
{ 01h 32m 23.3s , -01d 45' 46.5" }
+/- 1.12924656720917 [arcmin] (estimated 90% radius based on SNR)
+/- 0.360167182451262 [arcmin] (formal 1-sigma fit error)
SNR: 25.5685346200828
Angular difference between the analysis and refined position is 0.522131 arcmin
Partial Coding Fraction: 0.1142578 [ including projection effects ]
Duration
T90: 48 +/- 16
Measured from: -31.6560000181198
to: 16.3439999818802 [s; relative to TRIGTIME]
T50: 16 +/- 16
Measured from: -15.6560000181198
to: 0.343999981880188 [s; relative to TRIGTIME]
Fluence
Peak Flux (peak 1 second)
Measured from: 7.84399998188019
to: 8.84399998188019 [s; relative to TRIGTIME]
Total Fluence
Measured from: -31.6560000181198
to: 32.3439999818802 [s; relative to TRIGTIME]
Band 1 Band 2 Band 3 Band 4
15-25 25-50 50-100 100-350 keV
Total 4.483643 7.638293 5.879188 1.857087
0.221120 0.234824 0.201594 0.162980 [error]
Peak 0.276333 0.535227 0.408129 0.144483
0.034294 0.043331 0.039335 0.028534 [error]
[ fluence units of on-axis counts / fully illuminated detector ]
======================================================================
====== Table of the duration information =============================
Value tstart tstop
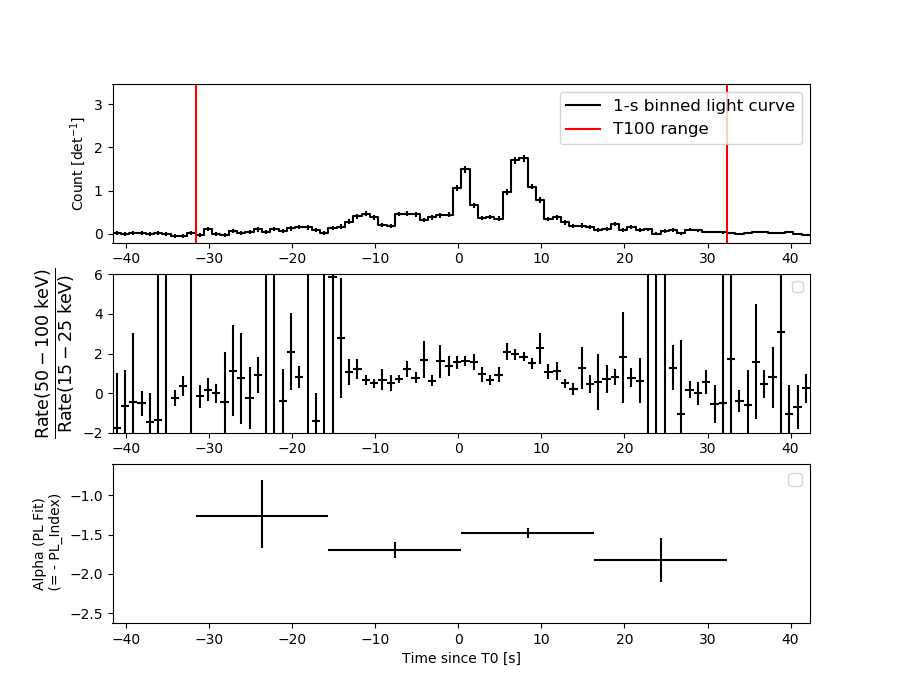
T100 64.000 -31.656 32.344
T90 48.000 -31.656 16.344
T50 16.000 -15.656 0.344
Peak 1.000 7.844 8.844
====== Spectral Analysis Summary =====================================
Model : spectral model: simple power-law (PL) and cutoff power-law (CPL)
Ph_index : photon index: E^{Ph_index}
Ph_90err : 90% error of the photon index
Epeak : Epeak in keV
Epeak_90err: 90% error of Epeak
Norm : normalization at 50 keV in both the PL model and CPL model
Nomr_90err : 90% error of the normalization
chi2 : Chi-Squared
dof : degree of freedo
=== Time-averaged spectral analysis ===
(Best model with acceptable fit: N/A)
Model Ph_index Ph_90err_low Ph_90err_hi Epeak Epeak_90err_low Epeak_90err_hi Norm Nomr_90err_low Norm_90err_hi chi2 dof
PL -1.562 -0.062 0.062 - - - 2.30e-02 -8.17e-04 8.17e-04 85.210 57
CPL -1.253 -0.245 0.259 131.950 -36.711 257.377 3.21e-02 -7.29e-03 1.01e-02 80.510 56
=== 1-s peak spectral analysis ===
(Best model with acceptable fit: N/A)
Model Ph_index Ph_90err_low Ph_90err_hi Epeak Epeak_90err_low Epeak_90err_hi Norm Nomr_90err_low Norm_90err_hi chi2 dof
PL -1.498 -0.148 0.147 - - - 9.82e-02 -8.90e-03 8.87e-03 53.270 57
CPL -1.213 -0.365 0.687 148.071 -70.662 -148.071 1.35e-01 -4.45e-02 1.52e-01 52.660 56
=== Fluence/Peak Flux Summary ===
Model Band1 Band2 Band3 Band4 Band5 Total
15-25 25-50 50-100 100-350 15-150 15-350 keV
Fluence PL 2.00e-06 3.53e-06 4.78e-06 1.33e-05 1.39e-05 2.37e-05 erg/cm2
90%_error_low -1.35e-07 -1.45e-07 -2.01e-07 -1.19e-06 -5.05e-07 -1.32e-06 erg/cm2
90%_error_hi 1.38e-07 1.44e-07 2.00e-07 1.27e-06 5.05e-07 1.37e-06 erg/cm2
Peak flux PL 4.03e+00 4.06e+00 2.88e+00 3.24e+00 1.23e+01 1.42e+01 ph/cm2/s
90%_error_low -6.21e-01 -4.06e-01 -3.11e-01 -6.55e-01 -1.15e+00 -1.28e+00 ph/cm2/s
90%_error_hi 6.50e-01 4.02e-01 3.07e-01 7.38e-01 1.15e+00 1.28e+00 ph/cm2/s
Fluence CPL 1.86e-06 3.62e-06 4.93e-06 9.02e-06 1.37e-05 1.94e-05 erg/cm2
90%_error_low -1.66e-07 -1.62e-07 -2.33e-07 -2.30e-06 -5.33e-07 -2.32e-06 erg/cm2
90%_error_hi 1.70e-07 1.63e-07 2.35e-07 3.26e-06 5.32e-07 3.23e-06 erg/cm2
Peak flux CPL 2.96e+00 1.88e+00 8.04e-01 6.09e-01 5.90e+00 6.16e+00 ph/cm2/s
90%_error_low -9.12e-01 -5.81e-01 -4.10e-01 8.33e-02 -1.46e+00 -1.72e+00 ph/cm2/s
90%_error_hi 9.51e-01 7.82e-01 4.72e-01 6.11e-01 2.07e+00 2.27e+00 ph/cm2/s
======================================================================
Image
Pre-slew 15.0-350.0 keV image (Event data)

#   RAcent    DECcent   POSerr    Theta     Phi              Peak Cts       SNR   Name
   23.0970    -1.7629   0.0075    50.8417   169.3183        18.3744612     25.569 TRIG_01011980

Foreground time interval of the image:
-31.656  11.445 (delta_t =  43.101 [sec])
Background time interval of the image:
-199.155 -31.656 (delta_t = 167.499 [sec])
Light Curves
Note: The mask-weighted lightcurves have units of either count/det or counts/sec/det, where a det is 0.4 x 0.4 = 0.16 sq cm.
Full-time range; 1 s binning
Other quick-look light curves:
- 64 ms binning (zoomed)
- 16 ms binning (zoomed)
- 8 ms binning (zoomed)
- 2 ms binning (zoomed)
- SN=5 or 10 s binning (full-time range)
- Raw light curve
Spectra
- 64 ms binning (zoomed)
- 16 ms binning (zoomed)
- 8 ms binning (zoomed)
- 2 ms binning (zoomed)
- SN=5 or 10 s binning (full-time range)
- Raw light curve
Spectra
Notes:
- 1) The fitting includes the systematic errors.
- 2) When the burst includes telescope slew time periods, the fitting uses an average response file made from multiple 5-s response files through out the slew time plus single time preiod for the non-slew times, and weighted by the total counts in the corresponding time period using addrmf. An average response file is needed becuase a spectral fit using the pre-slew DRM will introduce some errors in both a spectral shape and a normalization if the PHA file contains a lot of the slew/post-slew time interval.
- 3) For fits to more complicated models (e.g. a power-law over a cutoff power-law), the BAT team has decided to require a chi-square improvement of more than 6 for each extra dof.
Time averaged spectrum fit using the average DRM
Power-law model
Time interval is from  -31.656 sec. to   32.344 sec.

Spectral model in power-law:
------------------------------------------------------------
Parameters  : value       lower 90%   higher 90%
Photon index: -1.56221     ( -0.0619481   0.0620561 )
Norm@50keV  : 2.30320E-02    ( -0.000816966   0.000816966 )
------------------------------------------------------------
#Fit statistic  : Chi-Squared                   85.21     using 59 bins.
 Reduced chi-squared = 1.49491
# Null hypothesis probability of 9.13e-03 with 57 degrees of freedom

Photon flux (15-150 keV)    in 64 sec: 2.92621 ( -0.11674  0.11713 ) ph/cm2/s
Energy fluence (15-150 keV)             : 1.38551e-05 ( -5.04529e-07  5.05079e-07 ) ergs/cm2
Cutoff power-law model

Time interval is from  -31.656 sec. to   32.344 sec.
Spectral model in the cutoff power-law:
------------------------------------------------------------
Parameters  : value       lower 90%   higher 90%
Photon index: -1.253     ( -0.245156   0.25931 )
Epeak [keV] : 131.950      ( -36.7121 257.376 )
Norm@50keV  : 3.21431E-02    ( -0.00729489   0.0100702 )
------------------------------------------------------------
#Fit statistic  : Chi-Squared                   80.51     using 59 bins.
 Reduced chi-squared = 1.43768
# Null hypothesis probability of 1.76e-02 with 56 degrees of freedom

Photon flux (15-150 keV)    in 64 sec: 2.87527 ( -0.12274  0.12322 ) ph/cm2/s
Energy fluence (15-150 keV)             : 1.3654e-05 ( -5.33226e-07  5.31658e-07 ) ergs/cm2
1-s peak spectrum fit
Power-law model
Time interval is from    7.844 sec. to    8.844 sec.

Spectral model in power-law:
------------------------------------------------------------
Parameters  : value       lower 90%   higher 90%
Photon index: -1.49792     ( -0.148038   0.146628 )
Norm@50keV  : 9.81969E-02    ( -0.0088976   0.00887446 )
------------------------------------------------------------
#Fit statistic  : Chi-Squared                   53.27     using 59 bins.
 Reduced chi-squared = 0.934561
# Null hypothesis probability of 6.16e-01 with 57 degrees of freedom

Photon flux (15-150 keV)    in 1 sec: 12.2523 ( -1.1524  1.1543 ) ph/cm2/s
Energy fluence (15-150 keV)             : 9.31987e-07 ( -8.9545e-08  8.98697e-08 ) ergs/cm2
Cutoff power-law model

Time interval is from    7.844 sec. to    8.844 sec.
Spectral model in the cutoff power-law:
------------------------------------------------------------
Parameters  : value       lower 90%   higher 90%
Photon index: -1.21322     ( -0.365227   0.686711 )
Epeak [keV] : 148.071      ( -70.6743 -148.084 )
Norm@50keV  : 0.135207    ( -0.0444706   0.151563 )
------------------------------------------------------------
#Fit statistic  : Chi-Squared                   52.66     using 59 bins.
 Reduced chi-squared = 0.940357
# Null hypothesis probability of 6.02e-01 with 56 degrees of freedom

Photon flux (15-150 keV)    in 1 sec: 5.89702 ( -1.45523  2.06523 ) ph/cm2/s
Energy fluence (15-150 keV)             : 9.24358e-07 ( -4.97771e-08  9.18673e-08 ) ergs/cm2
Time-resolved spectra
Distribution
T90 vs. Hardness ratio plot
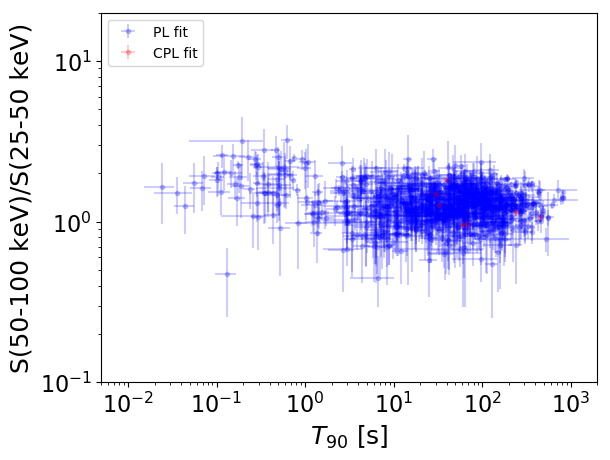
T90                                   = N/A sec.
Hardness ratio (energy fluence ratio) = N/A
S(15-50 keV) vs. S(50-150 keV) plot
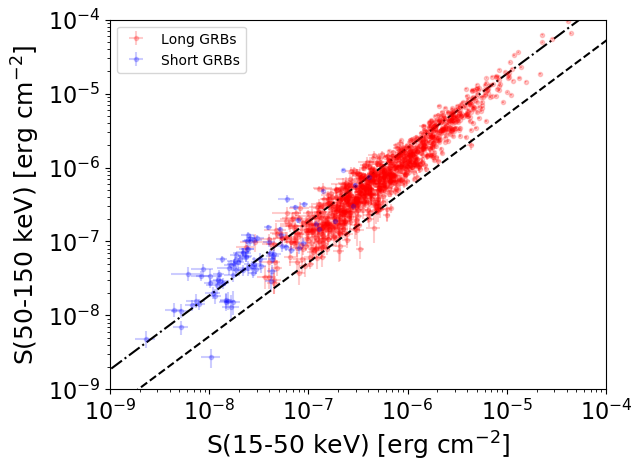
S(15-50 keV)  = N/A
S(50-150 keV) = N/A
The dash-dotted line and the dashed line traces the fluences calculated from the Band function with Epeak = 15 and 150 keV, respectively. Both lines assume a canonical values of alpha = -1 and beta = -2.5.
Mask shadow pattern
IMX = -1.206666607996190E+00, IMY = -2.276023443369052E-01
Spacecraft aspect plot

Bright source in the pre-burst/pre-slew/post-slew images
Pre-burst image of 15-350 keV band
Time interval of the image:
-199.155400 -31.656000

# RAcent  DECcent POSerr Theta    Phi  PeakCts   SNR AngSep     Name
#  [deg]    [deg]    ['] [deg]  [deg]                   [']
 83.6156  22.0255    1.1  34.2   69.1   6.8335  10.4    1.2	Crab
 74.7803   7.7557    2.8  40.8   94.4   5.7616   4.2 ------	UNKNOWN
 84.7340  26.3127    0.3  32.1   62.0  20.3222  33.9 ------	UNKNOWN
 27.8804  -5.7572    2.8  52.6  161.7   6.3573   4.2 ------	UNKNOWN
125.4569  42.4944    2.7  53.2   15.4   4.8951   4.3 ------	UNKNOWN
 17.3725   7.3799    2.5  45.8 -177.9   3.1126   4.7 ------	UNKNOWN
  9.2292  30.9497    3.0  34.8 -143.0   1.6952   3.9 ------	UNKNOWN
351.3429  25.3563    2.3  51.0 -137.1   7.6807   5.1 ------	UNKNOWN
Pre-slew background subtracted image of 15-350 keV band
Time interval of the image:
-31.656000 11.444600

# RAcent  DECcent POSerr Theta    Phi  PeakCts   SNR AngSep     Name
#  [deg]    [deg]    ['] [deg]  [deg]                   [']
 83.5220  21.9264    4.5  34.2   69.3   0.7458   2.6    8.1	Crab
 55.1593  15.1343    2.7  27.7  123.3   0.8188   4.3 ------	UNKNOWN
 23.0970  -1.7629    0.5  50.8  169.3  18.3751  25.6 ------	UNKNOWN
 36.6936  33.8978    2.5  14.0 -171.1   0.5397   4.7 ------	UNKNOWN
128.6595  71.4031    2.5  46.4  -21.8   0.9217   4.6 ------	UNKNOWN
Post-slew image of 15-350 keV band
Time interval of the image:
99.444590 962.427100

# RAcent  DECcent POSerr Theta    Phi  PeakCts   SNR AngSep     Name
#  [deg]    [deg]    ['] [deg]  [deg]                   [']
352.9920  20.7673    3.8  37.1  -22.1   2.9607   3.1 ------	UNKNOWN
348.3534   1.5462    3.5  34.9  -55.9   4.2735   3.3 ------	UNKNOWN
  2.6558 -47.7142    3.3  49.3 -133.0  12.7459   3.5 ------	UNKNOWN
359.8755 -45.1308    2.5  48.0 -129.1  15.9859   4.7 ------	UNKNOWN