Analysis Summary
Notes:
- 1) No attempt has been made to eliminate the non-significant decimal places.
- 2) This batgrbproduct analysis is done using the HEASARC data.
- 3) This batgrbproduct analysis is using the flight position for the mask-weighting calculation.
======================================================================
BAT GRB EVENT DATA PROCESSING REPORT
Process Script Ver: batgrbproduct v2.48
Process Start Time: Sat Jul 30 00:44:12 EDT 2022
Host Name: batproc1
Current Working Dir: /local/data/bat1/alien/Swift_3rdBATcatalog/event/batevent_reproc/trigger1013243
======================================================================
Trigger: 01013243 Segment: 000
BAT Trigger Time: 629852877.888 [s; MET]
Trigger Stop: 629852878.912 [s; MET]
UTC: 2020-12-16T23:07:31.722580 [includes UTCF correction]
Where From?: TDRSS position message
BAT
RA: 16.3578584277706 Dec: 16.5367566216723 [deg; J2000]
Catalogged Source?: NO
Point Source?: YES
GRB Indicated?: YES [ by BAT flight software ]
Image S/N Ratio: 15.28
Image Trigger?: NO
Rate S/N Ratio: 69.3181073024935 [ if not an image trigger ]
Image S/N Ratio: 15.28
Analysis Position: [ source = BAT ]
RA: 16.3578584277706 Dec: 16.5367566216723 [deg; J2000]
Refined Position: [ source = BAT pre-slew burst ]
RA: 16.3642081338901 Dec: 16.5373096769384 [deg; J2000]
{ 01h 05m 27.4s , +16d 32' 14.3" }
+/- 0.838171682628201 [arcmin] (estimated 90% radius based on SNR)
+/- 0.349467130903331 [arcmin] (formal 1-sigma fit error)
SNR: 39.1419707635121
Angular difference between the analysis and refined position is 0.366728 arcmin
Partial Coding Fraction: 0.1855469 [ including projection effects ]
Duration
T90: 48 +/- 16
Measured from: -15.8880000114441
to: 32.1119999885559 [s; relative to TRIGTIME]
T50: 16 +/- 16
Measured from: 0.111999988555908
to: 16.1119999885559 [s; relative to TRIGTIME]
Fluence
Peak Flux (peak 1 second)
Measured from: 23.6119999885559
to: 24.6119999885559 [s; relative to TRIGTIME]
Total Fluence
Measured from: -15.8880000114441
to: 64.1119999885559 [s; relative to TRIGTIME]
Band 1 Band 2 Band 3 Band 4
15-25 25-50 50-100 100-350 keV
Total 13.011278 21.400002 19.895172 7.022695
0.215753 0.248750 0.236082 0.185725 [error]
Peak 0.497473 0.712465 0.507836 0.174677
0.031855 0.037310 0.033662 0.024588 [error]
[ fluence units of on-axis counts / fully illuminated detector ]
======================================================================
====== Table of the duration information =============================
Value tstart tstop
T100 80.000 -15.888 64.112
T90 48.000 -15.888 32.112
T50 16.000 0.112 16.112
Peak 1.000 23.612 24.612
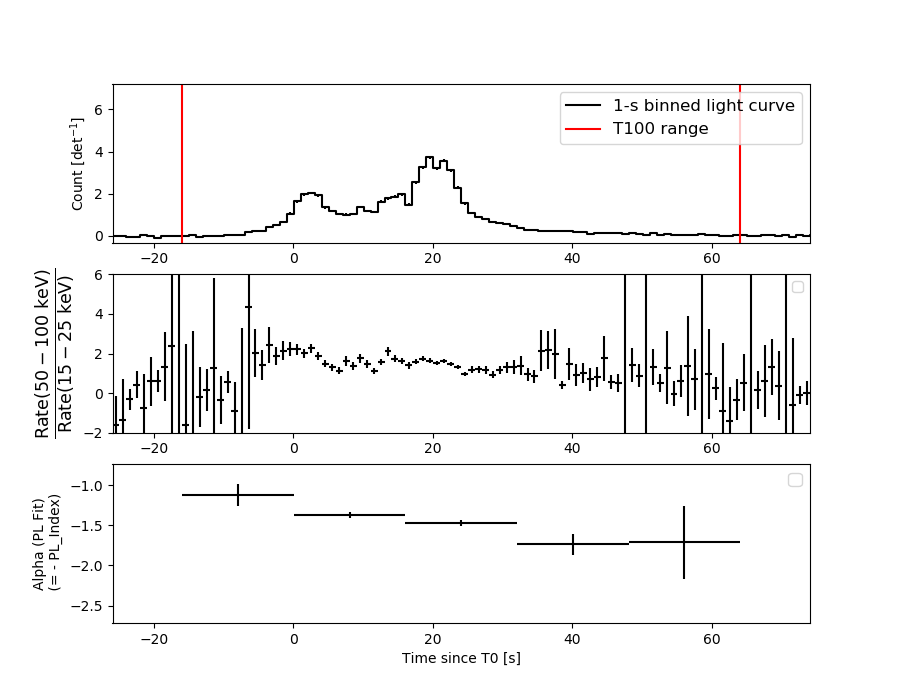
====== Spectral Analysis Summary =====================================
Model : spectral model: simple power-law (PL) and cutoff power-law (CPL)
Ph_index : photon index: E^{Ph_index}
Ph_90err : 90% error of the photon index
Epeak : Epeak in keV
Epeak_90err: 90% error of Epeak
Norm : normalization at 50 keV in both the PL model and CPL model
Nomr_90err : 90% error of the normalization
chi2 : Chi-Squared
dof : degree of freedo
=== Time-averaged spectral analysis ===
(Best model with acceptable fit: N/A)
Model Ph_index Ph_90err_low Ph_90err_hi Epeak Epeak_90err_low Epeak_90err_hi Norm Nomr_90err_low Norm_90err_hi chi2 dof
PL -1.435 -0.030 0.030 - - - 5.88e-02 -9.95e-04 9.94e-04 41.820 57
CPL -1.323 -0.090 0.124 379.489 -165.530 -379.489 6.52e-02 -6.63e-03 7.82e-03 39.390 56
=== 1-s peak spectral analysis ===
(Best model with acceptable fit: N/A)
Model Ph_index Ph_90err_low Ph_90err_hi Epeak Epeak_90err_low Epeak_90err_hi Norm Nomr_90err_low Norm_90err_hi chi2 dof
PL -1.747 -0.104 0.102 - - - 1.34e-01 -8.34e-03 8.30e-03 49.210 57
CPL -1.371 -0.404 0.443 85.627 -22.935 -85.627 2.06e-01 -7.45e-02 1.34e-01 46.720 56
=== Fluence/Peak Flux Summary ===
Model Band1 Band2 Band3 Band4 Band5 Total
15-25 25-50 50-100 100-350 15-150 15-350 keV
Fluence PL 5.65e-06 1.08e-05 1.60e-05 5.08e-05 4.51e-05 8.32e-05 erg/cm2
90%_error_low -2.07e-07 -2.37e-07 -2.76e-07 -2.02e-06 -7.31e-07 -2.09e-06 erg/cm2
90%_error_hi 2.10e-07 2.36e-07 2.76e-07 2.08e-06 7.30e-07 2.13e-06 erg/cm2
Peak flux PL 6.97e+00 6.06e+00 3.61e+00 3.24e+00 1.80e+01 1.99e+01 ph/cm2/s
90%_error_low -6.91e-01 -3.84e-01 -2.83e-01 -4.82e-01 -1.13e+00 -1.19e+00 ph/cm2/s
90%_error_hi 7.12e-01 3.82e-01 2.81e-01 5.25e-01 1.13e+00 1.19e+00 ph/cm2/s
Fluence CPL 5.45e-06 1.08e-05 1.62e-05 4.51e-05 4.50e-05 7.76e-05 erg/cm2
90%_error_low -2.89e-07 -2.40e-07 -3.60e-07 -5.43e-06 -7.55e-07 -5.43e-06 erg/cm2
90%_error_hi 2.94e-07 2.40e-07 3.61e-07 6.18e-06 7.53e-07 4.55e-06 erg/cm2
Peak flux CPL 6.50e+00 6.28e+00 3.75e+00 2.21e+00 1.78e+01 1.87e+01 ph/cm2/s
90%_error_low -8.42e-01 -4.48e-01 -3.23e-01 -7.46e-01 -1.17e+00 -1.45e+00 ph/cm2/s
90%_error_hi 8.63e-01 4.56e-01 3.30e-01 1.16e+00 1.17e+00 1.63e+00 ph/cm2/s
======================================================================
Image
Pre-slew 15.0-350.0 keV image (Event data)
#   RAcent    DECcent   POSerr    Theta     Phi              Peak Cts       SNR   Name
   16.3642    16.5373   0.0049    52.0287   -21.5613        65.8487229     39.142 TRIG_01013243

Foreground time interval of the image:
-15.888  64.112 (delta_t =  80.000 [sec])
Background time interval of the image:
-64.787 -15.888 (delta_t =  48.899 [sec])
Light Curves
Note: The mask-weighted lightcurves have units of either count/det or counts/sec/det, where a det is 0.4 x 0.4 = 0.16 sq cm.
Full-time range; 1 s binning
Other quick-look light curves:
- 64 ms binning (zoomed)
- 16 ms binning (zoomed)
- 8 ms binning (zoomed)
- 2 ms binning (zoomed)
- SN=5 or 10 s binning (full-time range)
- Raw light curve
Spectra
- 64 ms binning (zoomed)
- 16 ms binning (zoomed)
- 8 ms binning (zoomed)
- 2 ms binning (zoomed)
- SN=5 or 10 s binning (full-time range)
- Raw light curve
Spectra
Notes:
- 1) The fitting includes the systematic errors.
- 2) When the burst includes telescope slew time periods, the fitting uses an average response file made from multiple 5-s response files through out the slew time plus single time preiod for the non-slew times, and weighted by the total counts in the corresponding time period using addrmf. An average response file is needed becuase a spectral fit using the pre-slew DRM will introduce some errors in both a spectral shape and a normalization if the PHA file contains a lot of the slew/post-slew time interval.
- 3) For fits to more complicated models (e.g. a power-law over a cutoff power-law), the BAT team has decided to require a chi-square improvement of more than 6 for each extra dof.
Time averaged spectrum fit using the average DRM
Power-law model
Time interval is from  -15.888 sec. to   64.112 sec.

Spectral model in power-law:
------------------------------------------------------------
Parameters  : value       lower 90%   higher 90%
Photon index: -1.43475     ( -0.0300528   0.0301378 )
Norm@50keV  : 5.87778E-02    ( -0.000995505   0.000994116 )
------------------------------------------------------------
#Fit statistic  : Chi-Squared                   41.82     using 59 bins.
 Reduced chi-squared = 0.733684
# Null hypothesis probability of 9.34e-01 with 57 degrees of freedom

Photon flux (15-150 keV)    in 80 sec: 7.21670 ( -0.1462  0.14677 ) ph/cm2/s
Energy fluence (15-150 keV)             : 4.51315e-05 ( -7.30802e-07  7.30163e-07 ) ergs/cm2
Cutoff power-law model
Time interval is from  -15.888 sec. to   64.112 sec.
Spectral model in the cutoff power-law:
------------------------------------------------------------
Parameters  : value       lower 90%   higher 90%
Photon index: -1.32336     ( -0.0898119   0.124266 )
Epeak [keV] : 379.489      ( -166.024 -379.982 )
Norm@50keV  : 6.52175E-02    ( -0.00661928   0.00782546 )
------------------------------------------------------------
#Fit statistic  : Chi-Squared                   39.39     using 59 bins.
 Reduced chi-squared = 0.703393
# Null hypothesis probability of 9.55e-01 with 56 degrees of freedom

Photon flux (15-150 keV)    in 80 sec: 3.53302 ( -0.27854  0.41676 ) ph/cm2/s
Energy fluence (15-150 keV)             : 4.49614e-05 ( -7.54547e-07  7.5264e-07 ) ergs/cm2
1-s peak spectrum fit
Power-law model
Time interval is from   23.612 sec. to   24.612 sec.

Spectral model in power-law:
------------------------------------------------------------
Parameters  : value       lower 90%   higher 90%
Photon index: -1.74652     ( -0.103787   0.101919 )
Norm@50keV  : 0.133576    ( -0.00833673   0.00829755 )
------------------------------------------------------------
#Fit statistic  : Chi-Squared                   49.21     using 59 bins.
 Reduced chi-squared = 0.863333
# Null hypothesis probability of 7.59e-01 with 57 degrees of freedom

Photon flux (15-150 keV)    in 1 sec: 18.0394 ( -1.1323  1.1346 ) ph/cm2/s
Energy fluence (15-150 keV)             : 1.23299e-06 ( -7.9032e-08  7.93005e-08 ) ergs/cm2
Cutoff power-law model
Time interval is from   23.612 sec. to   24.612 sec.
Spectral model in the cutoff power-law:
------------------------------------------------------------
Parameters  : value       lower 90%   higher 90%
Photon index: -1.3712     ( -0.403578   0.443034 )
Epeak [keV] : 85.6267      ( -22.9349 -85.6268 )
Norm@50keV  : 0.205916    ( -0.0745458   0.133715 )
------------------------------------------------------------
#Fit statistic  : Chi-Squared                   46.72     using 59 bins.
 Reduced chi-squared = 0.834286
# Null hypothesis probability of 8.07e-01 with 56 degrees of freedom

Photon flux (15-150 keV)    in 1 sec: 17.7512 ( -1.1717  1.1748 ) ph/cm2/s
Energy fluence (15-150 keV)             : 1.21143e-06 ( -8.35575e-08  8.32129e-08 ) ergs/cm2
Time-resolved spectra
Distribution
T90 vs. Hardness ratio plot
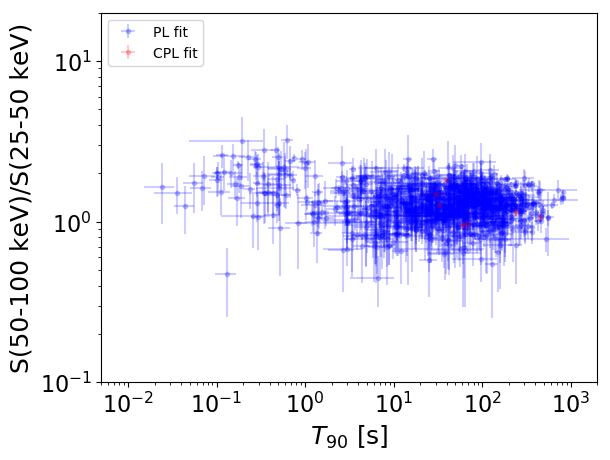
T90                                   = N/A sec.
Hardness ratio (energy fluence ratio) = N/A
S(15-50 keV) vs. S(50-150 keV) plot
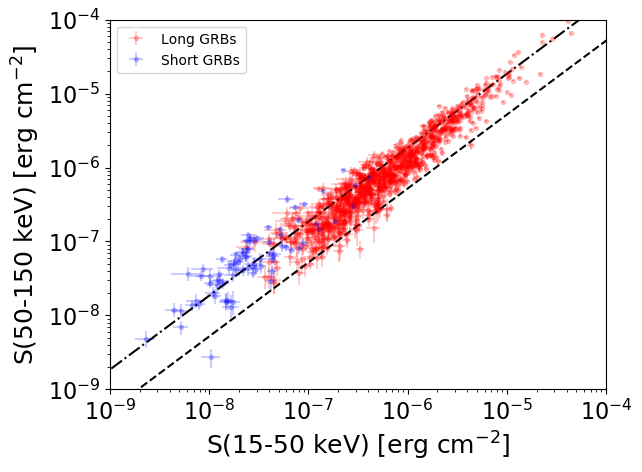
S(15-50 keV)  = N/A
S(50-150 keV) = N/A
The dash-dotted line and the dashed line traces the fluences calculated from the Band function with Epeak = 15 and 150 keV, respectively. Both lines assume a canonical values of alpha = -1 and beta = -2.5.
Mask shadow pattern
IMX = 1.191606335249240E+00, IMY = 4.708600849302003E-01
Spacecraft aspect plot
Bright source in the pre-burst/pre-slew/post-slew images
Pre-burst image of 15-350 keV band
Time interval of the image:
-64.787400 -15.888000

# RAcent  DECcent POSerr Theta    Phi  PeakCts   SNR AngSep     Name
#  [deg]    [deg]    ['] [deg]  [deg]                   [']
 83.6412  22.0336    0.7  22.4   91.8   2.2309  16.4    1.2	Crab
 84.7449  26.3161    0.8  26.2   86.7   2.4201  15.3 ------	UNKNOWN
 21.5259  15.7663    3.4  47.0  -21.8   0.7208   3.4 ------	UNKNOWN
 67.5302 -35.4626    2.8  40.8 -127.5   0.9369   4.2 ------	UNKNOWN
 10.4449  12.4666    3.2  57.5  -27.0   2.5209   3.7 ------	UNKNOWN
 73.5303 -43.5646    4.2  49.1 -133.4   1.4418   2.8 ------	UNKNOWN
Pre-slew background subtracted image of 15-350 keV band
Time interval of the image:
-15.888000 64.112000

# RAcent  DECcent POSerr Theta    Phi  PeakCts   SNR AngSep     Name
#  [deg]    [deg]    ['] [deg]  [deg]                   [']
 83.4850  22.0597    4.9  22.3   91.5  -1.0470  -2.3    8.7	Crab
 81.9503  40.5093    3.5  37.3   68.9   2.1667   3.3 ------	UNKNOWN
 55.4331  50.9856    2.8  46.9   40.5   3.9919   4.2 ------	UNKNOWN
113.0326   7.4604    3.3  44.5  136.4   3.2678   3.6 ------	UNKNOWN
113.6999 -10.7283    2.6  48.0  161.2   3.5870   4.4 ------	UNKNOWN
 90.7644   8.6557    2.4  22.6  131.8   2.0142   4.9 ------	UNKNOWN
 79.9221   8.8076    4.1  12.1  124.2   1.0963   2.9 ------	UNKNOWN
 70.1673   8.8767    4.1   4.0   79.4   1.0914   2.8 ------	UNKNOWN
 15.2071  36.5044    2.5  57.6    2.0   9.6282   4.5 ------	UNKNOWN
116.7305 -27.2148    3.1  57.0  179.1   7.2170   3.7 ------	UNKNOWN
 67.8460 -12.7408    2.3  18.1 -127.1   2.2652   5.0 ------	UNKNOWN
 76.1814 -21.9285    2.8  28.3 -144.0   2.2308   4.1 ------	UNKNOWN
 16.3642  16.5373    0.3  52.0  -21.6  65.8426  39.1 ------	UNKNOWN
Post-slew image of 15-350 keV band
Time interval of the image:
626.412590 962.222000

# RAcent  DECcent POSerr Theta    Phi  PeakCts   SNR AngSep     Name
#  [deg]    [deg]    ['] [deg]  [deg]                   [']
139.2370 -32.3417    3.7  56.8   -1.8   4.1336   3.1 ------	UNKNOWN
154.7482 -30.6369    3.6  56.5  -17.7   4.0381   3.2 ------	UNKNOWN
168.2581   1.0350    2.6  34.9  -56.0   2.4006   4.5 ------	UNKNOWN