Analysis Summary
Notes:
- 1) No attempt has been made to eliminate the non-significant decimal places.
- 2) This batgrbproduct analysis is done using the HEASARC data.
- 3) This batgrbproduct analysis is using the flight position for the mask-weighting calculation.
======================================================================
                  BAT GRB EVENT DATA PROCESSING REPORT
    Process Script Ver: batgrbproduct v2.48
    Process Start Time: Sat Jul 30 00:42:24 EDT 2022
             Host Name: batproc1
   Current Working Dir: /local/data/bat1/alien/Swift_3rdBATcatalog/event/batevent_reproc/trigger1013852
======================================================================

  Trigger: 01013852      Segment: 000

  BAT Trigger Time: 630227367.616   [s; MET]
      Trigger Stop: 630227375.808   [s; MET]
               UTC: 2020-12-21T07:09:01.425800    [includes UTCF correction]
       Where From?: TDRSS position message

  BAT
    RA: 214.477529644785   Dec: -45.4108092626907  [deg; J2000]

     Catalogged Source?: NO
     Point Source?:      YES
     GRB Indicated?:     YES    [ by BAT flight software ]
     Image S/N Ratio:    7.86
     Image Trigger?:     NO
     Rate S/N Ratio:     8.60232526704263  [ if not an image trigger ]
     Image S/N Ratio:    7.86

  Analysis Position:   [ source = BAT ]
    RA: 214.477529644785   Dec: -45.4108092626907  [deg; J2000]

  Refined Position:   [ source = BAT pre-slew burst ]
    RA: 214.487896390161   Dec: -45.4056921072394  [deg; J2000]
        { 14h 17m 57.1s , -45d 24' 20.5" }
         +/- 1.63002892363785 [arcmin] (estimated 90% radius based on SNR)
         +/- 0.881604672008873 [arcmin] (formal 1-sigma fit error)
    SNR: 15.1349929098167

  Angular difference between the analysis and refined position is 0.533812 arcmin

  Partial Coding Fraction: 0.4296875    [ including projection effects ]

  Duration
     T90: 44.3159999847412 +/- 5.94633892162459
        Measured from: -6.1360000371933
                   to: 38.1799999475479     [s; relative to TRIGTIME]
     T50: 19.8719999790192 +/- 4.85144844739813
        Measured from: 2.01199996471405
                   to: 21.8839999437332     [s; relative to TRIGTIME]


  Fluence
     Peak Flux  (peak 1 second)
        Measured from: 4.15599989891052
                   to: 5.15599989891052     [s; relative to TRIGTIME]
     Total Fluence
        Measured from: -7.63200008869171
                   to: 41.7119998931885     [s; relative to TRIGTIME]

             Band 1     Band 2     Band 3     Band 4
              15-25      25-50     50-100    100-350     keV
 Total     0.622504   1.026596   0.886449   0.163455
           0.082697   0.081126   0.072742   0.065376 [error]
 Peak      0.037167   0.039303   0.037257   0.017091
           0.011671   0.011832   0.010819   0.008773 [error]

     [ fluence units of on-axis counts / fully illuminated detector ]

======================================================================


====== Table of the duration information =============================

        Value   tstart    tstop
T100   49.344   -7.632   41.712
T90    44.316   -6.136   38.180
T50    19.872    2.012   21.884
Peak    1.000    4.156    5.156


====== Spectral Analysis Summary =====================================

Model      : spectral model: simple power-law (PL) and cutoff power-law (CPL)
Ph_index   : photon index: E^{Ph_index}
Ph_90err   : 90% error of the photon index
Epeak      : Epeak in keV
Epeak_90err: 90% error of Epeak
Norm       : normalization at 50 keV in both the PL model and CPL model
Nomr_90err : 90% error of the normalization
chi2       : Chi-Squared
dof        : degree of freedo

=== Time-averaged spectral analysis ===
(Best model with acceptable fit: N/A)

Model Ph_index Ph_90err_low Ph_90err_hi  Epeak  Epeak_90err_low  Epeak_90err_hi  Norm       Nomr_90err_low    Norm_90err_hi    chi2    dof
PL      -1.398    -0.149      0.150       -           -               -         4.03e-03     -3.44e-04          3.44e-04      45.430   57
CPL     -0.858    -0.589      0.698      113.077     -36.511      -113.077      7.27e-03     -3.35e-03          7.89e-03      43.110   56


=== 1-s peak spectral analysis ===
(Best model with acceptable fit: N/A)

Model Ph_index Ph_90err_low Ph_90err_hi  Epeak  Epeak_90err_low  Epeak_90err_hi  Norm       Nomr_90err_low    Norm_90err_hi    chi2    dof
PL      -1.451     -0.501     0.495       -           -               -         8.19e-03     -2.38e-03          2.37e-03      71.480   57
CPL     -0.535     -1.751     5.223       83.429     -36.749       -83.429      2.29e-02     -2.29e-02          5.34e+00      71.070   56


=== Fluence/Peak Flux Summary ===

              Model    Band1     Band2     Band3     Band4     Band5     Total
                       15-25     25-50    50-100    100-350    15-150    15-350    keV
Fluence         PL   2.31e-07  4.51e-07  6.85e-07  2.26e-06  1.92e-06  3.63e-06   erg/cm2
      90%_error_low -3.58e-08 -4.34e-08 -7.16e-08 -4.79e-07 -1.76e-07 -5.32e-07   erg/cm2
      90%_error_hi   3.76e-08  4.29e-08  7.10e-08  5.61e-07  1.78e-07  5.98e-07   erg/cm2
Peak flux       PL   3.22e-01  3.33e-01  2.44e-01  2.87e-01  1.01e+00  1.19e+00   ph/cm2/s
      90%_error_low -1.51e-01 -1.09e-01 -8.56e-02 -1.62e-01 -3.02e-01 -3.44e-01   ph/cm2/s
      90%_error_hi   1.76e-01  1.06e-01  8.31e-02  2.47e-01  3.04e-01  3.46e-01   ph/cm2/s

Fluence        CPL   2.06e-07  4.71e-07  7.16e-07  1.13e-06  1.86e-06  2.53e-06   erg/cm2
      90%_error_low -4.45e-08 -4.94e-08 -8.07e-08 -5.66e-07 -1.93e-07 -5.93e-07   erg/cm2
      90%_error_hi   4.61e-08  5.07e-08  8.28e-08  8.24e-07  1.92e-07  9.82e-07   erg/cm2
Peak flux      CPL   2.66e-01  3.59e-01  2.66e-01  1.25e-01  9.73e-01  1.02e+00   ph/cm2/s
      90%_error_low -2.66e-01 -1.25e-01 -1.00e-01 -1.25e-01 -3.40e-01 -3.82e-01   ph/cm2/s
      90%_error_hi   2.16e-01  1.37e-01  1.11e-01  2.21e-01  3.20e-01  4.10e-01   ph/cm2/s

======================================================================
Image
Pre-slew 15.0-350.0 keV image (Event data)
#   RAcent    DECcent   POSerr    Theta     Phi              Peak Cts       SNR   Name
  214.4879   -45.4057   0.0127    40.3634   -33.9395         2.7520213     15.135 TRIG_01013852

Foreground time interval of the image:
 -7.632  41.712 (delta_t =  49.344 [sec])
Background time interval of the image:
-239.616  -7.632 (delta_t = 231.984 [sec])
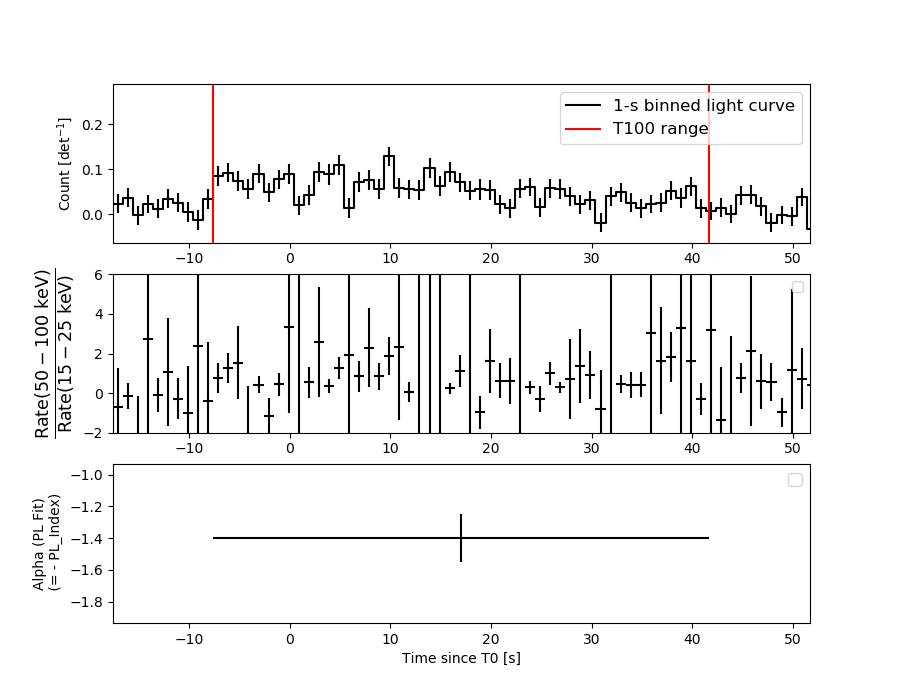
Light Curves
Note: The mask-weighted lightcurves have units of either count/det or counts/sec/det, where a det is 0.4 x 0.4 = 0.16 sq cm.
Full-time range; 1 s binning
Other quick-look light curves:
- 64 ms binning (zoomed)
- 16 ms binning (zoomed)
- 8 ms binning (zoomed)
- 2 ms binning (zoomed)
- SN=5 or 10 s binning (full-time range)
- Raw light curve
Spectra
- 64 ms binning (zoomed)
- 16 ms binning (zoomed)
- 8 ms binning (zoomed)
- 2 ms binning (zoomed)
- SN=5 or 10 s binning (full-time range)
- Raw light curve
Spectra
Notes:
- 1) The fitting includes the systematic errors.
- 2) When the burst includes telescope slew time periods, the fitting uses an average response file made from multiple 5-s response files through out the slew time plus single time preiod for the non-slew times, and weighted by the total counts in the corresponding time period using addrmf. An average response file is needed becuase a spectral fit using the pre-slew DRM will introduce some errors in both a spectral shape and a normalization if the PHA file contains a lot of the slew/post-slew time interval.
- 3) For fits to more complicated models (e.g. a power-law over a cutoff power-law), the BAT team has decided to require a chi-square improvement of more than 6 for each extra dof.
Time averaged spectrum fit using the average DRM
Power-law model
Time interval is from   -7.632 sec. to   41.712 sec.

Spectral model in power-law:
------------------------------------------------------------
Parameters  : value       lower 90%   higher 90%
Photon index: -1.39782     ( -0.149105   0.149704 )
Norm@50keV  : 4.03079E-03    ( -0.000343888   0.000343714 )
------------------------------------------------------------
#Fit statistic  : Chi-Squared                   45.43     using 59 bins.
 Reduced chi-squared = 0.797018
# Null hypothesis probability of 8.65e-01 with 57 degrees of freedom

Photon flux (15-150 keV)    in 49.34 sec: 0.490641 ( -0.044052  0.044211 ) ph/cm2/s
Energy fluence (15-150 keV)             : 1.92278e-06 ( -1.76398e-07  1.77606e-07 ) ergs/cm2
Cutoff power-law model
Time interval is from   -7.632 sec. to   41.712 sec.
Spectral model in the cutoff power-law:
------------------------------------------------------------
Parameters  : value       lower 90%   higher 90%
Photon index: -0.858418     ( -0.588795   0.698003 )
Epeak [keV] : 113.077      ( -36.511 -113.077 )
Norm@50keV  : 7.26757E-03    ( -0.00335477   0.007893 )
------------------------------------------------------------
#Fit statistic  : Chi-Squared                   43.11     using 59 bins.
 Reduced chi-squared = 0.769821
# Null hypothesis probability of 8.96e-01 with 56 degrees of freedom

Photon flux (15-150 keV)    in 49.34 sec: 0.477099 ( -0.046622  0.046694 ) ph/cm2/s
Energy fluence (15-150 keV)             : 1.8599e-06 ( -1.92844e-07  1.92018e-07 ) ergs/cm2
1-s peak spectrum fit
Power-law model
Time interval is from    4.156 sec. to    5.156 sec.

Spectral model in power-law:
------------------------------------------------------------
Parameters  : value       lower 90%   higher 90%
Photon index: -1.45072     ( -0.501076   0.494696 )
Norm@50keV  : 8.19293E-03    ( -0.0023827   0.00237448 )
------------------------------------------------------------
#Fit statistic  : Chi-Squared                   71.48     using 59 bins.
 Reduced chi-squared = 1.25404
# Null hypothesis probability of 9.38e-02 with 57 degrees of freedom

Photon flux (15-150 keV)    in 1 sec: 1.00987 ( -0.301973  0.30417 ) ph/cm2/s
Energy fluence (15-150 keV)             : 7.84007e-08 ( -2.43016e-08  2.46498e-08 ) ergs/cm2
Cutoff power-law model

Time interval is from    4.156 sec. to    5.156 sec.
Spectral model in the cutoff power-law:
------------------------------------------------------------
Parameters  : value       lower 90%   higher 90%
Photon index: -0.53494     ( -1.75804   5.21643 )
Epeak [keV] : 83.4294      ( -36.4004 -83.0804 )
Norm@50keV  : 2.28770E-02    ( -0.0231729   5.33866 )
------------------------------------------------------------
#Fit statistic  : Chi-Squared                   71.07     using 59 bins.
 Reduced chi-squared = 1.26911
# Null hypothesis probability of 8.45e-02 with 56 degrees of freedom

Photon flux (15-150 keV)    in 1 sec: 0.972587 ( -0.340205  0.320223 ) ph/cm2/s
Energy fluence (15-150 keV)             : 7.45659e-08 ( -2.71483e-08  2.66853e-08 ) ergs/cm2
Time-resolved spectra
Distribution
T90 vs. Hardness ratio plot
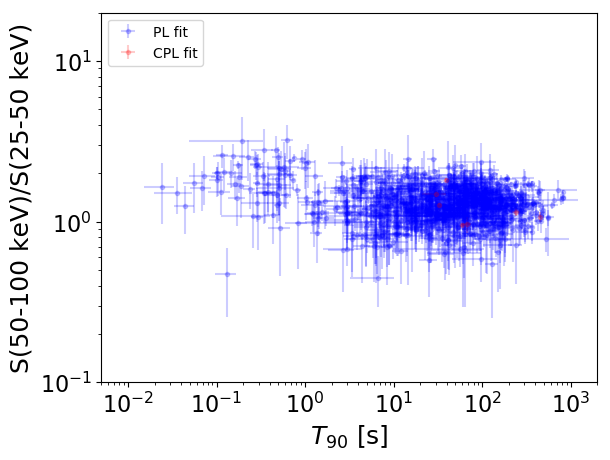
T90                                   = N/A sec.
Hardness ratio (energy fluence ratio) = N/A
S(15-50 keV) vs. S(50-150 keV) plot
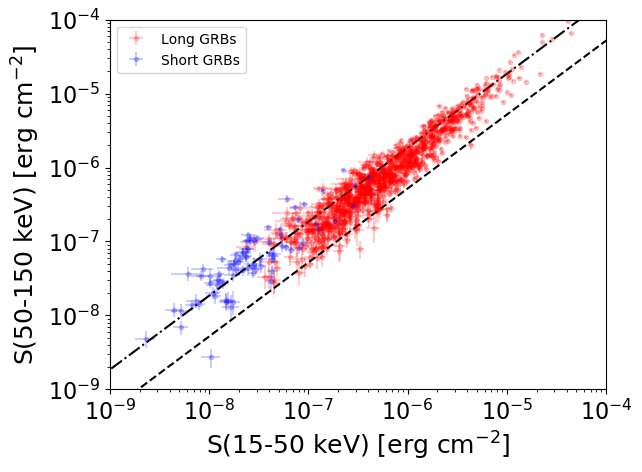
S(15-50 keV)  = N/A
S(50-150 keV) = N/A
The dash-dotted line and the dashed line traces the fluences calculated from the Band function with Epeak = 15 and 150 keV, respectively. Both lines assume a canonical values of alpha = -1 and beta = -2.5.
Mask shadow pattern
IMX = 7.051549895753279E-01, IMY = 4.745496656977984E-01
Spacecraft aspect plot
Bright source in the pre-burst/pre-slew/post-slew images
Pre-burst image of 15-350 keV band
Time interval of the image:
-239.616000 -7.632000

# RAcent  DECcent POSerr Theta    Phi  PeakCts   SNR AngSep     Name
#  [deg]    [deg]    ['] [deg]  [deg]                   [']
244.9577 -15.6492    0.5  34.2 -100.5  13.3615  23.8    1.4	Sco X-1
254.3970  35.4194   17.6  56.9 -169.9   1.0452   0.7    5.5	Her X-1
188.2992  30.1111    3.0  41.8  117.8   3.8162   3.9 ------	UNKNOWN
246.4504  42.4332    2.7  57.0  179.0   7.2706   4.2 ------	UNKNOWN
197.5491 -37.9360    2.3  35.3  -11.4   1.6702   5.1 ------	UNKNOWN
254.3155  18.1751    2.9  47.9 -151.2   2.7828   4.0 ------	UNKNOWN
Pre-slew background subtracted image of 15-350 keV band
Time interval of the image:
-7.632000 41.712000

# RAcent  DECcent POSerr Theta    Phi  PeakCts   SNR AngSep     Name
#  [deg]    [deg]    ['] [deg]  [deg]                   [']
245.0724 -15.5975    6.3  34.3 -100.7  -0.4095  -1.8    5.9	Sco X-1
254.4891  35.2321    5.2  56.9 -169.6   1.2260   2.2    6.8	Her X-1
189.0096 -46.7639    2.4  46.1   -9.4   0.8988   4.8 ------	UNKNOWN
239.9932  10.3339    2.4  32.0 -149.9   0.5942   4.7 ------	UNKNOWN
214.4876 -45.4054    0.8  40.4  -33.9   2.7388  15.1 ------	UNKNOWN
Post-slew image of 15-350 keV band
Time interval of the image:
120.084600 951.384610

# RAcent  DECcent POSerr Theta    Phi  PeakCts   SNR AngSep     Name
#  [deg]    [deg]    ['] [deg]  [deg]                   [']
170.6820 -60.5744    0.0  29.6   50.6  -0.7624  -0.6   11.2	Cen X-3
186.6535 -62.7709    3.1  23.5   39.6   3.1442   3.8    0.1	GX 301-2
244.9761 -15.6435    0.5  39.2 -122.3  40.4090  23.6    0.3	Sco X-1
255.9653 -37.8646    1.2  31.5  -81.9  12.1733   9.4    1.6	4U 1700-377
256.4597 -36.3979    4.6  32.6  -83.9   3.5949   2.5    1.9	GX 349+2
264.7411 -44.4509 1528.5  35.0  -66.0  -0.0118  -0.0    0.1	4U 1735-44
263.2118 -33.8289    0.0  38.6  -82.9   3.8072   1.5   11.1	GX 354-0
163.9289 -32.3641    3.8  40.7   97.7  10.1380   3.0 ------	UNKNOWN
172.4107 -32.0404    4.3  35.0  104.7   3.9767   2.7 ------	UNKNOWN
179.1092 -23.0811    3.0  36.3  123.1   6.7430   3.8 ------	UNKNOWN
182.4226 -20.4071    3.6  36.3  130.0   5.4854   3.3 ------	UNKNOWN
189.9889  -0.2400    3.0  50.1  154.4  11.3220   3.8 ------	UNKNOWN
194.0958   5.6132    2.8  54.2  161.8  17.1033   4.1 ------	UNKNOWN
132.1761 -77.9977    4.1  44.2   24.3   3.9458   2.8 ------	UNKNOWN
186.7030 -34.7618    2.2  23.6  114.2   4.5676   5.2 ------	UNKNOWN
166.4236 -71.4070    2.9  34.4   31.9   4.6452   3.9 ------	UNKNOWN
197.9509 -34.9793    3.1  16.4  131.1   3.2540   3.7 ------	UNKNOWN
 48.7055 -84.4700    3.1  49.9    8.9   6.1776   3.8 ------	UNKNOWN
217.5099 -73.9650    3.2  28.6    5.4   2.9270   3.6 ------	UNKNOWN
207.5327  11.1885    2.8  57.0  179.0  17.4076   4.1 ------	UNKNOWN
235.0587 -15.6022    3.4  34.5 -136.2   4.0074   3.4 ------	UNKNOWN