Analysis Summary
Notes:
- 1) No attempt has been made to eliminate the non-significant decimal places.
- 2) This batgrbproduct analysis is done using the HEASARC data.
- 3) This batgrbproduct analysis is using the flight position for the mask-weighting calculation.
======================================================================
BAT GRB EVENT DATA PROCESSING REPORT
Process Script Ver: batgrbproduct v2.48
Process Start Time: Sat Jul 30 00:40:36 EDT 2022
Host Name: batproc1
Current Working Dir: /local/data/bat1/alien/Swift_3rdBATcatalog/event/batevent_reproc/trigger1014037
======================================================================
Trigger: 01014037 Segment: 000
BAT Trigger Time: 630284820.48 [s; MET]
Trigger Stop: 630284820.608 [s; MET]
UTC: 2020-12-21T23:06:34.286000 [includes UTCF correction]
Where From?: TDRSS position message
BAT
RA: 171.049596287146 Dec: 42.1443187509267 [deg; J2000]
Catalogged Source?: NO
Point Source?: YES
GRB Indicated?: YES [ by BAT flight software ]
Image S/N Ratio: 13.97
Image Trigger?: NO
Rate S/N Ratio: 78.1216999303011 [ if not an image trigger ]
Image S/N Ratio: 13.97
Analysis Position: [ source = BAT ]
RA: 171.049596287146 Dec: 42.1443187509267 [deg; J2000]
Refined Position: [ source = BAT pre-slew burst ]
RA: 171.054595337899 Dec: 42.1523198157143 [deg; J2000]
{ 11h 24m 13.1s , +42d 09' 08.4" }
+/- 1.3120459130418 [arcmin] (estimated 90% radius based on SNR)
+/- 0.49536282446498 [arcmin] (formal 1-sigma fit error)
SNR: 20.6357264291279
Angular difference between the analysis and refined position is 0.529070 arcmin
Partial Coding Fraction: 0.234375 [ including projection effects ]
Duration
T90: 0.164000034332275 +/- 0.0399999141693186
Measured from: -0.0240000486373901
to: 0.139999985694885 [s; relative to TRIGTIME]
T50: 0.0679999589920044 +/- 0.0144221847352656
Measured from: 0.0199999809265137
to: 0.0879999399185181 [s; relative to TRIGTIME]
Fluence
Peak Flux (peak 1 second)
Measured from: -0.442000031471252
to: 0.557999968528748 [s; relative to TRIGTIME]
Total Fluence
Measured from: -0.0559999942779541
to: 0.167999982833862 [s; relative to TRIGTIME]
Band 1 Band 2 Band 3 Band 4
15-25 25-50 50-100 100-350 keV
Total 0.176745 0.233551 0.192331 0.048637
0.015869 0.018045 0.016815 0.010025 [error]
Peak 0.188527 0.248707 0.190021 0.041997
0.019612 0.022092 0.020519 0.014681 [error]
[ fluence units of on-axis counts / fully illuminated detector ]
======================================================================
====== Table of the duration information =============================
Value tstart tstop
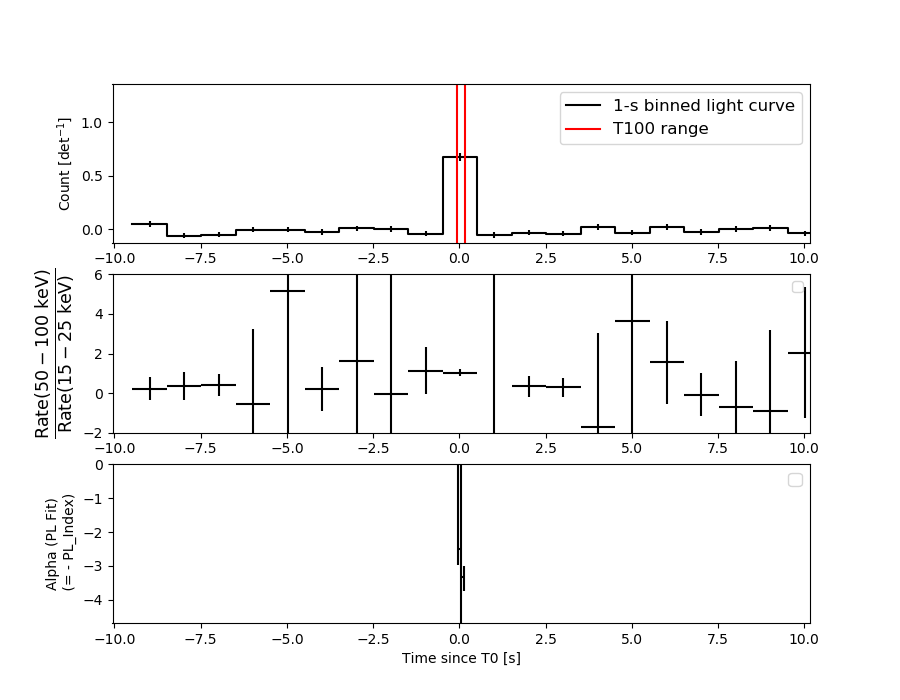
T100 0.224 -0.056 0.168
T90 0.164 -0.024 0.140
T50 0.068 0.020 0.088
Peak 1.000 -0.442 0.558
====== Spectral Analysis Summary =====================================
Model : spectral model: simple power-law (PL) and cutoff power-law (CPL)
Ph_index : photon index: E^{Ph_index}
Ph_90err : 90% error of the photon index
Epeak : Epeak in keV
Epeak_90err: 90% error of Epeak
Norm : normalization at 50 keV in both the PL model and CPL model
Nomr_90err : 90% error of the normalization
chi2 : Chi-Squared
dof : degree of freedo
=== Time-averaged spectral analysis ===
(Best model with acceptable fit: N/A)
Model Ph_index Ph_90err_low Ph_90err_hi Epeak Epeak_90err_low Epeak_90err_hi Norm Nomr_90err_low Norm_90err_hi chi2 dof
PL -1.576 -0.139 0.136 - - - 1.81e-01 -1.59e-02 1.58e-02 63.160 57
CPL -0.968 -0.532 0.600 88.312 -22.224 203.851 3.63e-01 -1.62e-01 3.41e-01 59.290 56
=== 1-s peak spectral analysis ===
(Best model with acceptable fit: N/A)
Model Ph_index Ph_90err_low Ph_90err_hi Epeak Epeak_90err_low Epeak_90err_hi Norm Nomr_90err_low Norm_90err_hi chi2 dof
PL -1.542 -0.161 0.157 - - - 4.39e-02 -4.41e-03 4.39e-03 68.670 57
CPL -0.997 -0.600 0.704 93.989 -28.638 -93.989 8.27e-02 -4.04e-02 9.96e-02 66.360 56
=== Fluence/Peak Flux Summary ===
Model Band1 Band2 Band3 Band4 Band5 Total
15-25 25-50 50-100 100-350 15-150 15-350 keV
Fluence PL 5.55e-08 9.74e-08 1.31e-07 3.60e-07 3.80e-07 6.43e-07 erg/cm2
90%_error_low -7.29e-09 -8.43e-09 -1.48e-08 -7.71e-08 -3.58e-08 -9.14e-08 erg/cm2
90%_error_hi 7.52e-09 8.41e-09 1.47e-08 8.84e-08 3.60e-08 1.00e-07 erg/cm2
Peak flux PL 1.88e+00 1.85e+00 1.27e+00 1.37e+00 5.55e+00 6.37e+00 ph/cm2/s
90%_error_low -2.90e-01 -1.87e-01 -1.59e-01 -3.13e-01 -5.43e-01 -6.23e-01 ph/cm2/s
90%_error_hi 3.02e-01 1.86e-01 1.57e-01 3.60e-01 5.43e-01 6.27e-01 ph/cm2/s
Fluence CPL 5.01e-08 1.04e-07 1.39e-07 1.70e-07 3.72e-07 4.63e-07 erg/cm2
90%_error_low -8.74e-09 -1.04e-08 -1.70e-08 -7.74e-08 -3.70e-08 -8.49e-08 erg/cm2
90%_error_hi 8.86e-09 1.06e-08 1.75e-08 1.58e-07 3.71e-08 1.55e-07 erg/cm2
Peak flux CPL 1.71e+00 1.96e+00 1.34e+00 7.93e-01 5.47e+00 5.80e+00 ph/cm2/s
90%_error_low -3.49e-01 -2.23e-01 -1.83e-01 -3.64e-01 -5.53e-01 -6.82e-01 ph/cm2/s
90%_error_hi 3.56e-01 2.30e-01 1.89e-01 7.07e-01 5.52e-01 8.37e-01 ph/cm2/s
======================================================================
Image
Pre-slew 15.0-350.0 keV image (Event data)
#   RAcent    DECcent   POSerr    Theta     Phi              Peak Cts       SNR   Name
  171.0546    42.1523   0.0094    35.6533    70.3758         0.6915236     20.636 TRIG_01014037

Foreground time interval of the image:
 -0.056   0.168 (delta_t =   0.224 [sec])
Background time interval of the image:
-42.379  -0.056 (delta_t =  42.323 [sec])
Light Curves
Note: The mask-weighted lightcurves have units of either count/det or counts/sec/det, where a det is 0.4 x 0.4 = 0.16 sq cm.
Full-time range; 1 s binning
Other quick-look light curves:
- 64 ms binning (zoomed)
- 16 ms binning (zoomed)
- 8 ms binning (zoomed)
- 2 ms binning (zoomed)
- SN=5 or 10 s binning (full-time range)
- Raw light curve
Spectra
- 64 ms binning (zoomed)
- 16 ms binning (zoomed)
- 8 ms binning (zoomed)
- 2 ms binning (zoomed)
- SN=5 or 10 s binning (full-time range)
- Raw light curve
Spectra
Notes:
- 1) The fitting includes the systematic errors.
- 2) When the burst includes telescope slew time periods, the fitting uses an average response file made from multiple 5-s response files through out the slew time plus single time preiod for the non-slew times, and weighted by the total counts in the corresponding time period using addrmf. An average response file is needed becuase a spectral fit using the pre-slew DRM will introduce some errors in both a spectral shape and a normalization if the PHA file contains a lot of the slew/post-slew time interval.
- 3) For fits to more complicated models (e.g. a power-law over a cutoff power-law), the BAT team has decided to require a chi-square improvement of more than 6 for each extra dof.
Time averaged spectrum fit using the average DRM
Power-law model
Time interval is from   -0.056 sec. to    0.168 sec.

Spectral model in power-law:
------------------------------------------------------------
Parameters  : value       lower 90%   higher 90%
Photon index: -1.57587     ( -0.139297   0.135901 )
Norm@50keV  : 0.180785    ( -0.0159344   0.0158349 )
------------------------------------------------------------
#Fit statistic  : Chi-Squared                   63.16     using 59 bins.
 Reduced chi-squared = 1.10807
# Null hypothesis probability of 2.68e-01 with 57 degrees of freedom

Photon flux (15-150 keV)    in 0.224 sec: 23.0623 ( -1.975  1.9762 ) ph/cm2/s
Energy fluence (15-150 keV)             : 3.79933e-07 ( -3.57829e-08  3.60044e-08 ) ergs/cm2
Cutoff power-law model
Time interval is from   -0.056 sec. to    0.168 sec.
Spectral model in the cutoff power-law:
------------------------------------------------------------
Parameters  : value       lower 90%   higher 90%
Photon index: -0.968236     ( -0.532398   0.599512 )
Epeak [keV] : 88.3117      ( -22.2242 203.851 )
Norm@50keV  : 0.362763    ( -0.162408   0.341338 )
------------------------------------------------------------
#Fit statistic  : Chi-Squared                   59.29     using 59 bins.
 Reduced chi-squared = 1.05875
# Null hypothesis probability of 3.57e-01 with 56 degrees of freedom

Photon flux (15-150 keV)    in 0.224 sec: 22.6968 ( -2.0041  2.004 ) ph/cm2/s
Energy fluence (15-150 keV)             : 3.72176e-07 ( -3.70346e-08  3.70545e-08 ) ergs/cm2
1-s peak spectrum fit
Power-law model
Time interval is from   -0.442 sec. to    0.558 sec.

Spectral model in power-law:
------------------------------------------------------------
Parameters  : value       lower 90%   higher 90%
Photon index: -1.54237     ( -0.160795   0.157346 )
Norm@50keV  : 4.39432E-02    ( -0.00441488   0.00438549 )
------------------------------------------------------------
#Fit statistic  : Chi-Squared                   68.67     using 59 bins.
 Reduced chi-squared = 1.20474
# Null hypothesis probability of 1.38e-01 with 57 degrees of freedom

Photon flux (15-150 keV)    in 1 sec: 5.55091 ( -0.54294  0.54332 ) ph/cm2/s
Energy fluence (15-150 keV)             : 4.142e-07 ( -4.48739e-08  4.51461e-08 ) ergs/cm2
Cutoff power-law model
Time interval is from   -0.442 sec. to    0.558 sec.
Spectral model in the cutoff power-law:
------------------------------------------------------------
Parameters  : value       lower 90%   higher 90%
Photon index: -0.997324     ( -0.599984   0.704117 )
Epeak [keV] : 93.9886      ( -28.6382 -93.9886 )
Norm@50keV  : 8.27339E-02    ( -0.0403913   0.0996245 )
------------------------------------------------------------
#Fit statistic  : Chi-Squared                   66.36     using 59 bins.
 Reduced chi-squared = 1.185
# Null hypothesis probability of 1.62e-01 with 56 degrees of freedom

Photon flux (15-150 keV)    in 1 sec: 5.46770 ( -0.55261  0.55205 ) ph/cm2/s
Energy fluence (15-150 keV)             : 4.04101e-07 ( -4.68611e-08  4.68922e-08 ) ergs/cm2
Time-resolved spectra
Distribution
T90 vs. Hardness ratio plot
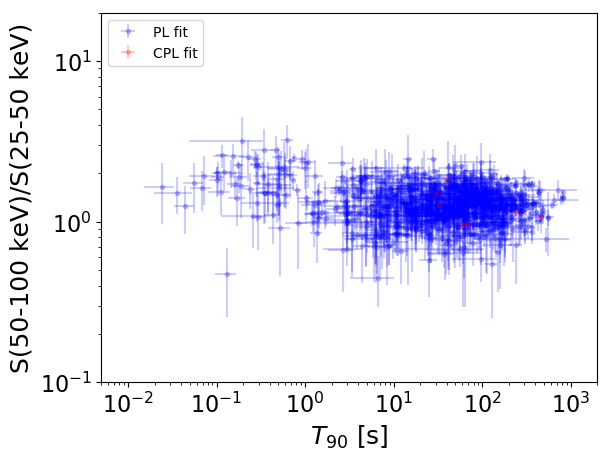
T90                                   = N/A sec.
Hardness ratio (energy fluence ratio) = N/A
S(15-50 keV) vs. S(50-150 keV) plot
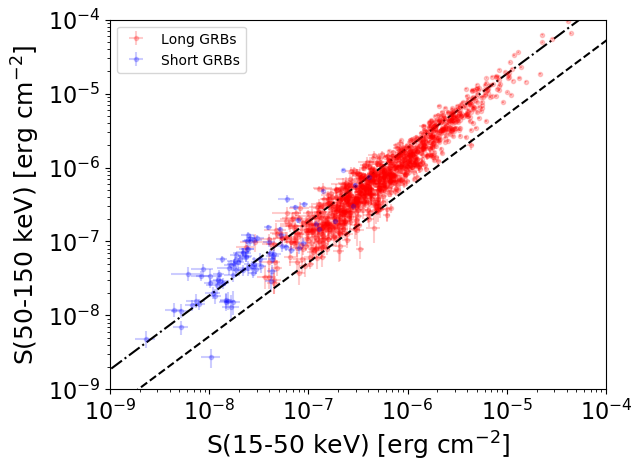
S(15-50 keV)  = N/A
S(50-150 keV) = N/A
The dash-dotted line and the dashed line traces the fluences calculated from the Band function with Epeak = 15 and 150 keV, respectively. Both lines assume a canonical values of alpha = -1 and beta = -2.5.
Mask shadow pattern
IMX = 2.409176770347630E-01, IMY = -6.756719300417512E-01
Spacecraft aspect plot
Bright source in the pre-burst/pre-slew/post-slew images
Pre-burst image of 15-350 keV band
Time interval of the image:
-42.379340 -0.056000

# RAcent  DECcent POSerr Theta    Phi  PeakCts   SNR AngSep     Name
#  [deg]    [deg]    ['] [deg]  [deg]                   [']
254.4054  35.1346    0.0  27.6 -121.4  -0.3911  -3.6   12.7	Her X-1
193.9145   8.4015    2.3  41.3    5.5   0.6287   4.9 ------	UNKNOWN
Pre-slew background subtracted image of 15-350 keV band
Time interval of the image:
-0.056000 0.168000

# RAcent  DECcent POSerr Theta    Phi  PeakCts   SNR AngSep     Name
#  [deg]    [deg]    ['] [deg]  [deg]                   [']
254.2312  35.3907    0.0  27.3 -121.8  -0.0181  -1.6   11.4	Her X-1
171.0546  42.1523    0.6  35.7   70.4   0.6915  20.6 ------	UNKNOWN
214.0492  17.6409    3.0  25.6  -22.5   0.0434   3.9 ------	UNKNOWN
238.0174   5.6191    2.7  40.4  -64.1   0.0923   4.3 ------	UNKNOWN
Post-slew image of 15-350 keV band
Time interval of the image:
71.620600 753.220600

# RAcent  DECcent POSerr Theta    Phi  PeakCts   SNR AngSep     Name
#  [deg]    [deg]    ['] [deg]  [deg]                   [']
239.2963  47.1694    3.9  47.2 -132.5   6.3294   3.0 ------	UNKNOWN
242.2564  46.8609    3.0  49.2 -133.1  10.3888   3.9 ------	UNKNOWN