Analysis Summary
Notes:
- 1) No attempt has been made to eliminate the non-significant decimal places.
- 2) This batgrbproduct analysis is done using the HEASARC data.
- 3) This batgrbproduct analysis is using the flight position for the mask-weighting calculation.
======================================================================
                  BAT GRB EVENT DATA PROCESSING REPORT
    Process Script Ver: batgrbproduct v2.48
    Process Start Time: Sat Jul 30 00:38:55 EDT 2022
             Host Name: batproc1
   Current Working Dir: /local/data/bat1/alien/Swift_3rdBATcatalog/event/batevent_reproc/trigger1014316
======================================================================

  Trigger: 01014316      Segment: 000

  BAT Trigger Time: 630439133.184   [s; MET]
      Trigger Stop: 630439134.208   [s; MET]
               UTC: 2020-12-23T17:58:26.979800    [includes UTCF correction]
       Where From?: TDRSS position message

  BAT
    RA: 132.848608736818   Dec: 71.1738904183058  [deg; J2000]

     Catalogged Source?: NO
     Point Source?:      YES
     GRB Indicated?:     YES    [ by BAT flight software ]
     Image S/N Ratio:    8.13
     Image Trigger?:     NO
     Rate S/N Ratio:     15.1986841535707  [ if not an image trigger ]
     Image S/N Ratio:    8.13

  Analysis Position:   [ source = BAT ]
    RA: 132.848608736818   Dec: 71.1738904183058  [deg; J2000]

  Refined Position:   [ source = BAT pre-slew burst ]
    RA: 132.736241441554   Dec: 71.1763502174877  [deg; J2000]
        { 08h 50m 56.7s , +71d 10' 34.9" }
         +/- 1.35119364796521 [arcmin] (estimated 90% radius based on SNR)
         +/- 0.479555330142145 [arcmin] (formal 1-sigma fit error)
    SNR: 19.7869546617193

  Angular difference between the analysis and refined position is 2.180499 arcmin

  Partial Coding Fraction: 0.53125    [ including projection effects ]

  Duration
     T90: 29 +/- 6.70820393249937
        Measured from: -23.1840000152588
                   to: 5.81599998474121     [s; relative to TRIGTIME]
     T50: 14 +/- 8.06225774829855
        Measured from: -12.1840000152588
                   to: 1.81599998474121     [s; relative to TRIGTIME]


  Fluence
     Peak Flux  (peak 1 second)
        Measured from: -0.184000015258789
                   to: 0.815999984741211     [s; relative to TRIGTIME]
     Total Fluence
        Measured from: -25.1840000152588
                   to: 7.81599998474121     [s; relative to TRIGTIME]

             Band 1     Band 2     Band 3     Band 4
              15-25      25-50     50-100    100-350     keV
 Total     0.481324   0.724767   0.709158   0.071254
           0.051640   0.054387   0.048348   0.040042 [error]
 Peak      0.027064   0.072639   0.086258   0.033049
           0.009558   0.010633   0.010598   0.008095 [error]

     [ fluence units of on-axis counts / fully illuminated detector ]

======================================================================


====== Table of the duration information =============================

        Value   tstart    tstop
T100   33.000  -25.184    7.816
T90    29.000  -23.184    5.816
T50    14.000  -12.184    1.816
Peak    1.000   -0.184    0.816


====== Spectral Analysis Summary =====================================

Model      : spectral model: simple power-law (PL) and cutoff power-law (CPL)
Ph_index   : photon index: E^{Ph_index}
Ph_90err   : 90% error of the photon index
Epeak      : Epeak in keV
Epeak_90err: 90% error of Epeak
Norm       : normalization at 50 keV in both the PL model and CPL model
Nomr_90err : 90% error of the normalization
chi2       : Chi-Squared
dof        : degree of freedo

=== Time-averaged spectral analysis ===
(Best model with acceptable fit: N/A)

Model Ph_index Ph_90err_low Ph_90err_hi  Epeak  Epeak_90err_low  Epeak_90err_hi  Norm       Nomr_90err_low    Norm_90err_hi    chi2    dof
PL      -1.346    -0.131      0.131       -           -               -         4.17e-03     -3.21e-04          3.21e-04      66.250   57
CPL     -0.603    -0.565      0.651       99.373     -24.294       135.120      9.48e-03     -4.32e-03          9.46e-03      61.050   56


=== 1-s peak spectral analysis ===
(Best model with acceptable fit: N/A)

Model Ph_index Ph_90err_low Ph_90err_hi  Epeak  Epeak_90err_low  Epeak_90err_hi  Norm       Nomr_90err_low    Norm_90err_hi    chi2    dof
PL      -0.876     -0.241     0.255       -           -               -         1.32e-02     -2.13e-03          2.11e-03      57.180   57
CPL      0.480     -1.063     1.405      108.900     -28.826       158.646      5.02e-02     -3.20e-02          1.26e-01      52.110   56


=== Fluence/Peak Flux Summary ===

              Model    Band1     Band2     Band3     Band4     Band5     Total
                       15-25     25-50    50-100    100-350    15-150    15-350    keV
Fluence         PL   1.52e-07  3.07e-07  4.84e-07  1.68e-06  1.35e-06  2.63e-06   erg/cm2
      90%_error_low -2.05e-08 -2.59e-08 -4.59e-08 -3.22e-07 -1.14e-07 -3.58e-07   erg/cm2
      90%_error_hi   2.14e-08  2.57e-08  4.57e-08  3.70e-07  1.15e-07  3.98e-07   erg/cm2
Peak flux       PL   3.00e-01  4.39e-01  4.78e-01  9.75e-01  1.52e+00  2.19e+00   ph/cm2/s
      90%_error_low -8.94e-02 -8.84e-02 -7.67e-02 -2.84e-01 -2.43e-01 -3.65e-01   ph/cm2/s
      90%_error_hi   1.00e-01  8.76e-02  7.63e-02  3.49e-01  2.44e-01  3.81e-01   ph/cm2/s

Fluence        CPL   1.31e-07  3.28e-07  5.13e-07  6.70e-07  1.29e-06  1.64e-06   erg/cm2
      90%_error_low -2.57e-08 -3.07e-08 -5.25e-08 -3.03e-07 -1.24e-07 -3.23e-07   erg/cm2
      90%_error_hi   2.63e-08  3.14e-08  5.37e-08  6.44e-07  1.24e-07  6.38e-07   erg/cm2
Peak flux      CPL   2.04e-01  4.62e-01  5.63e-01  3.70e-01  1.46e+00  1.60e+00   ph/cm2/s
      90%_error_low -9.94e-02 -1.06e-01 -1.01e-01 -1.90e-01 -2.44e-01 -3.13e-01   ph/cm2/s
      90%_error_hi   1.19e-01  1.05e-01  1.05e-01  4.01e-01  2.47e-01  4.35e-01   ph/cm2/s

======================================================================
Image
Pre-slew 15.0-350.0 keV image (Event data)
#   RAcent    DECcent   POSerr    Theta     Phi              Peak Cts       SNR   Name
  132.7362    71.1764   0.0097    25.1047    91.8245         2.1162630     19.787 TRIG_01014316

Foreground time interval of the image:
-25.184   7.816 (delta_t =  33.000 [sec])
Background time interval of the image:
-239.184 -25.184 (delta_t = 214.000 [sec])
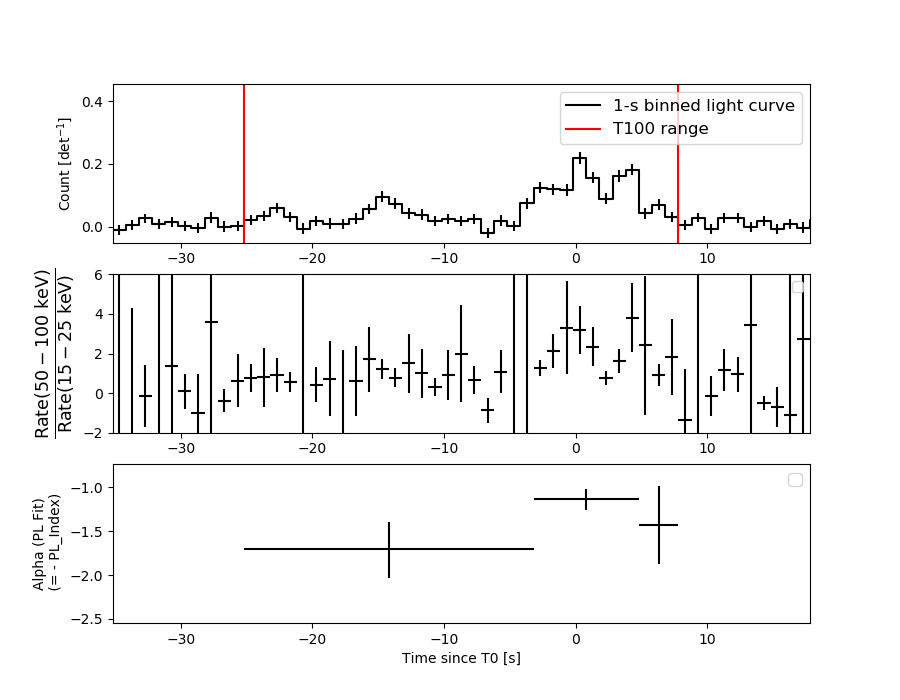
Light Curves
Note: The mask-weighted lightcurves have units of either count/det or counts/sec/det, where a det is 0.4 x 0.4 = 0.16 sq cm.
Full-time range; 1 s binning
Other quick-look light curves:
- 64 ms binning (zoomed)
- 16 ms binning (zoomed)
- 8 ms binning (zoomed)
- 2 ms binning (zoomed)
- SN=5 or 10 s binning (full-time range)
- Raw light curve
Spectra
- 64 ms binning (zoomed)
- 16 ms binning (zoomed)
- 8 ms binning (zoomed)
- 2 ms binning (zoomed)
- SN=5 or 10 s binning (full-time range)
- Raw light curve
Spectra
Notes:
- 1) The fitting includes the systematic errors.
- 2) When the burst includes telescope slew time periods, the fitting uses an average response file made from multiple 5-s response files through out the slew time plus single time preiod for the non-slew times, and weighted by the total counts in the corresponding time period using addrmf. An average response file is needed becuase a spectral fit using the pre-slew DRM will introduce some errors in both a spectral shape and a normalization if the PHA file contains a lot of the slew/post-slew time interval.
- 3) For fits to more complicated models (e.g. a power-law over a cutoff power-law), the BAT team has decided to require a chi-square improvement of more than 6 for each extra dof.
Time averaged spectrum fit using the average DRM
Power-law model
Time interval is from  -25.184 sec. to    7.816 sec.

Spectral model in power-law:
------------------------------------------------------------
Parameters  : value       lower 90%   higher 90%
Photon index: -1.34553     ( -0.130563   0.130796 )
Norm@50keV  : 4.17213E-03    ( -0.000320951   0.000320751 )
------------------------------------------------------------
#Fit statistic  : Chi-Squared                   66.25     using 59 bins.
 Reduced chi-squared = 1.16228
# Null hypothesis probability of 1.88e-01 with 57 degrees of freedom

Photon flux (15-150 keV)    in 33 sec: 0.502169 ( -0.039629  0.039695 ) ph/cm2/s
Energy fluence (15-150 keV)             : 1.34621e-06 ( -1.13749e-07  1.14531e-07 ) ergs/cm2
Cutoff power-law model
Time interval is from  -25.184 sec. to    7.816 sec.
Spectral model in the cutoff power-law:
------------------------------------------------------------
Parameters  : value       lower 90%   higher 90%
Photon index: -0.603277     ( -0.564872   0.651061 )
Epeak [keV] : 99.3725      ( -24.2941 135.121 )
Norm@50keV  : 9.47915E-03    ( -0.00432397   0.00946029 )
------------------------------------------------------------
#Fit statistic  : Chi-Squared                   61.05     using 59 bins.
 Reduced chi-squared = 1.09018
# Null hypothesis probability of 2.99e-01 with 56 degrees of freedom

Photon flux (15-150 keV)    in 33 sec: 0.485532 ( -0.041875  0.041682 ) ph/cm2/s
Energy fluence (15-150 keV)             : 1.28536e-06 ( -1.23576e-07  1.24107e-07 ) ergs/cm2
1-s peak spectrum fit
Power-law model
Time interval is from   -0.184 sec. to    0.816 sec.

Spectral model in power-law:
------------------------------------------------------------
Parameters  : value       lower 90%   higher 90%
Photon index: -0.876445     ( -0.241586   0.254459 )
Norm@50keV  : 1.32046E-02    ( -0.00213397   0.00211518 )
------------------------------------------------------------
#Fit statistic  : Chi-Squared                   57.18     using 59 bins.
 Reduced chi-squared = 1.00316
# Null hypothesis probability of 4.69e-01 with 57 degrees of freedom

Photon flux (15-150 keV)    in 1 sec: 1.51543 ( -0.24279  0.24387 ) ph/cm2/s
Energy fluence (15-150 keV)             : 1.49586e-07 ( -2.43382e-08  2.44464e-08 ) ergs/cm2
Cutoff power-law model
Time interval is from   -0.184 sec. to    0.816 sec.
Spectral model in the cutoff power-law:
------------------------------------------------------------
Parameters  : value       lower 90%   higher 90%
Photon index: 0.480294     ( -1.06303   1.40553 )
Epeak [keV] : 108.900      ( -28.8308 158.641 )
Norm@50keV  : 5.01998E-02    ( -0.0319982   0.126383 )
------------------------------------------------------------
#Fit statistic  : Chi-Squared                   52.11     using 59 bins.
 Reduced chi-squared = 0.930536
# Null hypothesis probability of 6.23e-01 with 56 degrees of freedom

Photon flux (15-150 keV)    in 1 sec: 1.46245 ( -0.24436  0.24654 ) ph/cm2/s
Energy fluence (15-150 keV)             : 1.4392e-07 ( -2.5703e-08  2.55918e-08 ) ergs/cm2
Time-resolved spectra
Distribution
T90 vs. Hardness ratio plot
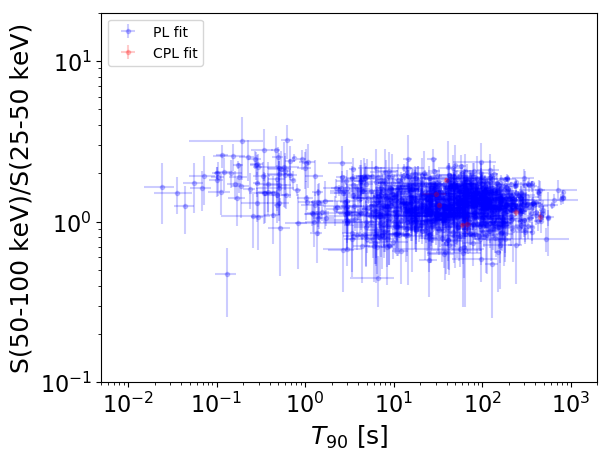
T90                                   = N/A sec.
Hardness ratio (energy fluence ratio) = N/A
S(15-50 keV) vs. S(50-150 keV) plot
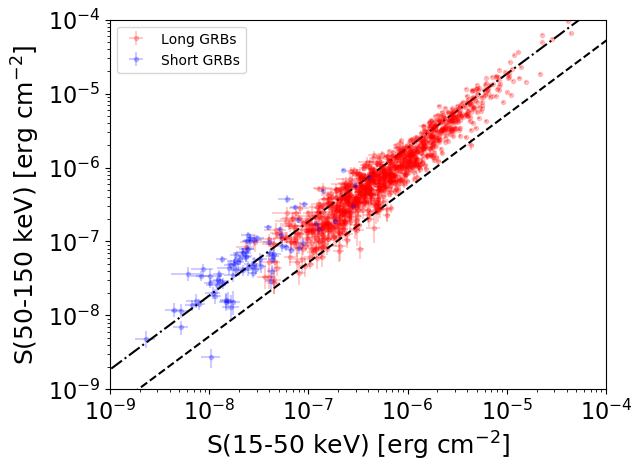
S(15-50 keV)  = N/A
S(50-150 keV) = N/A
The dash-dotted line and the dashed line traces the fluences calculated from the Band function with Epeak = 15 and 150 keV, respectively. Both lines assume a canonical values of alpha = -1 and beta = -2.5.
Mask shadow pattern
IMX = -1.491751994915043E-02, IMY = -4.682970903408430E-01
Spacecraft aspect plot
Bright source in the pre-burst/pre-slew/post-slew images
Pre-burst image of 15-350 keV band
Time interval of the image:
-239.184000 -25.184000

# RAcent  DECcent POSerr Theta    Phi  PeakCts   SNR AngSep     Name
#  [deg]    [deg]    ['] [deg]  [deg]                   [']
254.4506  35.3374   16.4  40.9  -81.0  -0.7715  -0.7    0.5	Her X-1
308.1824  40.8131    0.0  50.3 -139.8  -1.3401  -1.4    9.0	Cyg X-3
 63.2547  62.2192    2.4  44.3  127.2   4.9162   4.9 ------	UNKNOWN
 56.9112  64.4917    2.3  42.4  131.7   3.9561   5.0 ------	UNKNOWN
157.4598  87.1012    3.3  16.2  131.9   0.7802   3.5 ------	UNKNOWN
184.5740  49.7495    2.2  28.2   17.2   1.2526   5.3 ------	UNKNOWN
209.5173  14.8498    2.2  58.3  -24.7   7.2277   5.3 ------	UNKNOWN
312.0297  38.9405    3.0  53.2 -142.4   4.9183   3.9 ------	UNKNOWN
301.6619  39.9363    3.9  49.2 -133.4   3.2504   3.0 ------	UNKNOWN
Pre-slew background subtracted image of 15-350 keV band
Time interval of the image:
-25.184000 7.816000

# RAcent  DECcent POSerr Theta    Phi  PeakCts   SNR AngSep     Name
#  [deg]    [deg]    ['] [deg]  [deg]                   [']
254.3925  35.4820    4.3  40.7  -81.0   0.9088   2.7    9.0	Her X-1
307.8652  40.8745   11.5  50.2 -139.6  -0.3114  -1.0   12.1	Cyg X-3
132.7363  71.1764    0.6  25.1   91.8   2.1164  19.8 ------	UNKNOWN
327.7780  66.3459    2.1  32.7 -173.1   0.4896   5.5 ------	UNKNOWN
289.2076  40.2157    2.2  45.3 -121.5   1.7399   5.2 ------	UNKNOWN
Post-slew image of 15-350 keV band
Time interval of the image:
58.116600 717.265200
720.816000 839.544800
840.816000 934.336000
935.816000 941.923200
942.816000 962.826000

# RAcent  DECcent POSerr Theta    Phi  PeakCts   SNR AngSep     Name
#  [deg]    [deg]    ['] [deg]  [deg]                   [']
134.3745  24.2705    3.5  46.9   40.4   7.0649   3.3 ------	UNKNOWN
 37.3310  44.4831    3.7  50.1  154.5  10.0156   3.1 ------	UNKNOWN
159.6113  17.7423    4.4  55.7   11.0   9.5906   2.6 ------	UNKNOWN
  8.6221  46.7244    2.5  55.6  178.8  17.5127   4.7 ------	UNKNOWN
333.2223  59.7397    3.2  48.3 -151.4   7.3060   3.6 ------	UNKNOWN
305.9746  59.4929    3.1  49.2 -133.2  13.5392   3.7 ------	UNKNOWN
299.5835  60.5407    2.4  47.9 -129.0  15.0090   4.7 ------	UNKNOWN