Analysis Summary
Notes:
- 1) No attempt has been made to eliminate the non-significant decimal places.
- 2) This batgrbproduct analysis is done using the HEASARC data.
- 3) This batgrbproduct analysis is using the flight position for the mask-weighting calculation.
======================================================================
BAT GRB EVENT DATA PROCESSING REPORT
Process Script Ver: batgrbproduct v2.48
Process Start Time: Sat Jul 30 00:37:05 EDT 2022
Host Name: batproc1
Current Working Dir: /local/data/bat1/alien/Swift_3rdBATcatalog/event/batevent_reproc/trigger1015088
======================================================================
Trigger: 01015088 Segment: 000
BAT Trigger Time: 630932397.184 [s; MET]
Trigger Stop: 630932401.28 [s; MET]
UTC: 2020-12-29T10:59:30.947160 [includes UTCF correction]
Where From?: TDRSS position message
BAT
RA: 210.707706522396 Dec: 48.1973283679248 [deg; J2000]
Catalogged Source?: NO
Point Source?: YES
GRB Indicated?: YES [ by BAT flight software ]
Image S/N Ratio: 8.78
Image Trigger?: NO
Rate S/N Ratio: 12.6885775404495 [ if not an image trigger ]
Image S/N Ratio: 8.78
Analysis Position: [ source = BAT ]
RA: 210.707706522396 Dec: 48.1973283679248 [deg; J2000]
Refined Position: [ source = BAT pre-slew burst ]
RA: 210.692022884813 Dec: 48.2091696160309 [deg; J2000]
{ 14h 02m 46.1s , +48d 12' 33.0" }
+/- 2.61351471855472 [arcmin] (estimated 90% radius based on SNR)
+/- 1.26163925377268 [arcmin] (formal 1-sigma fit error)
SNR: 7.71050346658863
Angular difference between the analysis and refined position is 0.947696 arcmin
Partial Coding Fraction: 0.2617188 [ including projection effects ]
Duration
T90: 53.2479999065399 +/- 4.61344127077464
Measured from: -42.960000038147
to: 10.2879998683929 [s; relative to TRIGTIME]
T50: 40.5119998455048 +/- 35.5541745186382
Measured from: -36.8799999952316
to: 3.63199985027313 [s; relative to TRIGTIME]
Fluence
Peak Flux (peak 1 second)
Measured from: 0.411999940872192
to: 1.41199994087219 [s; relative to TRIGTIME]
Total Fluence
Measured from: -44.432000041008
to: 13.6159999370575 [s; relative to TRIGTIME]
Band 1 Band 2 Band 3 Band 4
15-25 25-50 50-100 100-350 keV
Total 0.368714 0.777766 0.521816 0.183706
0.106331 0.111057 0.100104 0.093639 [error]
Peak 0.037525 0.079524 0.078475 0.026171
0.015444 0.015872 0.014934 0.012853 [error]
[ fluence units of on-axis counts / fully illuminated detector ]
======================================================================
====== Table of the duration information =============================
Value tstart tstop
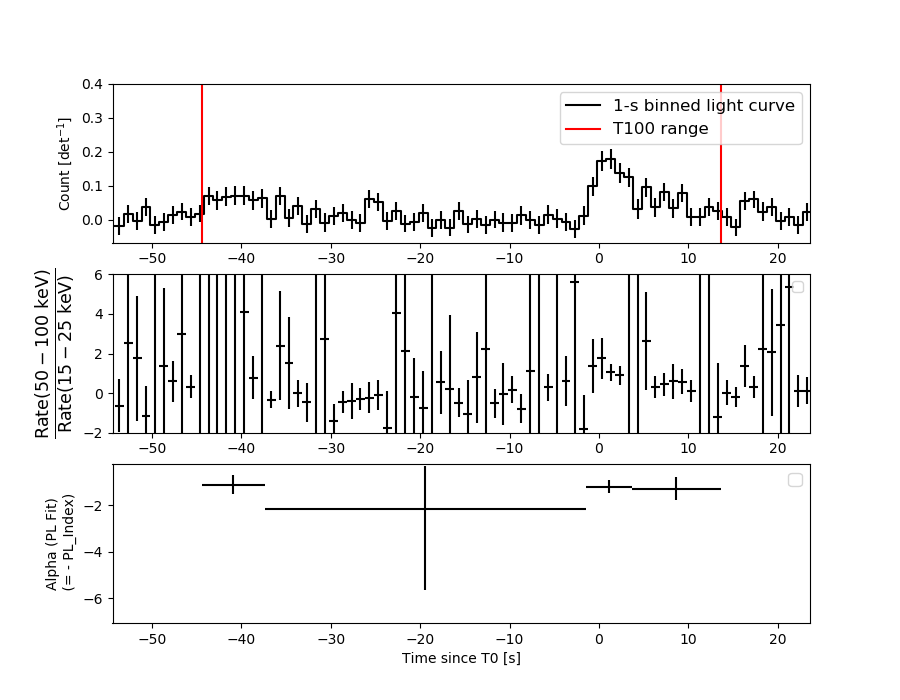
T100 58.048 -44.432 13.616
T90 53.248 -42.960 10.288
T50 40.512 -36.880 3.632
Peak 1.000 0.412 1.412
====== Spectral Analysis Summary =====================================
Model : spectral model: simple power-law (PL) and cutoff power-law (CPL)
Ph_index : photon index: E^{Ph_index}
Ph_90err : 90% error of the photon index
Epeak : Epeak in keV
Epeak_90err: 90% error of Epeak
Norm : normalization at 50 keV in both the PL model and CPL model
Nomr_90err : 90% error of the normalization
chi2 : Chi-Squared
dof : degree of freedo
=== Time-averaged spectral analysis ===
(Best model with acceptable fit: N/A)
Model Ph_index Ph_90err_low Ph_90err_hi Epeak Epeak_90err_low Epeak_90err_hi Norm Nomr_90err_low Norm_90err_hi chi2 dof
PL -1.398 -0.287 0.290 - - - 2.24e-03 -3.96e-04 3.95e-04 56.150 57
CPL -0.140 -1.300 1.895 73.902 -20.607 -73.902 9.61e-03 -9.61e-03 7.13e-02 53.470 56
=== 1-s peak spectral analysis ===
(Best model with acceptable fit: N/A)
Model Ph_index Ph_90err_low Ph_90err_hi Epeak Epeak_90err_low Epeak_90err_hi Norm Nomr_90err_low Norm_90err_hi chi2 dof
PL -1.291 -0.373 0.384 - - - 1.42e-02 -3.19e-03 3.18e-03 68.180 57
CPL -0.636 -0.913 2.303 116.556 -116.556 -116.556 2.85e-02 -1.71e-02 2.55e-01 67.760 56
=== Fluence/Peak Flux Summary ===
Model Band1 Band2 Band3 Band4 Band5 Total
15-25 25-50 50-100 100-350 15-150 15-350 keV
Fluence PL 1.51e-07 2.96e-07 4.49e-07 1.48e-06 1.26e-06 2.38e-06 erg/cm2
90%_error_low -4.39e-08 -5.67e-08 -9.65e-08 -5.74e-07 -2.39e-07 -6.65e-07 erg/cm2
90%_error_hi 4.76e-08 5.59e-08 9.57e-08 7.80e-07 2.42e-07 8.31e-07 erg/cm2
Peak flux PL 4.79e-01 5.47e-01 4.47e-01 6.11e-01 1.70e+00 2.08e+00 ph/cm2/s
90%_error_low -1.91e-01 -1.49e-01 -1.12e-01 -2.66e-01 -4.02e-01 -4.67e-01 ph/cm2/s
90%_error_hi 2.20e-01 1.45e-01 1.09e-01 3.61e-01 4.05e-01 4.70e-01 ph/cm2/s
Fluence CPL 1.22e-07 3.34e-07 4.81e-07 3.44e-07 1.15e-06 1.28e-06 erg/cm2
90%_error_low -5.26e-08 -7.12e-08 -1.15e-07 -2.65e-07 -2.59e-07 -3.69e-07 erg/cm2
90%_error_hi 5.62e-08 7.59e-08 1.15e-07 1.24e-06 2.68e-07 1.22e-06 erg/cm2
Peak flux CPL 4.10e-01 5.71e-01 4.84e-01 3.45e-01 1.65e+00 1.81e+00 ph/cm2/s
90%_error_low -2.40e-01 -1.63e-01 -1.35e-01 -3.45e-01 -4.10e-01 -5.29e-01 ph/cm2/s
90%_error_hi 2.71e-01 1.70e-01 1.52e-01 3.61e-01 4.19e-01 5.40e-01 ph/cm2/s
======================================================================
Image
Pre-slew 15.0-350.0 keV image (Event data)
#   RAcent    DECcent   POSerr    Theta     Phi              Peak Cts       SNR   Name
  210.6920    48.2092   0.0250    41.3006   -47.6301         1.8500243      7.711 TRIG_01015088

Foreground time interval of the image:
-44.432  13.616 (delta_t =  58.048 [sec])
Background time interval of the image:
-239.184 -44.432 (delta_t = 194.752 [sec])
Light Curves
Note: The mask-weighted lightcurves have units of either count/det or counts/sec/det, where a det is 0.4 x 0.4 = 0.16 sq cm.
Full-time range; 1 s binning
Other quick-look light curves:
- 64 ms binning (zoomed)
- 16 ms binning (zoomed)
- 8 ms binning (zoomed)
- 2 ms binning (zoomed)
- SN=5 or 10 s binning (full-time range)
- Raw light curve
Spectra
- 64 ms binning (zoomed)
- 16 ms binning (zoomed)
- 8 ms binning (zoomed)
- 2 ms binning (zoomed)
- SN=5 or 10 s binning (full-time range)
- Raw light curve
Spectra
Notes:
- 1) The fitting includes the systematic errors.
- 2) When the burst includes telescope slew time periods, the fitting uses an average response file made from multiple 5-s response files through out the slew time plus single time preiod for the non-slew times, and weighted by the total counts in the corresponding time period using addrmf. An average response file is needed becuase a spectral fit using the pre-slew DRM will introduce some errors in both a spectral shape and a normalization if the PHA file contains a lot of the slew/post-slew time interval.
- 3) For fits to more complicated models (e.g. a power-law over a cutoff power-law), the BAT team has decided to require a chi-square improvement of more than 6 for each extra dof.
Time averaged spectrum fit using the average DRM
Power-law model
Time interval is from  -44.432 sec. to   13.616 sec.

Spectral model in power-law:
------------------------------------------------------------
Parameters  : value       lower 90%   higher 90%
Photon index: -1.39779     ( -0.287202   0.289722 )
Norm@50keV  : 2.24462E-03    ( -0.000395816   0.00039519 )
------------------------------------------------------------
#Fit statistic  : Chi-Squared                   56.15     using 59 bins.
 Reduced chi-squared = 0.985088
# Null hypothesis probability of 5.07e-01 with 57 degrees of freedom

Photon flux (15-150 keV)    in 58.05 sec: 0.273221 ( -0.049403  0.049618 ) ph/cm2/s
Energy fluence (15-150 keV)             : 1.25977e-06 ( -2.39133e-07  2.41925e-07 ) ergs/cm2
Cutoff power-law model
Time interval is from  -44.432 sec. to   13.616 sec.
Spectral model in the cutoff power-law:
------------------------------------------------------------
Parameters  : value       lower 90%   higher 90%
Photon index: -0.140129     ( -1.30002   1.89508 )
Epeak [keV] : 73.9019      ( -20.6072 -73.9018 )
Norm@50keV  : 9.61273E-03    ( -0.00961279   0.0712921 )
------------------------------------------------------------
#Fit statistic  : Chi-Squared                   53.47     using 59 bins.
 Reduced chi-squared = 0.954821
# Null hypothesis probability of 5.71e-01 with 56 degrees of freedom

Photon flux (15-150 keV)    in 58.05 sec: 0.260139 ( -0.051644  0.051674 ) ph/cm2/s
Energy fluence (15-150 keV)             : 1.15431e-06 ( -2.5937e-07  2.68258e-07 ) ergs/cm2
1-s peak spectrum fit
Power-law model
Time interval is from    0.412 sec. to    1.412 sec.

Spectral model in power-law:
------------------------------------------------------------
Parameters  : value       lower 90%   higher 90%
Photon index: -1.29081     ( -0.373185   0.384326 )
Norm@50keV  : 1.42338E-02    ( -0.0031852   0.00318007 )
------------------------------------------------------------
#Fit statistic  : Chi-Squared                   68.18     using 59 bins.
 Reduced chi-squared = 1.19614
# Null hypothesis probability of 1.48e-01 with 57 degrees of freedom

Photon flux (15-150 keV)    in 1 sec: 1.69531 ( -0.40186  0.40539 ) ph/cm2/s
Energy fluence (15-150 keV)             : 1.40991e-07 ( -3.29621e-08  3.30935e-08 ) ergs/cm2
Cutoff power-law model
Time interval is from    0.412 sec. to    1.412 sec.
Spectral model in the cutoff power-law:
------------------------------------------------------------
Parameters  : value       lower 90%   higher 90%
Photon index: -0.635939     ( -0.912899   2.3029 )
Epeak [keV] : 116.556      ( -116.546 -116.546 )
Norm@50keV  : 2.84916E-02    ( -0.0170574   0.255268 )
------------------------------------------------------------
#Fit statistic  : Chi-Squared                   67.76     using 59 bins.
 Reduced chi-squared = 1.21
# Null hypothesis probability of 1.35e-01 with 56 degrees of freedom

Photon flux (15-150 keV)    in 1 sec: 1.65476 ( -0.4099  0.41883 ) ph/cm2/s
Energy fluence (15-150 keV)             : 1.37749e-07 ( -2.05403e-08  3.44339e-08 ) ergs/cm2
Time-resolved spectra
Distribution
T90 vs. Hardness ratio plot
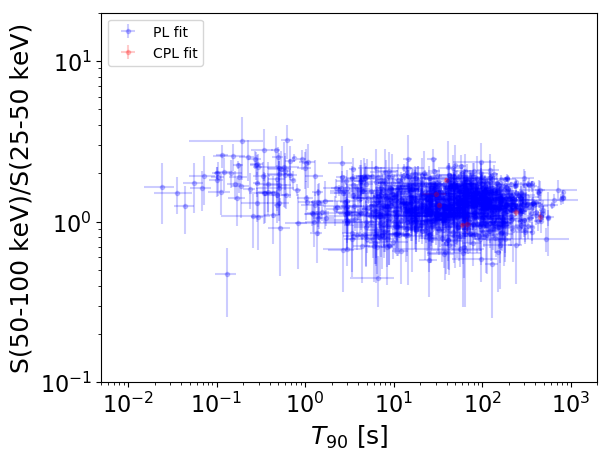
T90                                   = N/A sec.
Hardness ratio (energy fluence ratio) = N/A
S(15-50 keV) vs. S(50-150 keV) plot
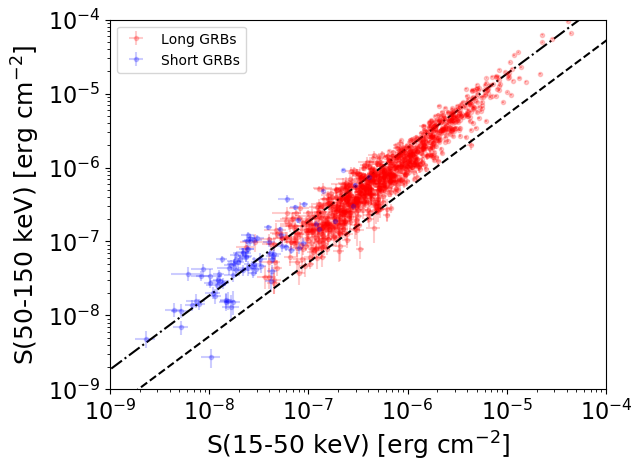
S(15-50 keV)  = N/A
S(50-150 keV) = N/A
The dash-dotted line and the dashed line traces the fluences calculated from the Band function with Epeak = 15 and 150 keV, respectively. Both lines assume a canonical values of alpha = -1 and beta = -2.5.
Mask shadow pattern
IMX = 5.920610100434884E-01, IMY = 6.490742208579083E-01
Spacecraft aspect plot
Bright source in the pre-burst/pre-slew/post-slew images
Pre-burst image of 15-350 keV band
Time interval of the image:
-239.184000 -44.432000

# RAcent  DECcent POSerr Theta    Phi  PeakCts   SNR AngSep     Name
#  [deg]    [deg]    ['] [deg]  [deg]                   [']
159.8449  22.2857    3.0  51.3   19.3   3.0455   3.9 ------	UNKNOWN
192.6608  25.3320    4.0  56.5  -17.7   3.4236   2.9 ------	UNKNOWN
Pre-slew background subtracted image of 15-350 keV band
Time interval of the image:
-44.432000 13.616000

# RAcent  DECcent POSerr Theta    Phi  PeakCts   SNR AngSep     Name
#  [deg]    [deg]    ['] [deg]  [deg]                   [']
160.5954  19.4793    2.3  54.2   19.1   2.5707   5.0 ------	UNKNOWN
210.6920  48.2092    1.5  41.3  -47.6   1.8491   7.7 ------	UNKNOWN
Post-slew image of 15-350 keV band
Time interval of the image:
95.516600 962.894500

# RAcent  DECcent POSerr Theta    Phi  PeakCts   SNR AngSep     Name
#  [deg]    [deg]    ['] [deg]  [deg]                   [']
254.4358  35.2926    2.1  34.6 -115.5   7.3135   5.4    3.2	Her X-1
132.3667  69.3607    2.6  41.8  117.9  13.5011   4.4 ------	UNKNOWN
157.7173  41.2733    3.1  37.5   68.7   6.3926   3.8 ------	UNKNOWN
 36.0669  82.7957    2.6  49.0  148.1  15.0519   4.5 ------	UNKNOWN
168.9617  58.8728    3.9  26.4   98.5   3.0770   3.0 ------	UNKNOWN
182.8603  -3.0509    3.1  56.7    2.9  11.7661   3.7 ------	UNKNOWN
323.7940  62.9450    2.9  57.0  179.0  17.0544   4.0 ------	UNKNOWN
213.1260  30.2339    2.4  18.1  -37.8   3.8033   4.9 ------	UNKNOWN
219.9443  -2.1461    3.2  51.0  -42.9  11.6879   3.7 ------	UNKNOWN
277.4819  36.4337    3.5  49.2 -133.1  12.0660   3.3 ------	UNKNOWN