Analysis Summary
Notes:
- 1) No attempt has been made to eliminate the non-significant decimal places.
- 2) This batgrbproduct analysis is done using the HEASARC data.
- 3) This batgrbproduct analysis is using the flight position for the mask-weighting calculation.
======================================================================
BAT GRB EVENT DATA PROCESSING REPORT
Process Script Ver: batgrbproduct v2.48
Process Start Time: Sat Jul 30 00:35:10 EDT 2022
Host Name: batproc1
Current Working Dir: /local/data/bat1/alien/Swift_3rdBATcatalog/event/batevent_reproc/trigger1015728
======================================================================
Trigger: 01015728 Segment: 000
BAT Trigger Time: 631312717.632 [s; MET]
Trigger Stop: 631312718.656 [s; MET]
UTC: 2021-01-02T20:38:11.370000 [includes UTCF correction]
Where From?: TDRSS position message
BAT
RA: 235.736638732015 Dec: -37.2221994622346 [deg; J2000]
Catalogged Source?: NO
Point Source?: YES
GRB Indicated?: YES [ by BAT flight software ]
Image S/N Ratio: 8.14
Image Trigger?: NO
Rate S/N Ratio: 12.9614813968157 [ if not an image trigger ]
Image S/N Ratio: 8.14
Analysis Position: [ source = BAT ]
RA: 235.736638732015 Dec: -37.2221994622346 [deg; J2000]
Refined Position: [ source = BAT pre-slew burst ]
RA: 235.74574873691 Dec: -37.2326440404327 [deg; J2000]
{ 15h 42m 59.0s , -37d 13' 57.5" }
+/- 0.908689608399914 [arcmin] (estimated 90% radius based on SNR)
+/- 0.33243278740122 [arcmin] (formal 1-sigma fit error)
SNR: 34.8758435346421
Angular difference between the analysis and refined position is 0.762982 arcmin
Partial Coding Fraction: 0.765625 [ including projection effects ]
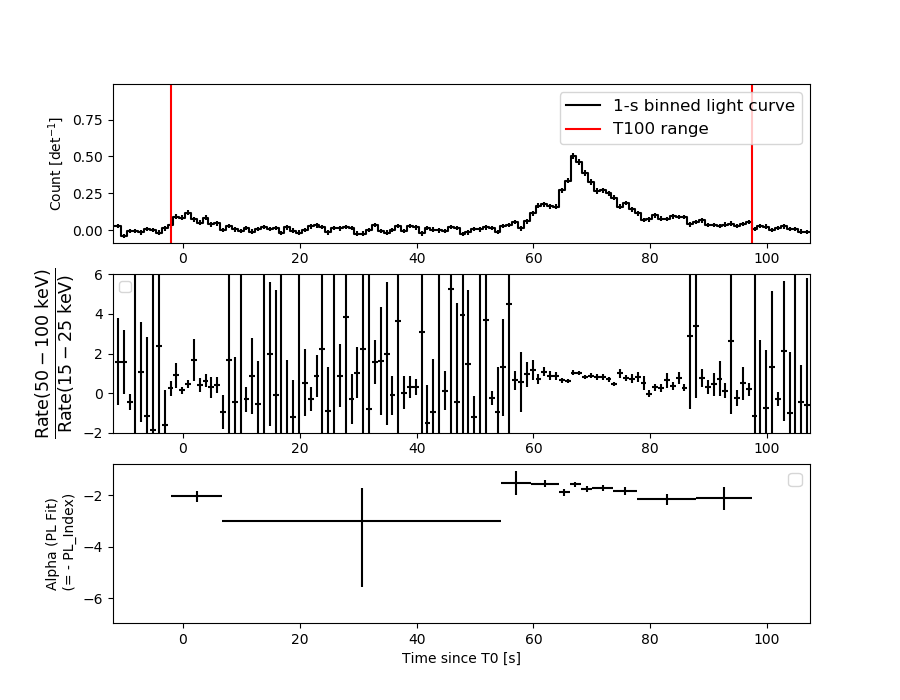
Duration
T90: 87.231999874115 +/- 5.08893396504204
Measured from: 1.50400006771088
to: 88.7359999418259 [s; relative to TRIGTIME]
T50: 10.6480000019073 +/- 1.45398753137765
Measured from: 63.7879999876022
to: 74.4359999895096 [s; relative to TRIGTIME]
Fluence
Peak Flux (peak 1 second)
Measured from: 66.7120000123978
to: 67.7120000123978 [s; relative to TRIGTIME]
Total Fluence
Measured from: -2.067999958992
to: 97.364000082016 [s; relative to TRIGTIME]
Band 1 Band 2 Band 3 Band 4
15-25 25-50 50-100 100-350 keV
Total 2.276403 2.682071 1.480108 0.353182
0.083889 0.085417 0.075149 0.068212 [error]
Peak 0.142896 0.203470 0.144546 0.024066
0.010720 0.011748 0.010260 0.007879 [error]
[ fluence units of on-axis counts / fully illuminated detector ]
======================================================================
====== Table of the duration information =============================
Value tstart tstop
T100 99.432 -2.068 97.364
T90 87.232 1.504 88.736
T50 10.648 63.788 74.436
Peak 1.000 66.712 67.712
====== Spectral Analysis Summary =====================================
Model : spectral model: simple power-law (PL) and cutoff power-law (CPL)
Ph_index : photon index: E^{Ph_index}
Ph_90err : 90% error of the photon index
Epeak : Epeak in keV
Epeak_90err: 90% error of Epeak
Norm : normalization at 50 keV in both the PL model and CPL model
Nomr_90err : 90% error of the normalization
chi2 : Chi-Squared
dof : degree of freedo
=== Time-averaged spectral analysis ===
(Best model with acceptable fit: N/A)
Model Ph_index Ph_90err_low Ph_90err_hi Epeak Epeak_90err_low Epeak_90err_hi Norm Nomr_90err_low Norm_90err_hi chi2 dof
PL -1.878 -0.082 0.081 - - - 4.27e-03 -1.94e-04 1.92e-04 47.020 57
CPL -1.727 -0.311 0.324 84.789 -26.064 -84.789 5.12e-03 -1.53e-03 2.39e-03 46.310 56
=== 1-s peak spectral analysis ===
(Best model with acceptable fit: N/A)
Model Ph_index Ph_90err_low Ph_90err_hi Epeak Epeak_90err_low Epeak_90err_hi Norm Nomr_90err_low Norm_90err_hi chi2 dof
PL -1.595 -0.113 0.111 - - - 3.45e-02 -2.39e-03 2.38e-03 42.820 57
CPL -0.939 -0.460 0.516 77.578 -16.360 67.754 7.60e-02 -3.18e-02 6.41e-02 36.650 56
=== Fluence/Peak Flux Summary ===
Model Band1 Band2 Band3 Band4 Band5 Total
15-25 25-50 50-100 100-350 15-150 15-350 keV
Fluence PL 7.73e-07 1.13e-06 1.23e-06 2.50e-06 3.90e-06 5.63e-06 erg/cm2
90%_error_low -5.42e-08 -4.72e-08 -7.73e-08 -3.21e-07 -1.76e-07 -3.87e-07 erg/cm2
90%_error_hi 5.54e-08 4.72e-08 7.75e-08 3.53e-07 1.77e-07 4.11e-07 erg/cm2
Peak flux PL 1.55e+00 1.48e+00 9.79e-01 1.01e+00 4.42e+00 5.02e+00 ph/cm2/s
90%_error_low -1.66e-01 -1.02e-01 -8.57e-02 -1.66e-01 -2.96e-01 -3.34e-01 ph/cm2/s
90%_error_hi 1.70e-01 1.01e-01 8.53e-02 1.84e-01 2.96e-01 3.34e-01 ph/cm2/s
Fluence CPL 7.55e-07 1.14e-06 1.23e-06 1.94e-06 3.84e-06 5.07e-06 erg/cm2
90%_error_low -6.46e-08 -5.62e-08 -7.91e-08 -7.52e-07 -2.12e-07 -7.90e-07 erg/cm2
90%_error_hi 6.53e-08 5.72e-08 7.94e-08 6.54e-07 2.10e-07 7.25e-07 erg/cm2
Peak flux CPL 1.40e+00 1.58e+00 1.02e+00 4.89e-01 4.31e+00 4.49e+00 ph/cm2/s
90%_error_low -1.95e-01 -1.25e-01 -9.54e-02 -1.90e-01 -3.06e-01 -3.68e-01 ph/cm2/s
90%_error_hi 1.98e-01 1.28e-01 9.65e-02 3.15e-01 3.06e-01 4.19e-01 ph/cm2/s
======================================================================
Image
Pre-slew 15.0-350.0 keV image (Event data)
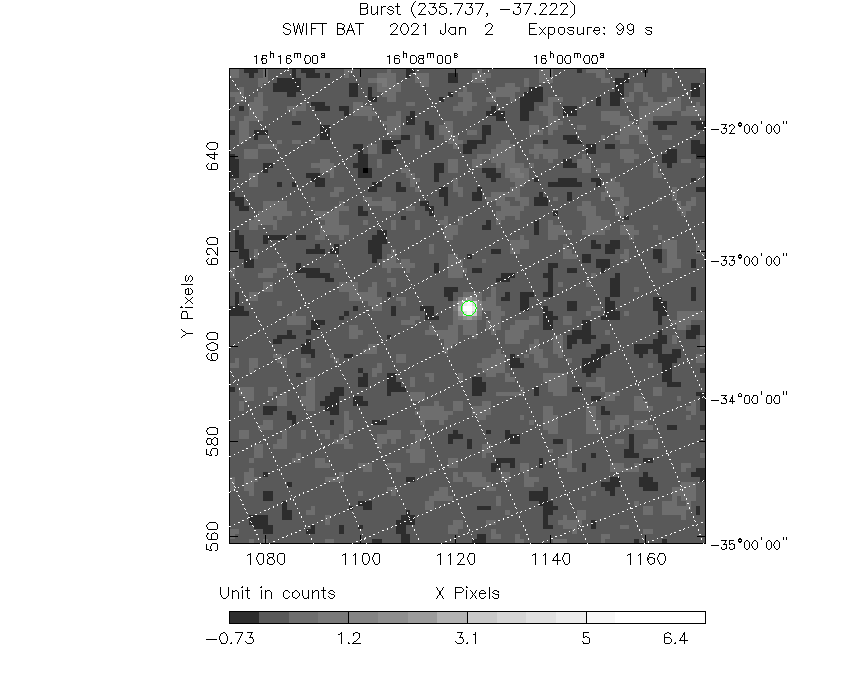
#   RAcent    DECcent   POSerr    Theta     Phi              Peak Cts       SNR   Name
  235.7457   -37.2326   0.0055    30.1407  -151.6118         7.0614982     34.876 TRIG_01015728

Foreground time interval of the image:
 -2.068  97.364 (delta_t =  99.432 [sec])
Background time interval of the image:
-239.632  -2.068 (delta_t = 237.564 [sec])
Light Curves
Note: The mask-weighted lightcurves have units of either count/det or counts/sec/det, where a det is 0.4 x 0.4 = 0.16 sq cm.
Full-time range; 1 s binning
Other quick-look light curves:
- 64 ms binning (zoomed)
- 16 ms binning (zoomed)
- 8 ms binning (zoomed)
- 2 ms binning (zoomed)
- SN=5 or 10 s binning (full-time range)
- Raw light curve
Spectra
- 64 ms binning (zoomed)
- 16 ms binning (zoomed)
- 8 ms binning (zoomed)
- 2 ms binning (zoomed)
- SN=5 or 10 s binning (full-time range)
- Raw light curve
Spectra
Notes:
- 1) The fitting includes the systematic errors.
- 2) When the burst includes telescope slew time periods, the fitting uses an average response file made from multiple 5-s response files through out the slew time plus single time preiod for the non-slew times, and weighted by the total counts in the corresponding time period using addrmf. An average response file is needed becuase a spectral fit using the pre-slew DRM will introduce some errors in both a spectral shape and a normalization if the PHA file contains a lot of the slew/post-slew time interval.
- 3) For fits to more complicated models (e.g. a power-law over a cutoff power-law), the BAT team has decided to require a chi-square improvement of more than 6 for each extra dof.
Time averaged spectrum fit using the average DRM
Power-law model
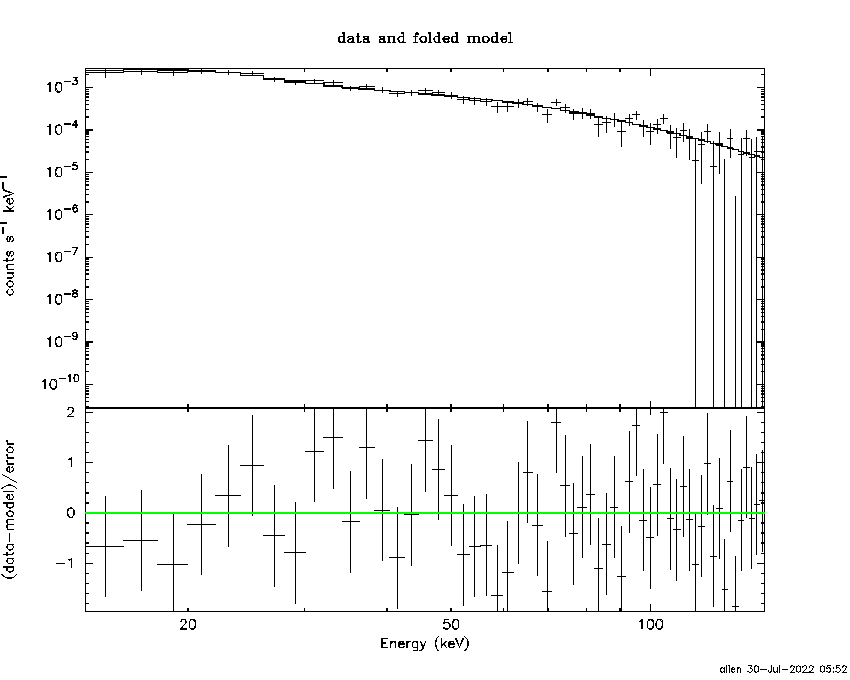
Time interval is from   -2.068 sec. to   97.364 sec.

Spectral model in power-law:
------------------------------------------------------------
Parameters  : value       lower 90%   higher 90%
Photon index: -1.87756     ( -0.0821029   0.0811261 )
Norm@50keV  : 4.26524E-03    ( -0.000193647   0.000192383 )
------------------------------------------------------------
#Fit statistic  : Chi-Squared                   47.02     using 59 bins.
 Reduced chi-squared = 0.824912
# Null hypothesis probability of 8.24e-01 with 57 degrees of freedom

Photon flux (15-150 keV)    in 99.43 sec: 0.606395 ( -0.026342  0.026414 ) ph/cm2/s
Energy fluence (15-150 keV)             : 3.89931e-06 ( -1.76097e-07  1.77005e-07 ) ergs/cm2
Cutoff power-law model
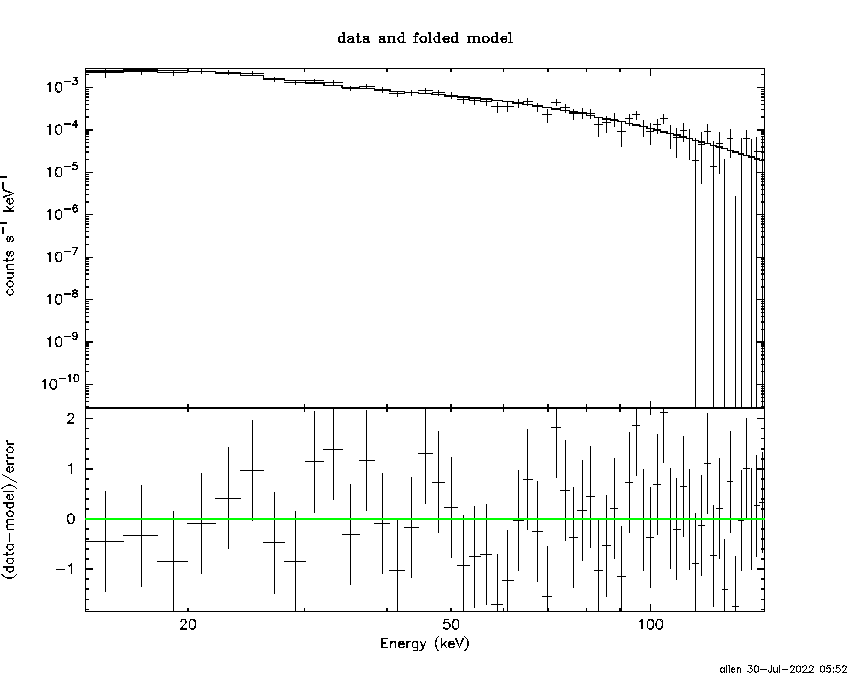
Time interval is from   -2.068 sec. to   97.364 sec.
Spectral model in the cutoff power-law:
------------------------------------------------------------
Parameters  : value       lower 90%   higher 90%
Photon index: -1.72688     ( -0.311201   0.324039 )
Epeak [keV] : 84.7894      ( -26.0645 -84.79 )
Norm@50keV  : 5.11729E-03    ( -0.00153225   0.00239426 )
------------------------------------------------------------
#Fit statistic  : Chi-Squared                   46.31     using 59 bins.
 Reduced chi-squared = 0.826964
# Null hypothesis probability of 8.19e-01 with 56 degrees of freedom

Photon flux (15-150 keV)    in 99.43 sec: 0.600161 ( -0.029039  0.029078 ) ph/cm2/s
Energy fluence (15-150 keV)             : 3.83979e-06 ( -2.12205e-07  2.10422e-07 ) ergs/cm2
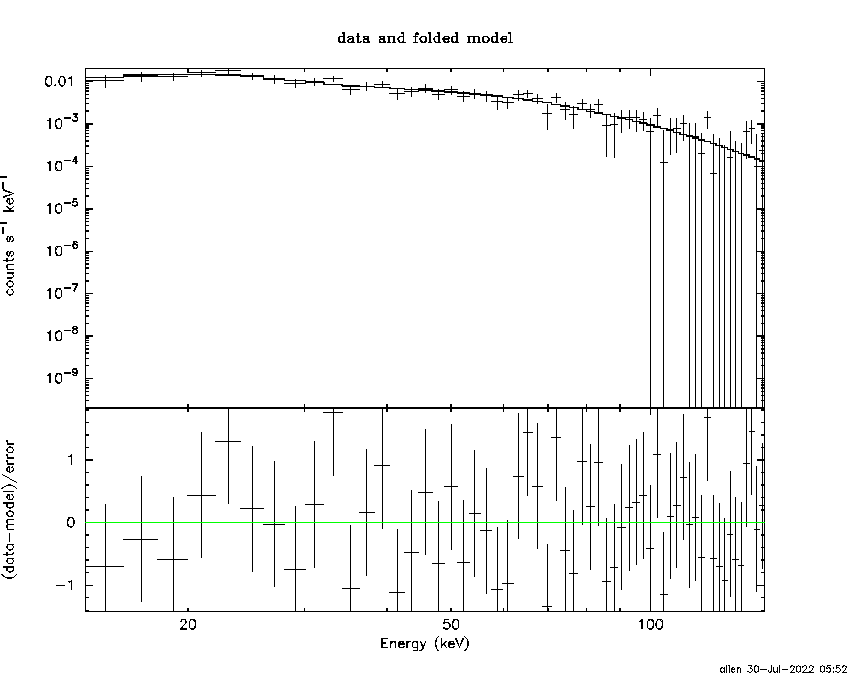
1-s peak spectrum fit
Power-law model

Time interval is from   66.712 sec. to   67.712 sec.

Spectral model in power-law:
------------------------------------------------------------
Parameters  : value       lower 90%   higher 90%
Photon index: -1.5946     ( -0.112768   0.111434 )
Norm@50keV  : 3.44685E-02    ( -0.00238807   0.00237525 )
------------------------------------------------------------
#Fit statistic  : Chi-Squared                   42.82     using 59 bins.
 Reduced chi-squared = 0.751228
# Null hypothesis probability of 9.18e-01 with 57 degrees of freedom

Photon flux (15-150 keV)    in 1 sec: 4.42213 ( -0.29566  0.2959 ) ph/cm2/s
Energy fluence (15-150 keV)             : 3.22612e-07 ( -2.395e-08  2.41249e-08 ) ergs/cm2
Cutoff power-law model
Time interval is from   66.712 sec. to   67.712 sec.
Spectral model in the cutoff power-law:
------------------------------------------------------------
Parameters  : value       lower 90%   higher 90%
Photon index: -0.939289     ( -0.4603   0.516183 )
Epeak [keV] : 77.5780      ( -16.3598 67.7537 )
Norm@50keV  : 7.60060E-02    ( -0.0317919   0.0640536 )
------------------------------------------------------------
#Fit statistic  : Chi-Squared                   36.65     using 59 bins.
 Reduced chi-squared = 0.654464
# Null hypothesis probability of 9.79e-01 with 56 degrees of freedom

Photon flux (15-150 keV)    in 1 sec: 4.31080 ( -0.30595  0.30585 ) ph/cm2/s
Energy fluence (15-150 keV)             : 3.06606e-07 ( -2.63854e-08  2.65748e-08 ) ergs/cm2
Time-resolved spectra
Distribution
T90 vs. Hardness ratio plot
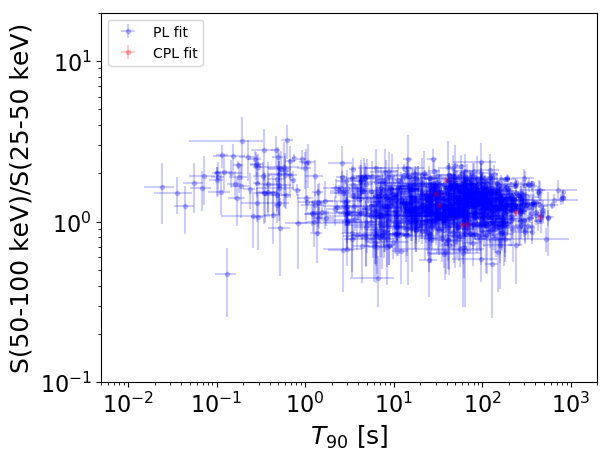
T90                                   = N/A sec.
Hardness ratio (energy fluence ratio) = N/A
S(15-50 keV) vs. S(50-150 keV) plot
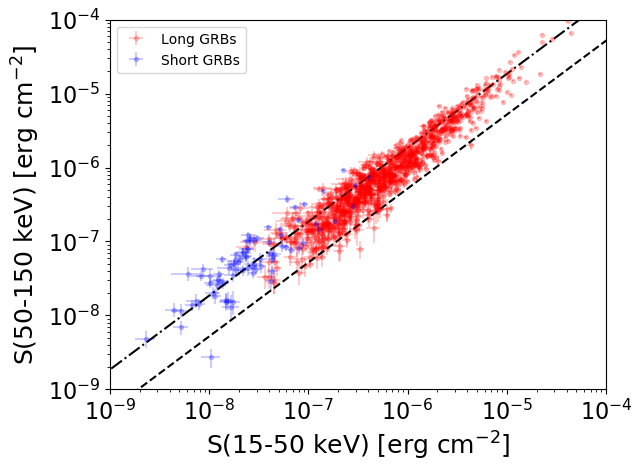
S(15-50 keV)  = N/A
S(50-150 keV) = N/A
The dash-dotted line and the dashed line traces the fluences calculated from the Band function with Epeak = 15 and 150 keV, respectively. Both lines assume a canonical values of alpha = -1 and beta = -2.5.
Mask shadow pattern
IMX = -5.108070927266599E-01, IMY = 2.760563595252863E-01
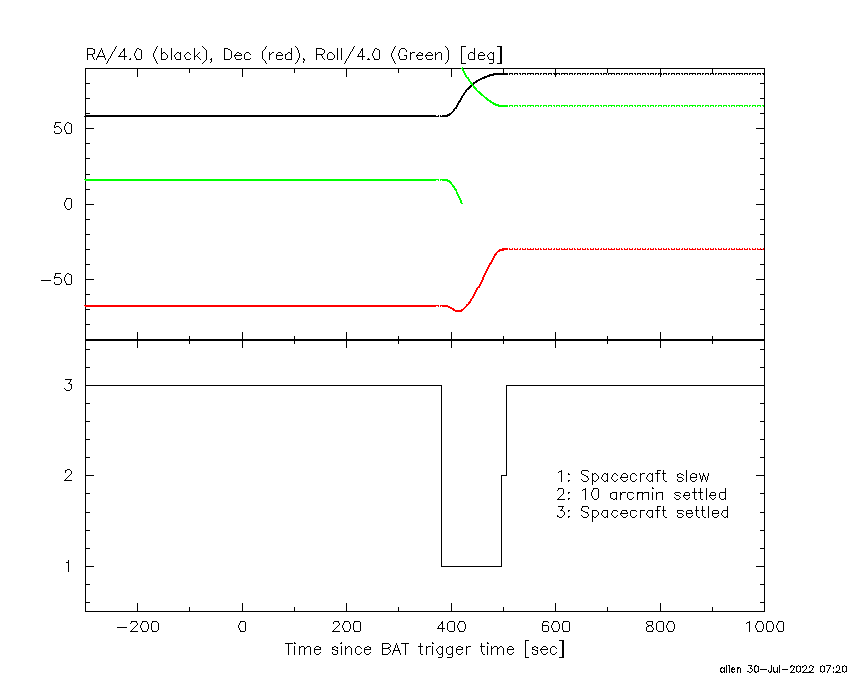
Spacecraft aspect plot
Bright source in the pre-burst/pre-slew/post-slew images
Pre-burst image of 15-350 keV band
Time interval of the image:
-239.632000 -2.068000

# RAcent  DECcent POSerr Theta    Phi  PeakCts   SNR AngSep     Name
#  [deg]    [deg]    ['] [deg]  [deg]                   [']
170.4615 -60.5101   11.6  27.3   98.6   0.4773   1.0    8.0	Cen X-3
186.7243 -62.6972    6.9  19.9  106.1   0.6108   1.7    4.8	GX 301-2
245.0279 -15.6776    3.3  52.2 -141.0   4.8995   3.5    3.6	Sco X-1
255.9692 -38.0278    0.0  31.9 -120.4   0.2004   0.4   11.0	4U 1700-377
256.3666 -36.4495   19.4  33.5 -120.7   0.2662   0.6    3.7	GX 349+2
264.6077 -44.3578    4.8  28.2 -103.8   1.0087   2.4    8.0	4U 1735-44
262.9445 -33.8608  115.6  37.5 -113.1   0.0710   0.1    2.7	GX 354-0
206.4748 -67.7876    2.4  10.3  100.2   1.3694   4.9 ------	UNKNOWN
208.3508 -24.4514    2.3  45.7  172.1   3.4312   4.9 ------	UNKNOWN
235.6190 -44.8199    3.0  22.6 -151.3   1.1267   3.9 ------	UNKNOWN
241.8985 -12.3998    3.8  55.2 -145.1   5.0738   3.0 ------	UNKNOWN
Pre-slew background subtracted image of 15-350 keV band
Time interval of the image:
-2.068000 97.364000

# RAcent  DECcent POSerr Theta    Phi  PeakCts   SNR AngSep     Name
#  [deg]    [deg]    ['] [deg]  [deg]                   [']
170.4606 -60.5098    4.0  27.3   98.6  -0.7512  -2.9    8.0	Cen X-3
186.3867 -62.7817    8.0  19.9  105.6   0.2917   1.4    7.4	GX 301-2
244.9855 -15.6618   19.1  52.2 -141.1  -0.4606  -0.6    1.3	Sco X-1
255.8953 -37.7308   11.1  32.1 -120.7   0.2750   1.0    8.1	4U 1700-377
256.3052 -36.4147    6.7  33.5 -120.8  -0.4774  -1.7    6.3	GX 349+2
265.0192 -44.4224   34.4  28.2 -103.2   0.0859   0.3   12.0	4U 1735-44
262.7847 -33.8249    9.0  37.5 -113.3   0.5169   1.3   10.2	GX 354-0
235.7458 -37.2326    0.3  30.1 -151.6   7.0618  34.9 ------	UNKNOWN
Post-slew image of 15-350 keV band
Time interval of the image:
495.768630 542.538000

# RAcent  DECcent POSerr Theta    Phi  PeakCts   SNR AngSep     Name
#  [deg]    [deg]    ['] [deg]  [deg]                   [']
350.6208  19.9527    2.5  50.1   15.0  23.4856   4.5 ------	UNKNOWN
286.4815 -58.1544    2.9  49.2 -133.1  41.6602   3.9 ------	UNKNOWN