Analysis Summary
Notes:
- 1) No attempt has been made to eliminate the non-significant decimal places.
- 2) This batgrbproduct analysis is done using the HEASARC data.
- 3) This batgrbproduct analysis is using the flight position for the mask-weighting calculation.
======================================================================
                  BAT GRB EVENT DATA PROCESSING REPORT
    Process Script Ver: batgrbproduct v2.48
    Process Start Time: Sat Jul 30 00:31:11 EDT 2022
             Host Name: batproc1
   Current Working Dir: /local/data/bat1/alien/Swift_3rdBATcatalog/event/batevent_reproc/trigger1015919
======================================================================

  Trigger: 01015919      Segment: 000

  BAT Trigger Time: 631487437.12   [s; MET]
      Trigger Stop: 631487438.144   [s; MET]
               UTC: 2021-01-04T21:10:10.846460    [includes UTCF correction]
       Where From?: TDRSS position message

  BAT
    RA: 53.6011737701449   Dec: 37.9308387655033  [deg; J2000]

     Catalogged Source?: NO
     Point Source?:      YES
     GRB Indicated?:     YES    [ by BAT flight software ]
     Image S/N Ratio:    7.88
     Image Trigger?:     NO
     Rate S/N Ratio:     11.5325625946708  [ if not an image trigger ]
     Image S/N Ratio:    7.88

  Analysis Position:   [ source = BAT ]
    RA: 53.6011737701449   Dec: 37.9308387655033  [deg; J2000]

  Refined Position:   [ source = BAT pre-slew burst ]
    RA: 53.5615447871282   Dec: 37.9486321886368  [deg; J2000]
        { 03h 34m 14.8s , +37d 56' 55.1" }
         +/- 1.57761719479648 [arcmin] (estimated 90% radius based on SNR)
         +/- 0.545469646542714 [arcmin] (formal 1-sigma fit error)
    SNR: 15.8583831676958

  Angular difference between the analysis and refined position is 2.157832 arcmin

  Partial Coding Fraction: 0.59375    [ including projection effects ]

  Duration
     T90: 19.944000005722 +/- 2.39839021478798
        Measured from: 0.371999979019165
                   to: 20.3159999847412     [s; relative to TRIGTIME]
     T50: 7.63199996948242 +/- 3.4077329369124
        Measured from: 6.42799997329712
                   to: 14.0599999427795     [s; relative to TRIGTIME]


  Fluence
     Peak Flux  (peak 1 second)
        Measured from: 10.8320000171661
                   to: 11.8320000171661     [s; relative to TRIGTIME]
     Total Fluence
        Measured from: -0.148000001907349
                   to: 22.7639999389648     [s; relative to TRIGTIME]

             Band 1     Band 2     Band 3     Band 4
              15-25      25-50     50-100    100-350     keV
 Total     0.744909   0.781686   0.503680   0.084162
           0.047175   0.049069   0.043959   0.042007 [error]
 Peak      0.069112   0.082681   0.061705   0.008709
           0.010705   0.011577   0.009718   0.008867 [error]

     [ fluence units of on-axis counts / fully illuminated detector ]

======================================================================


====== Table of the duration information =============================

        Value   tstart    tstop
T100   22.912   -0.148   22.764
T90    19.944    0.372   20.316
T50     7.632    6.428   14.060
Peak    1.000   10.832   11.832


====== Spectral Analysis Summary =====================================

Model      : spectral model: simple power-law (PL) and cutoff power-law (CPL)
Ph_index   : photon index: E^{Ph_index}
Ph_90err   : 90% error of the photon index
Epeak      : Epeak in keV
Epeak_90err: 90% error of Epeak
Norm       : normalization at 50 keV in both the PL model and CPL model
Nomr_90err : 90% error of the normalization
chi2       : Chi-Squared
dof        : degree of freedo

=== Time-averaged spectral analysis ===
(Best model with acceptable fit: N/A)

Model Ph_index Ph_90err_low Ph_90err_hi  Epeak  Epeak_90err_low  Epeak_90err_hi  Norm       Nomr_90err_low    Norm_90err_hi    chi2    dof
PL      -1.834    -0.141      0.137       -           -               -         5.60e-03     -4.66e-04          4.59e-04      55.120   57
CPL     -1.778    -0.497      0.531      179.309    -129.779      -179.309      6.01e-03     -2.28e-03          5.51e-03      55.080   56


=== 1-s peak spectral analysis ===
(Best model with acceptable fit: N/A)

Model Ph_index Ph_90err_low Ph_90err_hi  Epeak  Epeak_90err_low  Epeak_90err_hi  Norm       Nomr_90err_low    Norm_90err_hi    chi2    dof
PL      -1.740     -0.255     0.244       -           -               -         1.39e-02     -2.29e-03          2.24e-03      34.770   57
CPL     -1.238     -0.883     1.132       67.252     -54.732       -67.252      2.66e-02     -2.66e-02          8.73e-02      33.950   56


=== Fluence/Peak Flux Summary ===

              Model    Band1     Band2     Band3     Band4     Band5     Total
                       15-25     25-50    50-100    100-350    15-150    15-350    keV
Fluence         PL   2.24e-07  3.36e-07  3.77e-07  8.03e-07  1.18e-06  1.74e-06   erg/cm2
      90%_error_low -2.48e-08 -2.36e-08 -4.36e-08 -1.77e-07 -9.84e-08 -2.21e-07   erg/cm2
      90%_error_hi   2.55e-08  2.36e-08  4.39e-08  2.09e-07  9.98e-08  2.46e-07   erg/cm2
Peak flux       PL   7.21e-01  6.29e-01  3.77e-01  3.40e-01  1.87e+00  2.07e+00   ph/cm2/s
      90%_error_low -1.50e-01 -9.00e-02 -7.96e-02 -1.22e-01 -2.67e-01 -3.00e-01   ph/cm2/s
      90%_error_hi   1.56e-01  8.98e-02  7.98e-02  1.57e-01  2.67e-01  3.02e-01   ph/cm2/s

Fluence        CPL   2.23e-07  3.38e-07  3.78e-07  7.23e-07  1.17e-06  1.66e-06   erg/cm2
      90%_error_low -2.85e-08 -2.55e-08 -4.42e-08 -4.19e-07 -1.16e-07 -4.41e-07   erg/cm2
      90%_error_hi   2.79e-08  2.99e-08  4.40e-08  1.15e-07  1.05e-07  4.60e-07   erg/cm2
Peak flux      CPL   6.83e-01  6.70e-01  3.83e-01  1.77e-01  1.85e+00  1.91e+00   ph/cm2/s
      90%_error_low -1.70e-01 -1.13e-01 -8.73e-02 -1.77e-01 -2.72e-01 -3.11e-01   ph/cm2/s
      90%_error_hi   1.71e-01  1.22e-01  8.71e-02  2.08e-01  2.72e-01  3.68e-01   ph/cm2/s

======================================================================
Image
Pre-slew 15.0-350.0 keV image (Event data)
#   RAcent    DECcent   POSerr    Theta     Phi              Peak Cts       SNR   Name
   53.5615    37.9486   0.0122    25.7252  -108.9616         1.1051554     15.858 TRIG_01015919

Foreground time interval of the image:
 -0.148  11.381 (delta_t =  11.529 [sec])
Background time interval of the image:
-239.120  -0.148 (delta_t = 238.972 [sec])
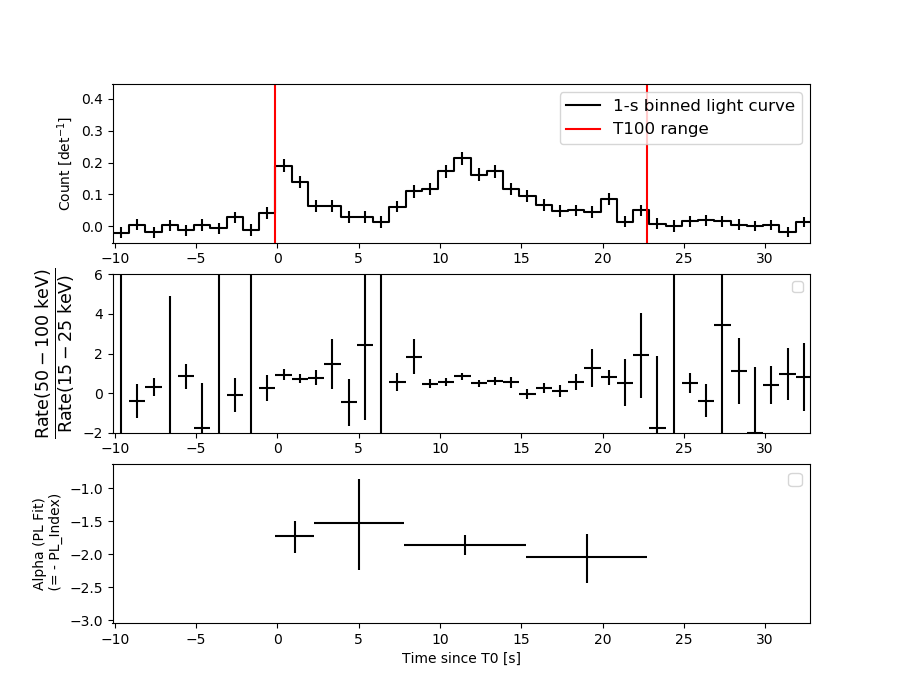
Light Curves
Note: The mask-weighted lightcurves have units of either count/det or counts/sec/det, where a det is 0.4 x 0.4 = 0.16 sq cm.
Full-time range; 1 s binning
Other quick-look light curves:
- 64 ms binning (zoomed)
- 16 ms binning (zoomed)
- 8 ms binning (zoomed)
- 2 ms binning (zoomed)
- SN=5 or 10 s binning (full-time range)
- Raw light curve
Spectra
- 64 ms binning (zoomed)
- 16 ms binning (zoomed)
- 8 ms binning (zoomed)
- 2 ms binning (zoomed)
- SN=5 or 10 s binning (full-time range)
- Raw light curve
Spectra
Notes:
- 1) The fitting includes the systematic errors.
- 2) When the burst includes telescope slew time periods, the fitting uses an average response file made from multiple 5-s response files through out the slew time plus single time preiod for the non-slew times, and weighted by the total counts in the corresponding time period using addrmf. An average response file is needed becuase a spectral fit using the pre-slew DRM will introduce some errors in both a spectral shape and a normalization if the PHA file contains a lot of the slew/post-slew time interval.
- 3) For fits to more complicated models (e.g. a power-law over a cutoff power-law), the BAT team has decided to require a chi-square improvement of more than 6 for each extra dof.
Time averaged spectrum fit using the average DRM
Power-law model

Time interval is from   -0.148 sec. to   22.764 sec.

Spectral model in power-law:
------------------------------------------------------------
Parameters  : value       lower 90%   higher 90%
Photon index: -1.83384     ( -0.141038   0.13723 )
Norm@50keV  : 5.59898E-03    ( -0.00046601   0.00045856 )
------------------------------------------------------------
#Fit statistic  : Chi-Squared                   55.12     using 59 bins.
 Reduced chi-squared = 0.967018
# Null hypothesis probability of 5.46e-01 with 57 degrees of freedom

Photon flux (15-150 keV)    in 22.91 sec: 0.781925 ( -0.055599  0.055668 ) ph/cm2/s
Energy fluence (15-150 keV)             : 1.17995e-06 ( -9.83584e-08  9.98251e-08 ) ergs/cm2
Cutoff power-law model
Time interval is from   -0.148 sec. to   22.764 sec.
Spectral model in the cutoff power-law:
------------------------------------------------------------
Parameters  : value       lower 90%   higher 90%
Photon index: -1.77767     ( -0.497468   0.53141 )
Epeak [keV] : 179.309      ( -129.808 -179.337 )
Norm@50keV  : 6.00710E-03    ( -0.0022793   0.00551084 )
------------------------------------------------------------
#Fit statistic  : Chi-Squared                   55.08     using 59 bins.
 Reduced chi-squared = 0.983571
# Null hypothesis probability of 5.10e-01 with 56 degrees of freedom

Photon flux (15-150 keV)    in 22.91 sec: 0.779489 ( -0.059374  0.057605 ) ph/cm2/s
Energy fluence (15-150 keV)             : 1.17275e-06 ( -1.15798e-07  1.0544e-07 ) ergs/cm2
1-s peak spectrum fit
Power-law model
Time interval is from   10.832 sec. to   11.832 sec.

Spectral model in power-law:
------------------------------------------------------------
Parameters  : value       lower 90%   higher 90%
Photon index: -1.73958     ( -0.255462   0.243651 )
Norm@50keV  : 1.39035E-02    ( -0.00229202   0.0022371 )
------------------------------------------------------------
#Fit statistic  : Chi-Squared                   34.77     using 59 bins.
 Reduced chi-squared = 0.61
# Null hypothesis probability of 9.91e-01 with 57 degrees of freedom

Photon flux (15-150 keV)    in 1 sec: 1.87290 ( -0.26689  0.26695 ) ph/cm2/s
Energy fluence (15-150 keV)             : 1.28396e-07 ( -2.1643e-08  2.20844e-08 ) ergs/cm2
Cutoff power-law model
Time interval is from   10.832 sec. to   11.832 sec.
Spectral model in the cutoff power-law:
------------------------------------------------------------
Parameters  : value       lower 90%   higher 90%
Photon index: -1.23818     ( -0.882495   1.13246 )
Epeak [keV] : 67.2517      ( -54.733 -67.2526 )
Norm@50keV  : 2.65635E-02    ( -0.026563   0.0872649 )
------------------------------------------------------------
#Fit statistic  : Chi-Squared                   33.95     using 59 bins.
 Reduced chi-squared = 0.60625
# Null hypothesis probability of 9.91e-01 with 56 degrees of freedom

Photon flux (15-150 keV)    in 1 sec: 1.84501 ( -0.27192  0.27193 ) ph/cm2/s
Energy fluence (15-150 keV)             : 1.22535e-07 ( -2.36e-08  2.45235e-08 ) ergs/cm2
Time-resolved spectra
Distribution
T90 vs. Hardness ratio plot
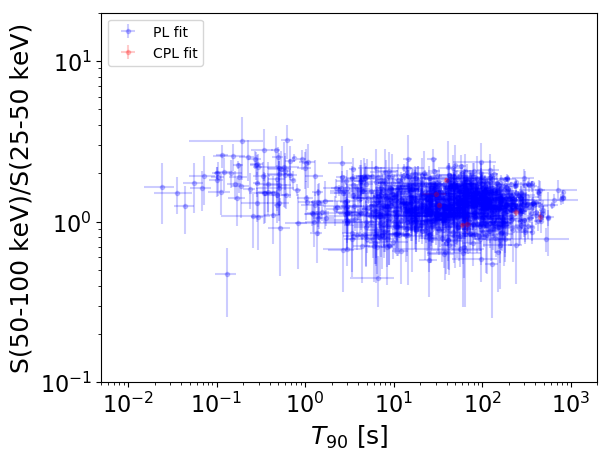
T90                                   = N/A sec.
Hardness ratio (energy fluence ratio) = N/A
S(15-50 keV) vs. S(50-150 keV) plot
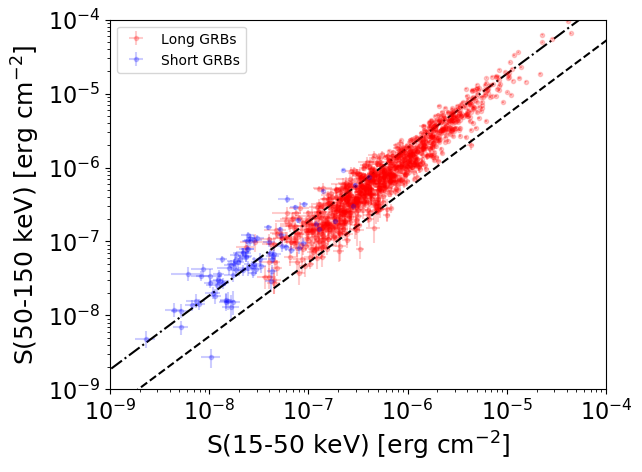
S(15-50 keV)  = N/A
S(50-150 keV) = N/A
The dash-dotted line and the dashed line traces the fluences calculated from the Band function with Epeak = 15 and 150 keV, respectively. Both lines assume a canonical values of alpha = -1 and beta = -2.5.
Mask shadow pattern
IMX = -1.565562409960690E-01, IMY = 4.556650039485672E-01
Spacecraft aspect plot
Bright source in the pre-burst/pre-slew/post-slew images
Pre-burst image of 15-350 keV band
Time interval of the image:
-239.120000 -0.148000

# RAcent  DECcent POSerr Theta    Phi  PeakCts   SNR AngSep     Name
#  [deg]    [deg]    ['] [deg]  [deg]                   [']
 83.6341  22.0055    0.4   9.9  141.8   9.2685  26.7    0.5	Crab
120.3684  14.1168    2.3  37.5   68.6   4.0325   5.0 ------	UNKNOWN
147.9431  55.4088    2.3  49.6    0.7   3.1285   5.0 ------	UNKNOWN
Pre-slew background subtracted image of 15-350 keV band
Time interval of the image:
-0.148000 11.380600

# RAcent  DECcent POSerr Theta    Phi  PeakCts   SNR AngSep     Name
#  [deg]    [deg]    ['] [deg]  [deg]                   [']
 83.4729  21.9574    7.0   9.9  142.7   0.0836   1.7    9.6	Crab
 48.8956 -12.5655    2.6  55.8 -178.2   0.9110   4.4 ------	UNKNOWN
 53.5615  37.9486    0.7  25.7 -109.0   1.1048  15.9 ------	UNKNOWN
Post-slew image of 15-350 keV band
Time interval of the image:
64.380600 752.080600

# RAcent  DECcent POSerr Theta    Phi  PeakCts   SNR AngSep     Name
#  [deg]    [deg]    ['] [deg]  [deg]                   [']
 83.6561  22.0217    0.5  30.3  109.9  27.7541  21.8    1.3	Crab
 72.1922  16.5759    2.8  26.9  134.4   4.5671   4.1 ------	UNKNOWN
307.2871  77.3895    3.3  56.5  -17.7   9.3773   3.5 ------	UNKNOWN
  5.6034  28.4166    3.8  40.8  -92.0  12.6842   3.1 ------	UNKNOWN
 16.4857   3.9104    2.3  48.0 -129.0  17.9718   4.9 ------	UNKNOWN