Analysis Summary
Notes:
- 1) No attempt has been made to eliminate the non-significant decimal places.
- 2) This batgrbproduct analysis is done using the HEASARC data.
- 3) This batgrbproduct analysis is using the flight position for the mask-weighting calculation.
======================================================================
                  BAT GRB EVENT DATA PROCESSING REPORT
    Process Script Ver: batgrbproduct v2.48
    Process Start Time: Sat Jul 30 00:29:31 EDT 2022
             Host Name: batproc1
   Current Working Dir: /local/data/bat1/alien/Swift_3rdBATcatalog/event/batevent_reproc/trigger1016881
======================================================================

  Trigger: 01016881      Segment: 000

  BAT Trigger Time: 632108250.112   [s; MET]
      Trigger Stop: 632108251.136   [s; MET]
               UTC: 2021-01-12T01:37:03.797420    [includes UTCF correction]
       Where From?: TDRSS position message

  BAT
    RA: 218.999082286325   Dec: 33.0702035814177  [deg; J2000]

     Catalogged Source?: NO
     Point Source?:      YES
     GRB Indicated?:     YES    [ by BAT flight software ]
     Image S/N Ratio:    10.89
     Image Trigger?:     NO
     Rate S/N Ratio:     22.8035085019828  [ if not an image trigger ]
     Image S/N Ratio:    10.89

  Analysis Position:   [ source = BAT ]
    RA: 218.999082286325   Dec: 33.0702035814177  [deg; J2000]

  Refined Position:   [ source = BAT pre-slew burst ]
    RA: 219.005457693803   Dec: 33.0584299896213  [deg; J2000]
        { 14h 36m 01.3s , +33d 03' 30.3" }
         +/- 1.1874943347632 [arcmin] (estimated 90% radius based on SNR)
         +/- 0.390299031832505 [arcmin] (formal 1-sigma fit error)
    SNR: 23.7958863000741

  Angular difference between the analysis and refined position is 0.775753 arcmin

  Partial Coding Fraction: 0.8984375    [ including projection effects ]

  Duration
     T90: 107.599999904633 +/- 13.0197710219243
        Measured from: 16.4400000572205
                   to: 124.039999961853     [s; relative to TRIGTIME]
     T50: 11.0799999237061 +/- 0.449177024684134
        Measured from: 66.2760000228882
                   to: 77.3559999465942     [s; relative to TRIGTIME]


  Fluence
     Peak Flux  (peak 1 second)
        Measured from: 68.8639999628067
                   to: 69.8639999628067     [s; relative to TRIGTIME]
     Total Fluence
        Measured from: -10.4399999380112
                   to: 218.472000002861     [s; relative to TRIGTIME]

             Band 1     Band 2     Band 3     Band 4
              15-25      25-50     50-100    100-350     keV
 Total     9.110490  13.216453  10.791416   2.917142
           0.108129   0.116069   0.104330   0.083213 [error]
 Peak      0.552069   0.891947   0.830280   0.261876
           0.014429   0.017801   0.018158   0.012460 [error]

     [ fluence units of on-axis counts / fully illuminated detector ]

======================================================================


====== Table of the duration information =============================

        Value   tstart    tstop
T100  228.912  -10.440  218.472
T90   107.600   16.440  124.040
T50    11.080   66.276   77.356
Peak    1.000   68.864   69.864


====== Spectral Analysis Summary =====================================

Model      : spectral model: simple power-law (PL) and cutoff power-law (CPL)
Ph_index   : photon index: E^{Ph_index}
Ph_90err   : 90% error of the photon index
Epeak      : Epeak in keV
Epeak_90err: 90% error of Epeak
Norm       : normalization at 50 keV in both the PL model and CPL model
Nomr_90err : 90% error of the normalization
chi2       : Chi-Squared
dof        : degree of freedo

=== Time-averaged spectral analysis ===
(Best model with acceptable fit: N/A)

Model Ph_index Ph_90err_low Ph_90err_hi  Epeak  Epeak_90err_low  Epeak_90err_hi  Norm       Nomr_90err_low    Norm_90err_hi    chi2    dof
PL      -1.399    -0.028      0.029       -           -               -         1.02e-02     -1.55e-04          1.55e-04      27.670   57
CPL     -1.334    -0.087      0.116      621.736    -621.736      -621.736      1.09e-02     -3.98e-04          1.22e-03      26.710   56


=== 1-s peak spectral analysis ===
(Best model with acceptable fit: N/A)

Model Ph_index Ph_90err_low Ph_90err_hi  Epeak  Epeak_90err_low  Epeak_90err_hi  Norm       Nomr_90err_low    Norm_90err_hi    chi2    dof
PL      -1.179     -0.046     0.046       -           -               -         1.66e-01     -4.07e-03          4.07e-03      38.360   57
CPL     -1.097     -0.103     0.156      588.514    -588.514      -588.514      1.80e-01     -2.46e-02          2.71e-02      38.580   56


=== Fluence/Peak Flux Summary ===

              Model    Band1     Band2     Band3     Band4     Band5     Total
                       15-25     25-50    50-100    100-350    15-150    15-350    keV
Fluence         PL   2.72e-06  5.32e-06  8.06e-06  2.66e-05  2.26e-05  4.27e-05   erg/cm2
      90%_error_low -9.20e-08 -1.05e-07 -1.29e-07 -1.01e-06 -3.33e-07 -1.04e-06   erg/cm2
      90%_error_hi   9.35e-08  1.05e-07  1.29e-07  1.04e-06  3.33e-07  1.06e-06   erg/cm2
Peak flux       PL   1.43e-03  1.70e-02  2.68e-01  2.34e+01  1.22e+00  2.36e+01   ph/cm2/s
      90%_error_low     N/A       N/A       N/A       N/A       N/A       N/A     ph/cm2/s
      90%_error_hi      N/A       N/A       N/A       N/A       N/A       N/A     ph/cm2/s

Fluence        CPL   2.66e-06  5.32e-06  8.12e-06  2.48e-05  2.25e-05  4.18e-05   erg/cm2
      90%_error_low -1.29e-07 -1.06e-07 -1.59e-07 -3.17e-06 -3.55e-07 -4.13e-06   erg/cm2
      90%_error_hi   1.26e-07  1.06e-07  1.59e-07  2.28e-06  3.52e-07  1.16e-06   erg/cm2
Peak flux      CPL   4.96e+00  6.15e+00  5.44e+00  8.27e+00  1.94e+01  2.43e+01   ph/cm2/s
      90%_error_low -3.39e-01 -1.95e-01 -1.61e-01 -1.79e+00 -5.42e-01 -1.42e+00   ph/cm2/s
      90%_error_hi   2.76e-01  1.86e-01  1.80e-01  2.65e-01  5.04e-01  7.71e-01   ph/cm2/s

======================================================================
Image
Pre-slew 15.0-350.0 keV image (Event data)
#   RAcent    DECcent   POSerr    Theta     Phi              Peak Cts       SNR   Name
  219.0055    33.0584   0.0081    24.2678    -1.9162         1.7823304     23.796 TRIG_01016881

Foreground time interval of the image:
-10.440  15.789 (delta_t =  26.229 [sec])
Background time interval of the image:
-239.112 -10.440 (delta_t = 228.672 [sec])
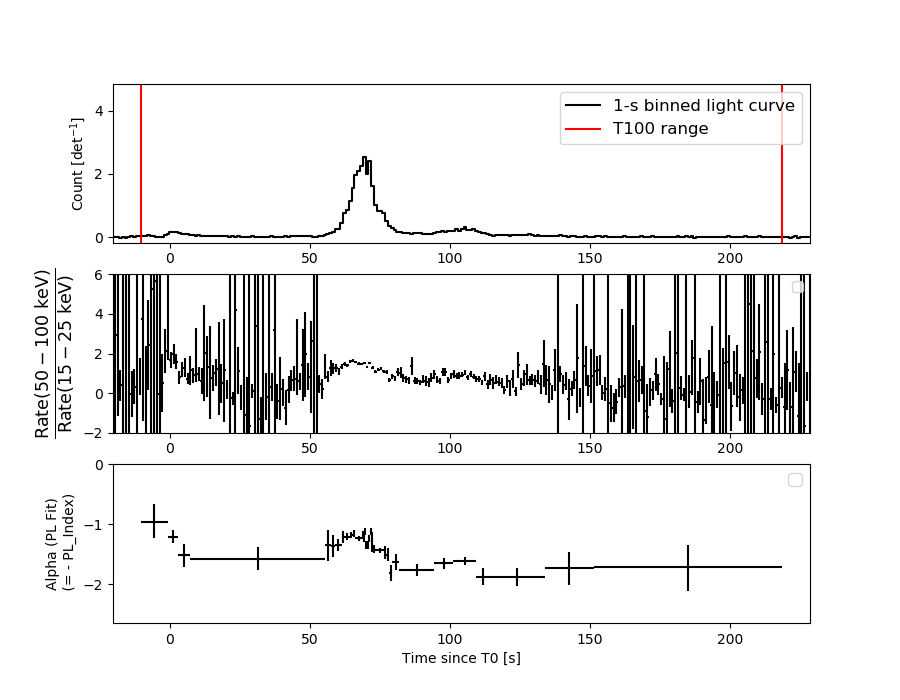
Light Curves
Note: The mask-weighted lightcurves have units of either count/det or counts/sec/det, where a det is 0.4 x 0.4 = 0.16 sq cm.
Full-time range; 1 s binning
Other quick-look light curves:
- 64 ms binning (zoomed)
- 16 ms binning (zoomed)
- 8 ms binning (zoomed)
- 2 ms binning (zoomed)
- SN=5 or 10 s binning (full-time range)
- Raw light curve
Spectra
- 64 ms binning (zoomed)
- 16 ms binning (zoomed)
- 8 ms binning (zoomed)
- 2 ms binning (zoomed)
- SN=5 or 10 s binning (full-time range)
- Raw light curve
Spectra
Notes:
- 1) The fitting includes the systematic errors.
- 2) When the burst includes telescope slew time periods, the fitting uses an average response file made from multiple 5-s response files through out the slew time plus single time preiod for the non-slew times, and weighted by the total counts in the corresponding time period using addrmf. An average response file is needed becuase a spectral fit using the pre-slew DRM will introduce some errors in both a spectral shape and a normalization if the PHA file contains a lot of the slew/post-slew time interval.
- 3) For fits to more complicated models (e.g. a power-law over a cutoff power-law), the BAT team has decided to require a chi-square improvement of more than 6 for each extra dof.
Time averaged spectrum fit using the average DRM
Power-law model
Time interval is from  -10.440 sec. to  218.472 sec.

Spectral model in power-law:
------------------------------------------------------------
Parameters  : value       lower 90%   higher 90%
Photon index: -1.39934     ( -0.0284721   0.0285561 )
Norm@50keV  : 1.02253E-02    ( -0.000155511   0.000155235 )
------------------------------------------------------------
#Fit statistic  : Chi-Squared                   27.67     using 59 bins.
 Reduced chi-squared = 0.485439
# Null hypothesis probability of 1.00e+00 with 57 degrees of freedom

Photon flux (15-150 keV)    in 228.9 sec: 1.24509 ( -0.02245  0.02252 ) ph/cm2/s
Energy fluence (15-150 keV)             : 2.26223e-05 ( -3.32988e-07  3.32665e-07 ) ergs/cm2
Cutoff power-law model

Time interval is from  -10.440 sec. to  218.472 sec.
Spectral model in the cutoff power-law:
------------------------------------------------------------
Parameters  : value       lower 90%   higher 90%
Photon index: -1.33398     ( -0.0867241   0.115509 )
Epeak [keV] : 621.736      ( -621.79 -621.79 )
Norm@50keV  : 1.08773E-02    ( -0.000397896   0.00122201 )
------------------------------------------------------------
#Fit statistic  : Chi-Squared                   26.71     using 59 bins.
 Reduced chi-squared = 0.476964
# Null hypothesis probability of 1.00e+00 with 56 degrees of freedom

Photon flux (15-150 keV)    in 228.9 sec: 1.23758 ( -0.02563  0.02439 ) ph/cm2/s
Energy fluence (15-150 keV)             : 2.25479e-05 ( -3.55408e-07  3.51604e-07 ) ergs/cm2
1-s peak spectrum fit
Power-law model
Time interval is from   68.864 sec. to   69.864 sec.

Spectral model in power-law:
------------------------------------------------------------
Parameters  : value       lower 90%   higher 90%
Photon index: -1.17878     ( -0.0455613   0.0456232 )
Norm@50keV  : 0.166048    ( -0.00406879   0.00406738 )
------------------------------------------------------------
#Fit statistic  : Chi-Squared                   38.36     using 59 bins.
 Reduced chi-squared = 0.672982
# Null hypothesis probability of 9.73e-01 with 57 degrees of freedom

Photon flux (15-150 keV)    in 1 sec: 1.22138 (    ) ph/cm2/s
Energy fluence (15-150 keV)             : 1.69508e-06 ( -4.53229e-08  4.54039e-08 ) ergs/cm2
Cutoff power-law model
Time interval is from   68.864 sec. to   69.864 sec.
Spectral model in the cutoff power-law:
------------------------------------------------------------
Parameters  : value       lower 90%   higher 90%
Photon index: -1.09671     ( -0.0683688   0.190242 )
Epeak [keV] : 588.514      ( -998.921 -998.921 )
Norm@50keV  : 0.180491    ( -0.0188975   0.0328621 )
------------------------------------------------------------
#Fit statistic  : Chi-Squared                   38.58     using 59 bins.
 Reduced chi-squared = 0.688929
# Null hypothesis probability of 9.63e-01 with 56 degrees of freedom

Photon flux (15-150 keV)    in 1 sec: 19.3885 ( -0.5422  0.5041 ) ph/cm2/s
Energy fluence (15-150 keV)             : 1.69075e-06 ( -4.79678e-08  4.71309e-08 ) ergs/cm2
Time-resolved spectra
Distribution
T90 vs. Hardness ratio plot
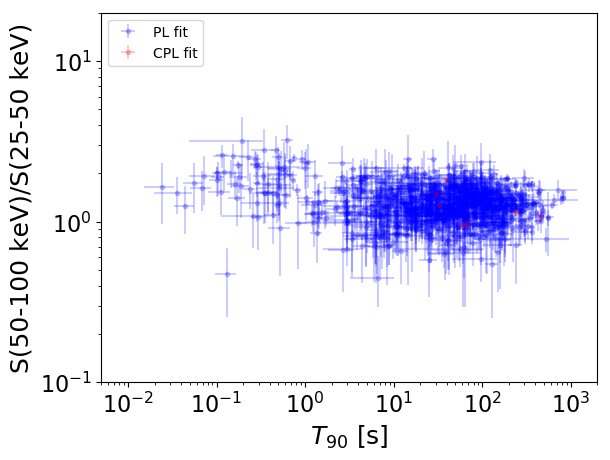
T90                                   = N/A sec.
Hardness ratio (energy fluence ratio) = N/A
S(15-50 keV) vs. S(50-150 keV) plot
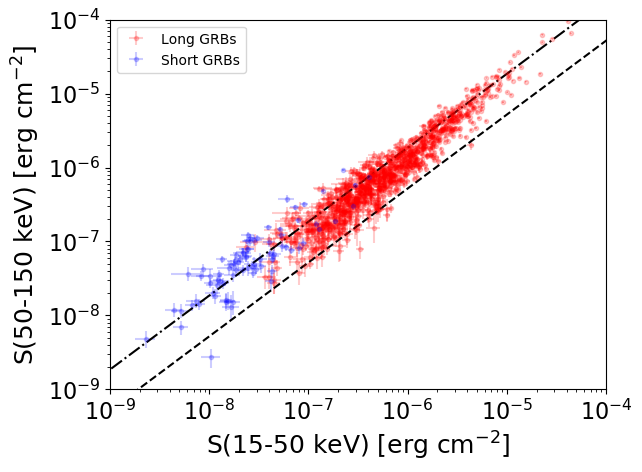
S(15-50 keV)  = N/A
S(50-150 keV) = N/A
The dash-dotted line and the dashed line traces the fluences calculated from the Band function with Epeak = 15 and 150 keV, respectively. Both lines assume a canonical values of alpha = -1 and beta = -2.5.
Mask shadow pattern
IMX = 4.505885202684413E-01, IMY = 1.507483326274372E-02
Spacecraft aspect plot
Bright source in the pre-burst/pre-slew/post-slew images
Pre-burst image of 15-350 keV band
Time interval of the image:
-239.112000 -10.440000

# RAcent  DECcent POSerr Theta    Phi  PeakCts   SNR AngSep     Name
#  [deg]    [deg]    ['] [deg]  [deg]                   [']
254.3068  35.4287    7.7  27.0  -72.7   0.5093   1.5    9.0	Her X-1
197.4932  48.1564    2.7  20.7   57.5   1.2077   4.3 ------	UNKNOWN
323.1135  45.9647    5.2  55.2 -145.1   3.2348   2.2 ------	UNKNOWN
Pre-slew background subtracted image of 15-350 keV band
Time interval of the image:
-10.440000 15.788600

# RAcent  DECcent POSerr Theta    Phi  PeakCts   SNR AngSep     Name
#  [deg]    [deg]    ['] [deg]  [deg]                   [']
254.5318  35.2882   25.6  27.2  -72.9  -0.0446  -0.4    4.9	Her X-1
169.9945  57.5781    2.4  31.2   94.7   0.5649   4.8 ------	UNKNOWN
219.0055  33.0584    0.5  24.3   -1.9   1.7822  23.8 ------	UNKNOWN
247.8556  29.9497    2.1  29.5  -57.3   0.5217   5.6 ------	UNKNOWN
Post-slew image of 15-350 keV band
Time interval of the image:
63.188590 715.982000
720.888000 963.006100

# RAcent  DECcent POSerr Theta    Phi  PeakCts   SNR AngSep     Name
#  [deg]    [deg]    ['] [deg]  [deg]                   [']
254.5415  35.2105   51.0  29.4 -130.2  -0.2971  -0.2    8.9	Her X-1
191.2839 -13.7707    3.3  53.8    8.0   9.1435   3.5 ------	UNKNOWN
219.0020  33.0404    0.3   0.0  -66.7  31.6984  35.8 ------	UNKNOWN
226.1683 -10.8418    2.2  44.4  -36.1   9.1825   5.3 ------	UNKNOWN
289.0790  40.2559    4.2  55.2 -145.1  14.9515   2.8 ------	UNKNOWN
237.4893 -11.5700    3.1  48.0  -50.7  14.9246   3.7 ------	UNKNOWN