Analysis Summary
Notes:
- 1) No attempt has been made to eliminate the non-significant decimal places.
- 2) This batgrbproduct analysis is done using the HEASARC data.
- 3) This batgrbproduct analysis is using the flight position for the mask-weighting calculation.
======================================================================
BAT GRB EVENT DATA PROCESSING REPORT
Process Script Ver: batgrbproduct v2.48
Process Start Time: Sat Jul 30 00:26:23 EDT 2022
Host Name: batproc1
Current Working Dir: /local/data/bat1/alien/Swift_3rdBATcatalog/event/batevent_reproc/trigger1017711
======================================================================
Trigger: 01017711 Segment: 000
BAT Trigger Time: 632717676.152 [s; MET]
Trigger Stop: 632717676.184 [s; MET]
UTC: 2021-01-19T02:54:09.797180 [includes UTCF correction]
Where From?: (*SHORT BURST*) TDRSS scaled map message
BAT
RA: 282.804265797649 Dec: -61.8007488114657 [deg; J2000]
Catalogged Source?: NO
Point Source?: YES
GRB Indicated?: YES [ by BAT flight software ]
Image S/N Ratio: 12.02
Image Trigger?: NO
Rate S/N Ratio: 49.3659801887899 [ if not an image trigger ]
Image S/N Ratio: 12.02
Analysis Position: [ source = BAT ]
RA: 282.804265797649 Dec: -61.8007488114657 [deg; J2000]
Refined Position: [ source = BAT pre-slew burst ]
RA: 282.822328933751 Dec: -61.7665733995358 [deg; J2000]
{ 18h 51m 17.4s , -61d 45' 59.7" }
+/- 1.50176461218237 [arcmin] (estimated 90% radius based on SNR)
+/- 0.48372823800027 [arcmin] (formal 1-sigma fit error)
SNR: 17.0149234487392
Angular difference between the analysis and refined position is 2.113581 arcmin
Partial Coding Fraction: 0.9296875 [ including projection effects ]
Duration
T90: 0.0640000104904175 +/- 0.020396072630595
Measured from: 0
to: 0.0640000104904175 [s; relative to TRIGTIME]
T50: 0.0279999971389771 +/- 0.00800001621246338
Measured from: 0.00800001621246338
to: 0.0360000133514404 [s; relative to TRIGTIME]
Fluence
Peak Flux (peak 1 second)
Measured from: -0.45799994468689
to: 0.54200005531311 [s; relative to TRIGTIME]
Total Fluence
Measured from: 0
to: 0.0800000429153442 [s; relative to TRIGTIME]
Band 1 Band 2 Band 3 Band 4
15-25 25-50 50-100 100-350 keV
Total 0.021271 0.042316 0.046166 0.012320
0.003576 0.004342 0.004291 0.002927 [error]
Peak 0.017522 0.046319 0.040518 0.010518
0.008715 0.008343 0.007470 0.005823 [error]
[ fluence units of on-axis counts / fully illuminated detector ]
======================================================================
====== Table of the duration information =============================
Value tstart tstop
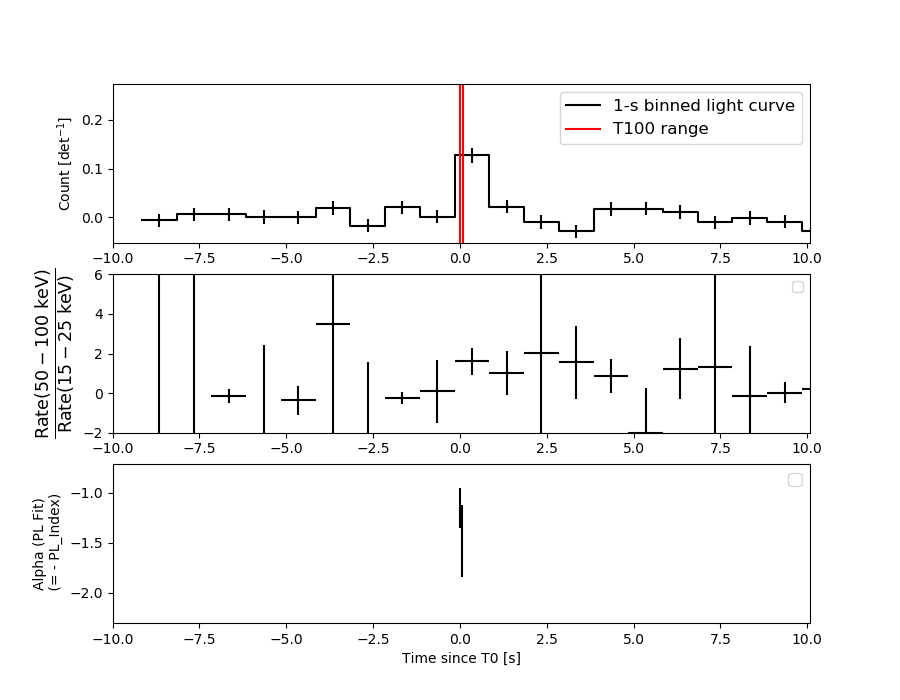
T100 0.080 0.000 0.080
T90 0.064 0.000 0.064
T50 0.028 0.008 0.036
Peak 1.000 -0.458 0.542
====== Spectral Analysis Summary =====================================
Model : spectral model: simple power-law (PL) and cutoff power-law (CPL)
Ph_index : photon index: E^{Ph_index}
Ph_90err : 90% error of the photon index
Epeak : Epeak in keV
Epeak_90err: 90% error of Epeak
Norm : normalization at 50 keV in both the PL model and CPL model
Nomr_90err : 90% error of the normalization
chi2 : Chi-Squared
dof : degree of freedo
=== Time-averaged spectral analysis ===
(Best model with acceptable fit: N/A)
Model Ph_index Ph_90err_low Ph_90err_hi Epeak Epeak_90err_low Epeak_90err_hi Norm Nomr_90err_low Norm_90err_hi chi2 dof
PL -1.264 -0.169 0.169 - - - 8.75e-02 -9.88e-03 9.88e-03 94.430 57
CPL 0.062 -0.815 1.011 83.491 -16.543 48.904 3.80e-01 -2.22e-01 7.25e-01 85.890 56
=== 1-s peak spectral analysis ===
(Best model with acceptable fit: N/A)
Model Ph_index Ph_90err_low Ph_90err_hi Epeak Epeak_90err_low Epeak_90err_hi Norm Nomr_90err_low Norm_90err_hi chi2 dof
PL -1.203 -0.344 0.355 - - - 7.82e-03 -1.60e-03 1.59e-03 53.770 57
CPL -0.273 -1.179 2.028 101.588 -39.712 -101.588 2.11e-02 -2.11e-02 1.50e-01 52.560 56
=== Fluence/Peak Flux Summary ===
Model Band1 Band2 Band3 Band4 Band5 Total
15-25 25-50 50-100 100-350 15-150 15-350 keV
Fluence PL 7.17e-09 1.52e-08 2.53e-08 9.60e-08 6.98e-08 1.44e-07 erg/cm2
90%_error_low -1.30e-09 -1.86e-09 -3.39e-09 -2.39e-08 -8.62e-09 -2.70e-08 erg/cm2
90%_error_hi 1.36e-09 1.84e-09 3.36e-09 2.81e-08 8.66e-09 3.04e-08 erg/cm2
Peak flux PL 2.42e-01 2.91e-01 2.53e-01 3.76e-01 9.18e-01 1.16e+00 ph/cm2/s
90%_error_low -8.91e-02 -7.20e-02 -5.80e-02 -1.53e-01 -1.95e-01 -2.42e-01 ph/cm2/s
90%_error_hi 1.02e-01 7.04e-02 5.71e-02 2.08e-01 1.96e-01 2.48e-01 ph/cm2/s
Fluence CPL 5.57e-09 1.74e-08 2.91e-08 2.49e-08 6.71e-08 7.70e-08 erg/cm2
90%_error_low -1.60e-09 -2.36e-09 -4.30e-09 -1.29e-08 -9.13e-09 -1.53e-08 erg/cm2
90%_error_hi 1.65e-09 2.44e-09 4.43e-09 2.79e-08 9.12e-09 2.73e-08 erg/cm2
Peak flux CPL 1.94e-01 3.08e-01 2.77e-01 1.67e-01 8.81e-01 9.46e-01 ph/cm2/s
90%_error_low -1.05e-01 -8.11e-02 -6.93e-02 -1.67e-01 -2.03e-01 -2.48e-01 ph/cm2/s
90%_error_hi 1.23e-01 8.39e-02 7.29e-02 2.78e-01 2.04e-01 3.60e-01 ph/cm2/s
======================================================================
Image
Pre-slew 15.0-350.0 keV image (Event data)

#   RAcent    DECcent   POSerr    Theta     Phi              Peak Cts       SNR   Name
  282.8223   -61.7666   0.0113    24.1001   -22.0078         0.1350164     17.015 TRIG_01017711

Foreground time interval of the image:
  0.000   0.080 (delta_t =   0.080 [sec])
Background time interval of the image:
-239.152   0.000 (delta_t = 239.152 [sec])
Light Curves
Note: The mask-weighted lightcurves have units of either count/det or counts/sec/det, where a det is 0.4 x 0.4 = 0.16 sq cm.
Full-time range; 1 s binning
Other quick-look light curves:
- 64 ms binning (zoomed)
- 16 ms binning (zoomed)
- 8 ms binning (zoomed)
- 2 ms binning (zoomed)
- SN=5 or 10 s binning (full-time range)
- Raw light curve
Spectra
- 64 ms binning (zoomed)
- 16 ms binning (zoomed)
- 8 ms binning (zoomed)
- 2 ms binning (zoomed)
- SN=5 or 10 s binning (full-time range)
- Raw light curve
Spectra
Notes:
- 1) The fitting includes the systematic errors.
- 2) When the burst includes telescope slew time periods, the fitting uses an average response file made from multiple 5-s response files through out the slew time plus single time preiod for the non-slew times, and weighted by the total counts in the corresponding time period using addrmf. An average response file is needed becuase a spectral fit using the pre-slew DRM will introduce some errors in both a spectral shape and a normalization if the PHA file contains a lot of the slew/post-slew time interval.
- 3) For fits to more complicated models (e.g. a power-law over a cutoff power-law), the BAT team has decided to require a chi-square improvement of more than 6 for each extra dof.
Time averaged spectrum fit using the average DRM
Power-law model
Time interval is from    0.000 sec. to    0.080 sec.

Spectral model in power-law:
------------------------------------------------------------
Parameters  : value       lower 90%   higher 90%
Photon index: -1.26431     ( -0.169404   0.168782 )
Norm@50keV  : 8.74924E-02    ( -0.00988405   0.00987933 )
------------------------------------------------------------
#Fit statistic  : Chi-Squared                   94.43     using 59 bins.
 Reduced chi-squared = 1.65667
# Null hypothesis probability of 1.34e-03 with 57 degrees of freedom

Photon flux (15-150 keV)    in 0.08 sec: 0.491529 (    ) ph/cm2/s
Energy fluence (15-150 keV)             : 6.97959e-08 ( -8.61728e-09  8.65536e-09 ) ergs/cm2
Cutoff power-law model
Time interval is from    0.000 sec. to    0.080 sec.
Spectral model in the cutoff power-law:
------------------------------------------------------------
Parameters  : value       lower 90%   higher 90%
Photon index: 0.0623206     ( -0.814938   1.0106 )
Epeak [keV] : 83.4907      ( -16.5429 48.9046 )
Norm@50keV  : 0.380250    ( -0.222277   0.725262 )
------------------------------------------------------------
#Fit statistic  : Chi-Squared                   85.89     using 59 bins.
 Reduced chi-squared = 1.53375
# Null hypothesis probability of 6.26e-03 with 56 degrees of freedom

Photon flux (15-150 keV)    in 0.08 sec: 10.1512 ( -1.20979  1.2042 ) ph/cm2/s
Energy fluence (15-150 keV)             : 6.71166e-08 ( -9.12704e-09  9.12288e-09 ) ergs/cm2
1-s peak spectrum fit
Power-law model
Time interval is from   -0.458 sec. to    0.542 sec.

Spectral model in power-law:
------------------------------------------------------------
Parameters  : value       lower 90%   higher 90%
Photon index: -1.20342     ( -0.343599   0.355231 )
Norm@50keV  : 7.82079E-03    ( -0.00159538   0.00159378 )
------------------------------------------------------------
#Fit statistic  : Chi-Squared                   53.77     using 59 bins.
 Reduced chi-squared = 0.943333
# Null hypothesis probability of 5.97e-01 with 57 degrees of freedom

Photon flux (15-150 keV)    in 1 sec: 0.918453 ( -0.194684  0.196117 ) ph/cm2/s
Energy fluence (15-150 keV)             : 7.92775e-08 ( -1.72663e-08  1.74456e-08 ) ergs/cm2
Cutoff power-law model
Time interval is from   -0.458 sec. to    0.542 sec.
Spectral model in the cutoff power-law:
------------------------------------------------------------
Parameters  : value       lower 90%   higher 90%
Photon index: -0.272751     ( -1.17923   2.02798 )
Epeak [keV] : 101.588      ( -39.7121 -101.588 )
Norm@50keV  : 2.10990E-02    ( -0.021099   0.150115 )
------------------------------------------------------------
#Fit statistic  : Chi-Squared                   52.56     using 59 bins.
 Reduced chi-squared = 0.938571
# Null hypothesis probability of 6.06e-01 with 56 degrees of freedom

Photon flux (15-150 keV)    in 1 sec: 0.881439 ( -0.202689  0.204261 ) ph/cm2/s
Energy fluence (15-150 keV)             : 7.52454e-08 ( -1.89439e-08  1.87681e-08 ) ergs/cm2
Time-resolved spectra
Distribution
T90 vs. Hardness ratio plot
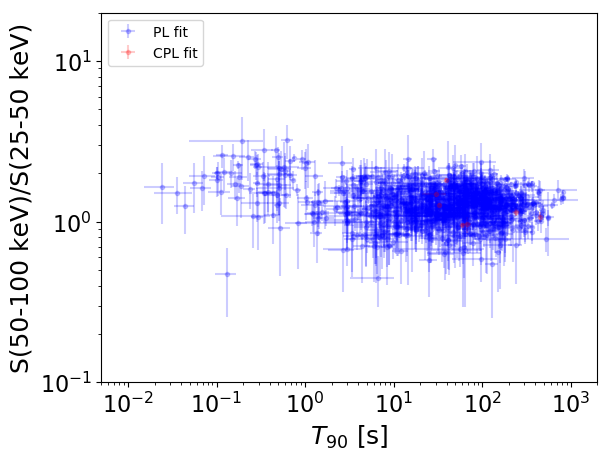
T90                                   = N/A sec.
Hardness ratio (energy fluence ratio) = N/A
S(15-50 keV) vs. S(50-150 keV) plot
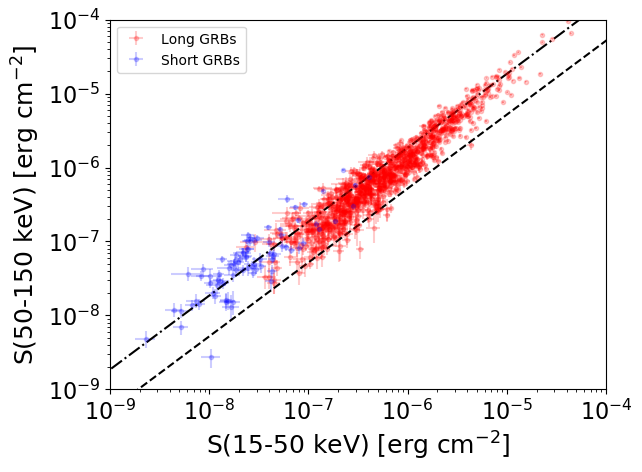
S(15-50 keV)  = N/A
S(50-150 keV) = N/A
The dash-dotted line and the dashed line traces the fluences calculated from the Band function with Epeak = 15 and 150 keV, respectively. Both lines assume a canonical values of alpha = -1 and beta = -2.5.
Mask shadow pattern
IMX = 4.147294229445333E-01, IMY = 1.676269428328477E-01
Spacecraft aspect plot
Bright source in the pre-burst/pre-slew/post-slew images
Pre-burst image of 15-350 keV band
Time interval of the image:
-239.152000 0.000000

# RAcent  DECcent POSerr Theta    Phi  PeakCts   SNR AngSep     Name
#  [deg]    [deg]    ['] [deg]  [deg]                   [']
186.7797 -62.7752    5.1  40.1   54.2  -1.6621  -2.3    3.4	GX 301-2
244.9723 -15.6537    0.6  30.2  179.7   7.6100  18.7    0.9	Sco X-1
256.0039 -37.8623    2.8   7.9 -144.7   1.1670   4.1    1.4	4U 1700-377
256.4138 -36.2726    4.6   9.5 -145.9   0.7342   2.5    9.1	GX 349+2
262.8171 -24.6987    8.6  22.2 -140.3   0.4486   1.3   10.8	GX 1+4
264.5768 -44.5185    6.7   8.7  -76.6   0.5923   1.7    8.2	4U 1735-44
268.1665  -1.3550    0.0  46.0 -143.9  -0.2970  -0.4   13.4	SW J1753.5-0127
270.2191 -25.0379    3.2  24.8 -124.6   1.3762   3.6    4.3	GX 5-1
270.3409 -25.6631    4.6  24.3 -123.6   0.9425   2.5    5.2	GRS 1758-258
273.9742 -13.9404    4.7  36.3 -128.9   1.4175   2.5    6.0	GX 17+2
275.8812 -30.4020   17.4  23.6 -106.9   0.2649   0.7    3.1	H1820-303
285.0536 -24.7631    4.9  33.3 -102.9  -1.3457  -2.4    9.5	HT1900.1-2455
262.7693 -33.7759    7.0  14.0 -127.7  -0.4877  -1.7   11.5	GX 354-0
201.4367 -65.9499    2.1  34.0   48.4   2.9963   5.5 ------	UNKNOWN
279.0162  -3.3377    1.9  48.0 -129.0   8.1121   6.0 ------	UNKNOWN
Pre-slew background subtracted image of 15-350 keV band
Time interval of the image:
0.000000 0.080000

# RAcent  DECcent POSerr Theta    Phi  PeakCts   SNR AngSep     Name
#  [deg]    [deg]    ['] [deg]  [deg]                   [']
186.6567 -62.7760  936.7  40.2   54.2  -0.0002  -0.0    0.3	GX 301-2
244.8967 -15.8068    9.8  30.1  179.5  -0.0104  -1.2   11.1	Sco X-1
256.0164 -37.9847   26.6   7.8 -144.3  -0.0031  -0.4    8.6	4U 1700-377
256.2259 -36.3791    9.6   9.3 -146.6   0.0085   1.2   10.5	GX 349+2
262.7973 -24.6548    0.0  22.3 -140.3   0.0077   1.0   12.8	GX 1+4
264.6229 -44.3252    9.4   8.7  -77.8   0.0093   1.2    9.1	4U 1735-44
268.2861  -1.4938    4.2  45.9 -143.7   0.0452   2.7    5.5	SW J1753.5-0127
270.3383 -25.2112   15.7  24.7 -124.2  -0.0067  -0.7    8.5	GX 5-1
270.1186 -25.6663    4.2  24.2 -124.0   0.0255   2.9   11.0	GRS 1758-258
273.9316 -13.9765    4.6  36.2 -128.9  -0.0305  -2.5    5.6	GX 17+2
276.1592 -30.4187    0.0  23.8 -106.5  -0.0187  -2.1   12.5	H1820-303
285.1902 -24.9443    6.0  33.3 -102.5   0.0282   1.9    8.5	HT1900.1-2455
263.0928 -33.6494    8.9  14.2 -127.0   0.0097   1.3   12.3	GX 354-0
 43.8006 -78.1638    2.4  55.4    7.1   0.1652   4.8 ------	UNKNOWN
282.8224 -61.7666    0.7  24.1  -22.0   0.1350  17.0 ------	UNKNOWN
259.3638 -22.6049    3.2  23.4 -149.6   0.0268   3.6 ------	UNKNOWN
284.2661 -22.9966    2.0  34.1 -106.0   0.0822   5.7 ------	UNKNOWN
Post-slew image of 15-350 keV band
Time interval of the image:
464.048600 925.448590

# RAcent  DECcent POSerr Theta    Phi  PeakCts   SNR AngSep     Name
#  [deg]    [deg]    ['] [deg]  [deg]                   [']
254.5735  35.4634    4.0  15.5   -7.7   1.2685   2.9    9.2	Her X-1
288.7439  10.7662    7.3  38.7  -91.4  -2.7242  -1.6   11.2	GRS 1915+105
299.5719  35.1312    3.9  24.9 -135.6   1.6120   3.0    4.3	Cyg X-1
308.0932  40.9455    1.5  28.0 -154.4   4.0823   7.4    0.9	Cyg X-3
326.2697  38.2922    8.1  41.7 -161.1   1.1730   1.4    4.9	Cyg X-2
290.4387  64.9662    2.5  22.1  142.7   2.3371   4.6 ------	UNKNOWN
252.0286   2.5694    2.5  46.0  -35.7   4.4162   4.7 ------	UNKNOWN
330.6812  20.7009    3.6  55.2 -145.0   8.6550   3.2 ------	UNKNOWN