Analysis Summary
Notes:
- 1) No attempt has been made to eliminate the non-significant decimal places.
- 2) This batgrbproduct analysis is done using the HEASARC data.
- 3) This batgrbproduct analysis is using the flight position for the mask-weighting calculation.
======================================================================
                  BAT GRB EVENT DATA PROCESSING REPORT
    Process Script Ver: batgrbproduct v2.48
    Process Start Time: Sat Jul 30 00:22:09 EDT 2022
             Host Name: batproc1
   Current Working Dir: /local/data/bat1/alien/Swift_3rdBATcatalog/event/batevent_reproc/trigger1030629
======================================================================

  Trigger: 01030629      Segment: 000

  BAT Trigger Time: 634216304.064   [s; MET]
      Trigger Stop: 634216312.256   [s; MET]
               UTC: 2021-02-05T11:11:17.610200    [includes UTCF correction]
       Where From?: TDRSS position message

  BAT
    RA: 347.256750879694   Dec: 56.3124388241946  [deg; J2000]

     Catalogged Source?: NO
     Point Source?:      YES
     GRB Indicated?:     YES    [ by BAT flight software ]
     Image S/N Ratio:    8.16
     Image Trigger?:     NO
     Rate S/N Ratio:     8.94427190999916  [ if not an image trigger ]
     Image S/N Ratio:    8.16

  Analysis Position:   [ source = BAT ]
    RA: 347.256750879694   Dec: 56.3124388241946  [deg; J2000]

  Refined Position:   [ source = BAT pre-slew burst ]
    RA: 347.2638112239   Dec: 56.3110196013137  [deg; J2000]
        { 23h 09m 03.3s , +56d 18' 39.7" }
         +/- 2.11311779797974 [arcmin] (estimated 90% radius based on SNR)
         +/- 0.866313155985623 [arcmin] (formal 1-sigma fit error)
    SNR: 10.4457987490021

  Angular difference between the analysis and refined position is 0.249925 arcmin

  Partial Coding Fraction: 0.1894531    [ including projection effects ]

  Duration
     T90: 22.8639999628067 +/- 4.01399154015578
        Measured from: -3.63999998569489
                   to: 19.2239999771118     [s; relative to TRIGTIME]
     T50: 13.5199999809265 +/- 7.69715159326513
        Measured from: 2.53600001335144
                   to: 16.055999994278     [s; relative to TRIGTIME]


  Fluence
     Peak Flux  (peak 1 second)
        Measured from: 5.98000001907349
                   to: 6.98000001907349     [s; relative to TRIGTIME]
     Total Fluence
        Measured from: -7.35199999809265
                   to: 20.0720000267029     [s; relative to TRIGTIME]

             Band 1     Band 2     Band 3     Band 4
              15-25      25-50     50-100    100-350     keV
 Total     0.670451   0.589113   0.270037   0.032766
           0.082148   0.084123   0.072239   0.060275 [error]
 Peak      0.088336   0.042292   0.028947   0.013725
           0.016885   0.015965   0.014725   0.010886 [error]

     [ fluence units of on-axis counts / fully illuminated detector ]

======================================================================


====== Table of the duration information =============================

        Value   tstart    tstop
T100   27.424   -7.352   20.072
T90    22.864   -3.640   19.224
T50    13.520    2.536   16.056
Peak    1.000    5.980    6.980


====== Spectral Analysis Summary =====================================

Model      : spectral model: simple power-law (PL) and cutoff power-law (CPL)
Ph_index   : photon index: E^{Ph_index}
Ph_90err   : 90% error of the photon index
Epeak      : Epeak in keV
Epeak_90err: 90% error of Epeak
Norm       : normalization at 50 keV in both the PL model and CPL model
Nomr_90err : 90% error of the normalization
chi2       : Chi-Squared
dof        : degree of freedo

=== Time-averaged spectral analysis ===
(Best model with acceptable fit: N/A)

Model Ph_index Ph_90err_low Ph_90err_hi  Epeak  Epeak_90err_low  Epeak_90err_hi  Norm       Nomr_90err_low    Norm_90err_hi    chi2    dof
PL      -2.269    -0.315      0.284       -           -               -         3.44e-03     -7.35e-04          7.11e-04      57.280   57
CPL     -1.659    -0.413      1.825       21.907     -20.739        26.022      8.01e-03     -8.01e-03          9.15e-02      56.520   56


=== 1-s peak spectral analysis ===
(Best model with acceptable fit: N/A)

Model Ph_index Ph_90err_low Ph_90err_hi  Epeak  Epeak_90err_low  Epeak_90err_hi  Norm       Nomr_90err_low    Norm_90err_hi    chi2    dof
PL      -2.668     -1.020     0.724       -           -               -         7.50e-03     -7.50e-03          4.27e-03      48.160   57
CPL     -1.987      1.987     1.987        0.833     338.118        -0.833      1.80e-02     -1.80e-02          -7.18e-03      49.430   56


=== Fluence/Peak Flux Summary ===

              Model    Band1     Band2     Band3     Band4     Band5     Total
                       15-25     25-50    50-100    100-350    15-150    15-350    keV
Fluence         PL   2.49e-07  2.88e-07  2.39e-07  3.33e-07  8.96e-07  1.11e-06   erg/cm2
      90%_error_low -5.03e-08 -4.55e-08 -6.68e-08 -1.51e-07 -1.58e-07 -2.49e-07   erg/cm2
      90%_error_hi   5.17e-08  4.51e-08  6.98e-08  2.16e-07  1.62e-07  2.93e-07   erg/cm2
Peak flux       PL   9.61e-01  4.90e-01  1.54e-01  6.20e-02  1.64e+00  1.67e+00   ph/cm2/s
      90%_error_low -3.77e-01 -1.90e-01 -1.05e-01 -6.20e-02 -4.78e-01 -4.87e-01   ph/cm2/s
      90%_error_hi   3.88e-01  1.64e-01  1.31e-01  1.41e-01  4.78e-01  4.87e-01   ph/cm2/s

Fluence        CPL   2.40e-07  3.10e-07  2.26e-07  1.14e-07  8.47e-07  8.89e-07   erg/cm2
      90%_error_low -5.54e-08 -5.50e-08 -9.59e-08 -1.04e-07 -1.78e-07 -2.17e-07   erg/cm2
      90%_error_hi   5.42e-08  6.57e-08  7.90e-08  3.70e-07  1.85e-07  1.91e-07   erg/cm2
Peak flux      CPL   8.78e-01  4.81e-01  1.66e-01  2.85e-02  1.56e+00  1.59e+00   ph/cm2/s
      90%_error_low -3.79e-01 -1.37e-01 -9.99e-02 -2.85e-02 -4.50e-01 -4.78e-01   ph/cm2/s
      90%_error_hi   3.20e-01  2.04e-01  1.50e-01  2.31e-01  4.88e-01  4.71e-01   ph/cm2/s

======================================================================
Image
Pre-slew 15.0-350.0 keV image (Event data)
#   RAcent    DECcent   POSerr    Theta     Phi              Peak Cts       SNR   Name
  347.2638    56.3110   0.0184    50.5695    11.9346         1.7370308     10.446 TRIG_01030629

Foreground time interval of the image:
 -7.352  20.072 (delta_t =  27.424 [sec])
Background time interval of the image:
-239.064  -7.352 (delta_t = 231.712 [sec])
Light Curves
Note: The mask-weighted lightcurves have units of either count/det or counts/sec/det, where a det is 0.4 x 0.4 = 0.16 sq cm.
Full-time range; 1 s binning
Other quick-look light curves:
- 64 ms binning (zoomed)
- 16 ms binning (zoomed)
- 8 ms binning (zoomed)
- 2 ms binning (zoomed)
- SN=5 or 10 s binning (full-time range)
- Raw light curve
Spectra
- 64 ms binning (zoomed)
- 16 ms binning (zoomed)
- 8 ms binning (zoomed)
- 2 ms binning (zoomed)
- SN=5 or 10 s binning (full-time range)
- Raw light curve
Spectra
Notes:
- 1) The fitting includes the systematic errors.
- 2) When the burst includes telescope slew time periods, the fitting uses an average response file made from multiple 5-s response files through out the slew time plus single time preiod for the non-slew times, and weighted by the total counts in the corresponding time period using addrmf. An average response file is needed becuase a spectral fit using the pre-slew DRM will introduce some errors in both a spectral shape and a normalization if the PHA file contains a lot of the slew/post-slew time interval.
- 3) For fits to more complicated models (e.g. a power-law over a cutoff power-law), the BAT team has decided to require a chi-square improvement of more than 6 for each extra dof.
Time averaged spectrum fit using the average DRM
Power-law model

Time interval is from   -7.352 sec. to   20.072 sec.

Spectral model in power-law:
------------------------------------------------------------
Parameters  : value       lower 90%   higher 90%
Photon index: -2.26915     ( -0.314909   0.284079 )
Norm@50keV  : 3.43630E-03    ( -0.000735161   0.000710683 )
------------------------------------------------------------
#Fit statistic  : Chi-Squared                   57.28     using 59 bins.
 Reduced chi-squared = 1.00491
# Null hypothesis probability of 4.65e-01 with 57 degrees of freedom

Photon flux (15-150 keV)    in 27.42 sec: 0.590454 ( -0.090553  0.090604 ) ph/cm2/s
Energy fluence (15-150 keV)             : 8.95691e-07 ( -1.58453e-07  1.62289e-07 ) ergs/cm2
Cutoff power-law model

Time interval is from   -7.352 sec. to   20.072 sec.
Spectral model in the cutoff power-law:
------------------------------------------------------------
Parameters  : value       lower 90%   higher 90%
Photon index: -1.65939     ( -0.416508   1.82124 )
Epeak [keV] : 21.9071      ( -20.8685 25.892 )
Norm@50keV  : 8.00910E-03    ( -0.00807496   0.0914456 )
------------------------------------------------------------
#Fit statistic  : Chi-Squared                   56.52     using 59 bins.
 Reduced chi-squared = 1.00929
# Null hypothesis probability of 4.56e-01 with 56 degrees of freedom

Photon flux (15-150 keV)    in 27.42 sec: 0.580085 ( -0.093078  0.09179 ) ph/cm2/s
Energy fluence (15-150 keV)             : 8.47495e-07 ( -1.77583e-07  1.84666e-07 ) ergs/cm2
1-s peak spectrum fit
Power-law model

Time interval is from    5.980 sec. to    6.980 sec.

Spectral model in power-law:
------------------------------------------------------------
Parameters  : value       lower 90%   higher 90%
Photon index: -2.66793     ( -1.01932   0.723775 )
Norm@50keV  : 7.50102E-03    ( -0.00749982   0.00427064 )
------------------------------------------------------------
#Fit statistic  : Chi-Squared                   48.16     using 59 bins.
 Reduced chi-squared = 0.844912
# Null hypothesis probability of 7.91e-01 with 57 degrees of freedom

Photon flux (15-150 keV)    in 1 sec: 1.63938 ( -0.47774  0.47773 ) ph/cm2/s
Energy fluence (15-150 keV)             : 7.89369e-08 ( -2.88805e-08  3.15345e-08 ) ergs/cm2
Cutoff power-law model
Time interval is from    5.980 sec. to    6.980 sec.
Spectral model in the cutoff power-law:
------------------------------------------------------------
Parameters  : value       lower 90%   higher 90%
Photon index: -3.48351     ( 1.98684   1.98684 )
Epeak [keV] : 423.237      ( -84.6338 -423.585 )
Norm@50keV  : 3.06392E-03    ( -0.00305677   0.00778313 )
------------------------------------------------------------
#Fit statistic  : Chi-Squared                   47.11     using 59 bins.
 Reduced chi-squared = 0.84125
# Null hypothesis probability of 7.95e-01 with 56 degrees of freedom

Photon flux (15-150 keV)    in 1 sec: 1.55684 ( -0.45014  0.48789 ) ph/cm2/s
Energy fluence (15-150 keV)             : 7.67432e-08 ( -3.03846e-08  3.86048e-08 ) ergs/cm2
Time-resolved spectra

Distribution
T90 vs. Hardness ratio plot
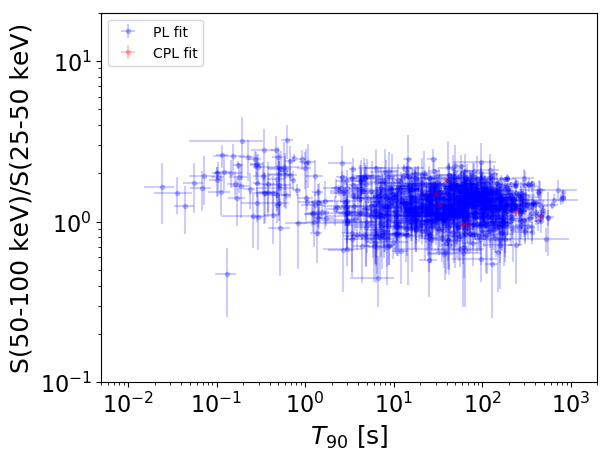
T90                                   = N/A sec.
Hardness ratio (energy fluence ratio) = N/A
S(15-50 keV) vs. S(50-150 keV) plot

S(15-50 keV)  = N/A
S(50-150 keV) = N/A
The dash-dotted line and the dashed line traces the fluences calculated from the Band function with Epeak = 15 and 150 keV, respectively. Both lines assume a canonical values of alpha = -1 and beta = -2.5.
Mask shadow pattern

IMX = 1.189812489887883E+00, IMY = -2.514844059724752E-01
Spacecraft aspect plot

Bright source in the pre-burst/pre-slew/post-slew images
Pre-burst image of 15-350 keV band
Time interval of the image:
-239.064000 -7.352000

# RAcent  DECcent POSerr Theta    Phi  PeakCts   SNR AngSep     Name
#  [deg]    [deg]    ['] [deg]  [deg]                   [']
326.2159  38.4322    5.6  51.1  -17.4   1.3027   2.1    7.0	Cyg X-2
 46.8289 -22.1429    3.1  45.7  166.1   1.8752   3.7 ------	UNKNOWN
 23.5845 -42.8159    2.7  53.7 -158.0   2.6278   4.2 ------	UNKNOWN
352.6263 -14.8600    4.4  32.8 -108.8   0.9617   2.7 ------	UNKNOWN
Pre-slew background subtracted image of 15-350 keV band
Time interval of the image:
-7.352000 20.072000

# RAcent  DECcent POSerr Theta    Phi  PeakCts   SNR AngSep     Name
#  [deg]    [deg]    ['] [deg]  [deg]                   [']
326.1741  38.1711    5.3  51.0  -17.8  -0.3396  -2.2    9.0	Cyg X-2
347.2638  56.3110    1.1  50.6   11.9   1.7367  10.4 ------	UNKNOWN
335.9952  45.0463    2.3  47.7   -5.3   0.5783   5.1 ------	UNKNOWN
Post-slew image of 15-350 keV band
Time interval of the image:
118.636600 356.436610

# RAcent  DECcent POSerr Theta    Phi  PeakCts   SNR AngSep     Name
#  [deg]    [deg]    ['] [deg]  [deg]                   [']
299.5903  35.2017   43.5  38.3  -40.4  -0.0937  -0.3    0.0	Cyg X-1
308.1138  40.9524    1.5  29.5  -42.1   2.2568   7.9    0.2	Cyg X-3
326.0516  38.2544    3.7  22.9  -70.6   0.8323   3.1    6.9	Cyg X-2
 81.0489  68.5524    2.9  40.5   96.7   3.3705   4.0 ------	UNKNOWN
194.3999  81.3428    3.2  41.6   56.6   2.4743   3.5 ------	UNKNOWN
243.1290  53.1864    4.2  54.2   16.7   3.2936   2.8 ------	UNKNOWN
247.1950  48.6515    4.2  55.9   10.7   4.1130   2.8 ------	UNKNOWN
297.7174  23.2127    2.1  48.8  -49.2   5.4047   5.3 ------	UNKNOWN
307.2464  22.1154    2.7  45.0  -60.2   3.8885   4.2 ------	UNKNOWN