Analysis Summary
Notes:
- 1) No attempt has been made to eliminate the non-significant decimal places.
- 2) This batgrbproduct analysis is done using the HEASARC data.
- 3) This batgrbproduct analysis is using the flight position for the mask-weighting calculation.
======================================================================
                  BAT GRB EVENT DATA PROCESSING REPORT
    Process Script Ver: batgrbproduct v2.48
    Process Start Time: Sat Jul 30 00:19:50 EDT 2022
             Host Name: batproc1
   Current Working Dir: /local/data/bat1/alien/Swift_3rdBATcatalog/event/batevent_reproc/trigger1031297
======================================================================

  Trigger: 01031297      Segment: 000

  BAT Trigger Time: 634427554.624   [s; MET]
      Trigger Stop: 634427555.136   [s; MET]
               UTC: 2021-02-07T21:52:08.156240    [includes UTCF correction]
       Where From?: TDRSS position message

  BAT
    RA: 270.582286117508   Dec: 53.6941953675612  [deg; J2000]

     Catalogged Source?: NO
     Point Source?:      YES
     GRB Indicated?:     YES    [ by BAT flight software ]
     Image S/N Ratio:    9.59
     Image Trigger?:     NO
     Rate S/N Ratio:     17.7482393492988  [ if not an image trigger ]
     Image S/N Ratio:    9.59

  Analysis Position:   [ source = BAT ]
    RA: 270.582286117508   Dec: 53.6941953675612  [deg; J2000]

  Refined Position:   [ source = BAT pre-slew burst ]
    RA: 270.612644878121   Dec: 53.6990618162027  [deg; J2000]
        { 18h 02m 27.0s , +53d 41' 56.6" }
         +/- 1.40704627313108 [arcmin] (estimated 90% radius based on SNR)
         +/- 0.565524837684244 [arcmin] (formal 1-sigma fit error)
    SNR: 18.6745121601408

  Angular difference between the analysis and refined position is 1.117282 arcmin

  Partial Coding Fraction: 0.5625    [ including projection effects ]

  Duration
     T90: 92.5279998779297 +/- 4.53908947475572
        Measured from: 1.94800007343292
                   to: 94.4759999513626     [s; relative to TRIGTIME]
     T50: 34.2840000391006 +/- 6.5551250319218
        Measured from: 18.472000002861
                   to: 52.7560000419617     [s; relative to TRIGTIME]


  Fluence
     Peak Flux  (peak 1 second)
        Measured from: 43.1560000181198
                   to: 44.1560000181198     [s; relative to TRIGTIME]
     Total Fluence
        Measured from: -0.179999947547913
                   to: 106.404000043869     [s; relative to TRIGTIME]

             Band 1     Band 2     Band 3     Band 4
              15-25      25-50     50-100    100-350     keV
 Total     1.361071   2.071496   1.986869   0.727867
           0.071579   0.074453   0.067065   0.059467 [error]
 Peak      0.059426   0.130538   0.156598   0.068086
           0.007318   0.008720   0.009174   0.008354 [error]

     [ fluence units of on-axis counts / fully illuminated detector ]

======================================================================


====== Table of the duration information =============================

        Value   tstart    tstop
T100  106.584   -0.180  106.404
T90    92.528    1.948   94.476
T50    34.284   18.472   52.756
Peak    1.000   43.156   44.156


====== Spectral Analysis Summary =====================================

Model      : spectral model: simple power-law (PL) and cutoff power-law (CPL)
Ph_index   : photon index: E^{Ph_index}
Ph_90err   : 90% error of the photon index
Epeak      : Epeak in keV
Epeak_90err: 90% error of Epeak
Norm       : normalization at 50 keV in both the PL model and CPL model
Nomr_90err : 90% error of the normalization
chi2       : Chi-Squared
dof        : degree of freedo

=== Time-averaged spectral analysis ===
(Best model with acceptable fit: N/A)

Model Ph_index Ph_90err_low Ph_90err_hi  Epeak  Epeak_90err_low  Epeak_90err_hi  Norm       Nomr_90err_low    Norm_90err_hi    chi2    dof
PL      -1.151    -0.072      0.072       -           -               -         3.83e-03     -1.44e-04          1.44e-04      53.770   57
CPL     -1.099    -0.120      0.084      994.755    -994.755      -994.755      4.04e-03     -3.31e-04          3.94e-04      54.620   56


=== 1-s peak spectral analysis ===
(Best model with acceptable fit: N/A)

Model Ph_index Ph_90err_low Ph_90err_hi  Epeak  Epeak_90err_low  Epeak_90err_hi  Norm       Nomr_90err_low    Norm_90err_hi    chi2    dof
PL      -0.731     -0.126     0.129       -           -               -         2.58e-02     -1.78e-03          1.77e-03      62.140   57
CPL     -0.724     -0.126     0.231     9998.790    -9998.790      -9998.790      2.60e-02     -1.77e-03          1.14e-02      62.160   56


=== Fluence/Peak Flux Summary ===

              Model    Band1     Band2     Band3     Band4     Band5     Total
                       15-25     25-50    50-100    100-350    15-150    15-350    keV
Fluence         PL   3.76e-07  8.56e-07  1.54e-06  6.57e-06  4.20e-06  9.35e-06   erg/cm2
      90%_error_low -3.03e-08 -4.02e-08 -6.60e-08 -6.55e-07 -1.68e-07 -6.86e-07   erg/cm2
      90%_error_hi   3.13e-08  4.00e-08  6.57e-08  7.08e-07  1.69e-07  7.31e-07   erg/cm2
Peak flux       PL   5.11e-01  8.16e-01  9.83e-01  2.32e+00  2.98e+00  4.63e+00   ph/cm2/s
      90%_error_low -7.61e-02 -7.43e-02 -7.04e-02 -3.64e-01 -2.00e-01 -3.90e-01   ph/cm2/s
      90%_error_hi   8.07e-02  7.34e-02  6.99e-02  4.10e-01  2.00e-01  4.13e-01   ph/cm2/s

Fluence        CPL   3.76e-07  8.54e-07  1.52e-06  6.84e-06  4.23e-06  9.27e-06   erg/cm2
      90%_error_low    N/A    -5.51e-08    N/A    -1.53e-06 -2.04e-07 -1.18e-06   erg/cm2
      90%_error_hi     N/A     5.89e-08    N/A     3.47e-09  1.33e-07  4.95e-07   erg/cm2
Peak flux      CPL   5.10e-01  8.16e-01  9.79e-01  2.49e+00  2.98e+00  4.77e+00   ph/cm2/s
      90%_error_low     N/A   -7.78e-02 -7.00e-02     N/A       N/A   -9.51e-01   ph/cm2/s
      90%_error_hi      N/A    7.83e-02  8.12e-02     N/A       N/A    2.23e-01   ph/cm2/s

======================================================================
Image
Pre-slew 15.0-350.0 keV image (Event data)
#   RAcent    DECcent   POSerr    Theta     Phi              Peak Cts       SNR   Name
  270.6126    53.6991   0.0102    32.9356    17.1308         1.0418809     18.675 TRIG_01031297

Foreground time interval of the image:
 -0.180   9.877 (delta_t =  10.057 [sec])
Background time interval of the image:
-172.323  -0.180 (delta_t = 172.143 [sec])
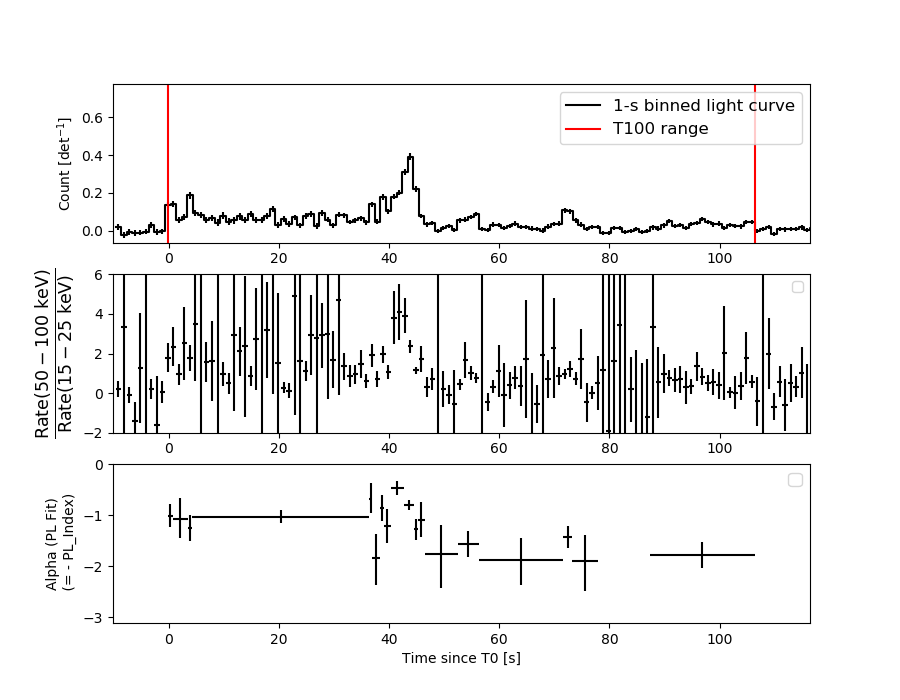
Light Curves
Note: The mask-weighted lightcurves have units of either count/det or counts/sec/det, where a det is 0.4 x 0.4 = 0.16 sq cm.
Full-time range; 1 s binning
Other quick-look light curves:
- 64 ms binning (zoomed)
- 16 ms binning (zoomed)
- 8 ms binning (zoomed)
- 2 ms binning (zoomed)
- SN=5 or 10 s binning (full-time range)
- Raw light curve
Spectra
- 64 ms binning (zoomed)
- 16 ms binning (zoomed)
- 8 ms binning (zoomed)
- 2 ms binning (zoomed)
- SN=5 or 10 s binning (full-time range)
- Raw light curve
Spectra
Notes:
- 1) The fitting includes the systematic errors.
- 2) When the burst includes telescope slew time periods, the fitting uses an average response file made from multiple 5-s response files through out the slew time plus single time preiod for the non-slew times, and weighted by the total counts in the corresponding time period using addrmf. An average response file is needed becuase a spectral fit using the pre-slew DRM will introduce some errors in both a spectral shape and a normalization if the PHA file contains a lot of the slew/post-slew time interval.
- 3) For fits to more complicated models (e.g. a power-law over a cutoff power-law), the BAT team has decided to require a chi-square improvement of more than 6 for each extra dof.
Time averaged spectrum fit using the average DRM
Power-law model
Time interval is from   -0.180 sec. to  106.404 sec.

Spectral model in power-law:
------------------------------------------------------------
Parameters  : value       lower 90%   higher 90%
Photon index: -1.15137     ( -0.0717559   0.0723534 )
Norm@50keV  : 3.82737E-03    ( -0.00014398   0.000143704 )
------------------------------------------------------------
#Fit statistic  : Chi-Squared                   53.77     using 59 bins.
 Reduced chi-squared = 0.943333
# Null hypothesis probability of 5.97e-01 with 57 degrees of freedom

Photon flux (15-150 keV)    in 106.6 sec: 0.446423 ( -0.017757  0.017845 ) ph/cm2/s
Energy fluence (15-150 keV)             : 4.19882e-06 ( -1.68433e-07  1.68919e-07 ) ergs/cm2
Cutoff power-law model

Time interval is from   -0.180 sec. to  106.404 sec.
Spectral model in the cutoff power-law:
------------------------------------------------------------
Parameters  : value       lower 90%   higher 90%
Photon index: -1.14996     ( -0.069541   0.134024 )
Epeak [keV] : 9999.36      ( -9999.36 -9999.36 )
Norm@50keV  : 3.83356E-03    ( -0.000143509   0.000581442 )
------------------------------------------------------------
#Fit statistic  : Chi-Squared                   53.87     using 59 bins.
 Reduced chi-squared = 0.961964
# Null hypothesis probability of 5.56e-01 with 56 degrees of freedom

Photon flux (15-150 keV)    in 106.6 sec: 0.446291 ( -0.017781  0.017822 ) ph/cm2/s
Energy fluence (15-150 keV)             : 4.2327e-06 ( -2.03888e-07  1.33333e-07 ) ergs/cm2
1-s peak spectrum fit
Power-law model
Time interval is from   43.156 sec. to   44.156 sec.

Spectral model in power-law:
------------------------------------------------------------
Parameters  : value       lower 90%   higher 90%
Photon index: -0.731095     ( -0.125566   0.128652 )
Norm@50keV  : 2.58130E-02    ( -0.00178501   0.00177421 )
------------------------------------------------------------
#Fit statistic  : Chi-Squared                   62.14     using 59 bins.
 Reduced chi-squared = 1.09018
# Null hypothesis probability of 2.98e-01 with 57 degrees of freedom

Photon flux (15-150 keV)    in 1 sec: 2.97702 ( -0.19973  0.19989 ) ph/cm2/s
Energy fluence (15-150 keV)             : 3.10771e-07 ( -2.34946e-08  2.3655e-08 ) ergs/cm2
Cutoff power-law model

Time interval is from   43.156 sec. to   44.156 sec.
Spectral model in the cutoff power-law:
------------------------------------------------------------
Parameters  : value       lower 90%   higher 90%
Photon index: -0.724203     ( -0.125792   0.230774 )
Epeak [keV] : 9998.79      ( -9998.96 -9998.96 )
Norm@50keV  : 2.60102E-02    ( -0.00177119   0.0114368 )
------------------------------------------------------------
#Fit statistic  : Chi-Squared                   62.16     using 59 bins.
 Reduced chi-squared = 1.11
# Null hypothesis probability of 2.66e-01 with 56 degrees of freedom

Photon flux (15-150 keV)    in 1 sec: 2.98167 (    ) ph/cm2/s
Energy fluence (15-150 keV)             : 3.12047e-07 ( 0  0 ) ergs/cm2
Time-resolved spectra
Distribution
T90 vs. Hardness ratio plot
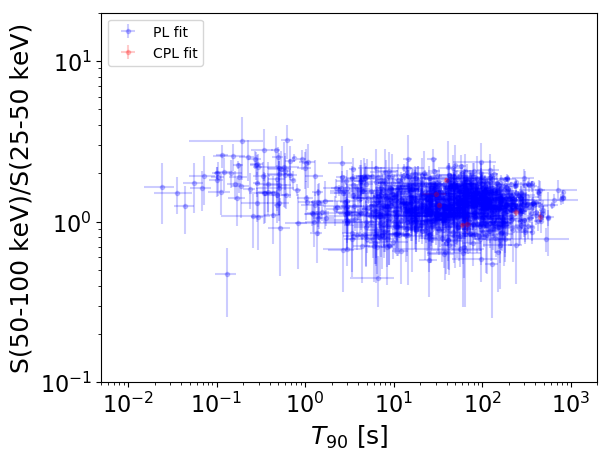
T90                                   = N/A sec.
Hardness ratio (energy fluence ratio) = N/A
S(15-50 keV) vs. S(50-150 keV) plot
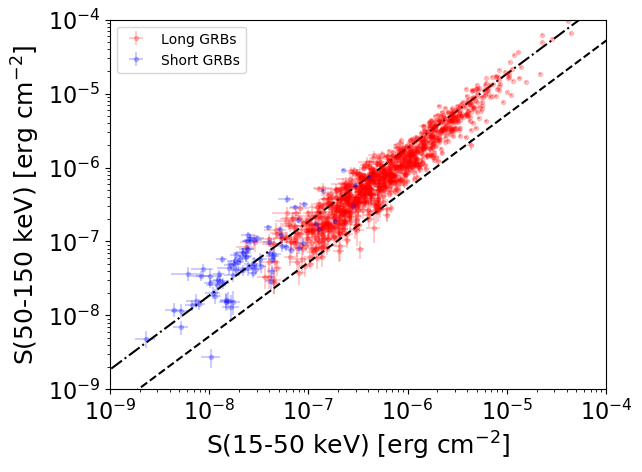
S(15-50 keV)  = N/A
S(50-150 keV) = N/A
The dash-dotted line and the dashed line traces the fluences calculated from the Band function with Epeak = 15 and 150 keV, respectively. Both lines assume a canonical values of alpha = -1 and beta = -2.5.
Mask shadow pattern
IMX = 6.190710664771016E-01, IMY = -1.908159232915664E-01
Spacecraft aspect plot
Bright source in the pre-burst/pre-slew/post-slew images
Pre-burst image of 15-350 keV band
Time interval of the image:
-172.323410 -0.180000

# RAcent  DECcent POSerr Theta    Phi  PeakCts   SNR AngSep     Name
#  [deg]    [deg]    ['] [deg]  [deg]                   [']
254.4860  35.2162    5.3  53.2    5.5   1.3532   2.2    7.7	Her X-1
299.5344  35.2546    3.2  28.1  -37.6   0.8248   3.6    4.2	Cyg X-1
308.0770  40.9573    1.8  19.5  -42.4   1.2415   6.4    1.5	Cyg X-3
326.3194  38.3500    4.8  16.6  -88.7   0.5140   2.4    7.2	Cyg X-2
258.9029  24.7013    3.4  58.5   -6.4   4.2918   3.4 ------	UNKNOWN
Pre-slew background subtracted image of 15-350 keV band
Time interval of the image:
-0.180000 9.876590

# RAcent  DECcent POSerr Theta    Phi  PeakCts   SNR AngSep     Name
#  [deg]    [deg]    ['] [deg]  [deg]                   [']
254.4656  35.2288   10.2  53.2    5.5   0.1499   1.1    6.8	Her X-1
299.4507  35.0931    6.7  28.3  -37.7   0.0761   1.7    9.4	Cyg X-1
308.3064  40.9579    8.0  19.4  -42.8  -0.0600  -1.4    8.9	Cyg X-3
326.3618  38.4064  107.3  16.6  -88.8  -0.0047  -0.1   10.3	Cyg X-2
270.6126  53.6990    0.6  32.9   17.1   1.0420  18.7 ------	UNKNOWN
Post-slew image of 15-350 keV band
Time interval of the image:
63.076610 409.576610

# RAcent  DECcent POSerr Theta    Phi  PeakCts   SNR AngSep     Name
#  [deg]    [deg]    ['] [deg]  [deg]                   [']
254.4598  35.3651    2.7  21.5   -2.1   1.5494   4.2    1.4	Her X-1
299.5407  35.3510   15.2  27.3  -99.8   0.3615   0.8    9.3	Cyg X-1
307.9794  40.9762    2.6  27.9 -118.6   1.9086   4.4    6.1	Cyg X-3
326.2394  38.3853    3.0  40.3 -131.3   2.2807   3.9    5.0	Cyg X-2
222.4621  27.3666    3.3  43.8   32.5   2.2948   3.5 ------	UNKNOWN
270.6546  53.6353    2.4   0.0  -83.9   1.4908   4.8 ------	UNKNOWN