Analysis Summary
Notes:
- 1) No attempt has been made to eliminate the non-significant decimal places.
- 2) This batgrbproduct analysis is done using the HEASARC data.
- 3) This batgrbproduct analysis is using the flight position for the mask-weighting calculation.
======================================================================
BAT GRB EVENT DATA PROCESSING REPORT
Process Script Ver: batgrbproduct v2.48
Process Start Time: Sun Nov 13 11:41:13 EST 2022
Host Name: batproc1
Current Working Dir: /local/data/bat1/alien/Swift_3rdBATcatalog/event/batevent_reproc/trigger1031636
======================================================================
Trigger: 01031636 Segment: 000
BAT Trigger Time: 634599611.008 [s; MET]
Trigger Stop: 634599623.168 [s; MET]
UTC: 2021-02-09T21:39:44.528860 [includes UTCF correction]
Where From?: TDRSS position message
BAT
RA: 328.09639350866 Dec: 43.5587284402821 [deg; J2000]
Catalogged Source?: NO
Point Source?: YES
GRB Indicated?: YES [ by BAT flight software ]
Image S/N Ratio: 10.25
Image Trigger?: NO
Rate S/N Ratio: 10.816653826392 [ if not an image trigger ]
Image S/N Ratio: 10.25
Analysis Position: [ source = BAT ]
RA: 328.09639350866 Dec: 43.5587284402821 [deg; J2000]
Refined Position: [ source = BAT pre-slew burst ]
RA: 328.096909876726 Dec: 43.5445563657356 [deg; J2000]
{ 21h 52m 23.3s , +43d 32' 40.4" }
+/- 1.55216785536005 [arcmin] (estimated 90% radius based on SNR)
+/- 0.603615658455308 [arcmin] (formal 1-sigma fit error)
SNR: 16.2311327503271
Angular difference between the analysis and refined position is 0.850621 arcmin
Partial Coding Fraction: 0.96875 [ including projection effects ]
Duration
T90: 139.407999992371 +/- 21.5133887433406
Measured from: -24.1240000724792
to: 115.283999919891 [s; relative to TRIGTIME]
T50: 70 +/- 6.48419902027476
Measured from: 4.10399997234344
to: 74.1039999723434 [s; relative to TRIGTIME]
Fluence
Peak Flux (peak 1 second)
Measured from: 2.68400001525879
to: 3.68400001525879 [s; relative to TRIGTIME]
Total Fluence
Measured from: -40.3359999656677
to: 134.715999960899 [s; relative to TRIGTIME]
Band 1 Band 2 Band 3 Band 4
15-25 25-50 50-100 100-350 keV
Total 1.048811 1.469605 1.083165 0.299598
0.081799 0.083668 0.074208 0.067354 [error]
Peak 0.022781 0.021681 0.019738 0.010527
0.006252 0.006594 0.005778 0.005399 [error]
[ fluence units of on-axis counts / fully illuminated detector ]
======================================================================
====== Table of the duration information =============================
Value tstart tstop
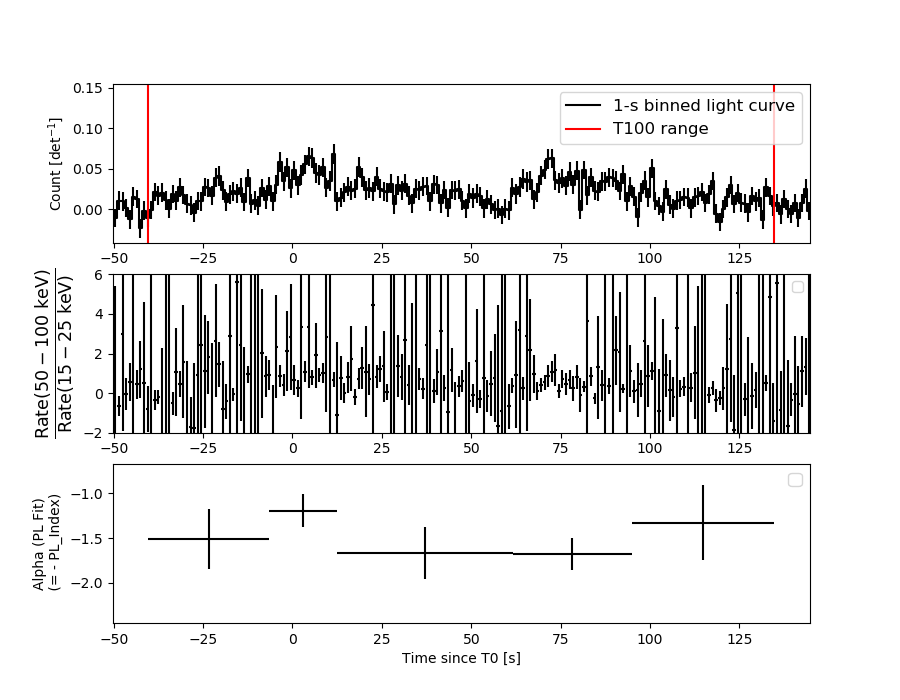
T100 175.052 -40.336 134.716
T90 139.408 -24.124 115.284
T50 70.000 4.104 74.104
Peak 1.000 2.684 3.684
====== Spectral Analysis Summary =====================================
Model : spectral model: simple power-law (PL) and cutoff power-law (CPL)
Ph_index : photon index: E^{Ph_index}
Ph_90err : 90% error of the photon index
Epeak : Epeak in keV
Epeak_90err: 90% error of Epeak
Norm : normalization at 50 keV in both the PL model and CPL model
Nomr_90err : 90% error of the normalization
chi2 : Chi-Squared
dof : degree of freedo
=== Time-averaged spectral analysis ===
(Best model with acceptable fit: N/A)
Model Ph_index Ph_90err_low Ph_90err_hi Epeak Epeak_90err_low Epeak_90err_hi Norm Nomr_90err_low Norm_90err_hi chi2 dof
PL -1.512 -0.123 0.122 - - - 1.42e-03 -9.57e-05 9.52e-05 51.470 57
CPL -1.513 -0.121 0.144 9999.340 -9999.340 -9999.340 1.42e-03 -9.26e-05 5.64e-04 51.480 56
=== 1-s peak spectral analysis ===
(Best model with acceptable fit: N/A)
Model Ph_index Ph_90err_low Ph_90err_hi Epeak Epeak_90err_low Epeak_90err_hi Norm Nomr_90err_low Norm_90err_hi chi2 dof
PL -1.415 -0.581 0.569 - - - 4.82e-03 -1.34e-03 1.26e-03 50.120 57
CPL -1.438 -6.633 -1.064 9999.360 -9357.780 -9153.287 4.82e-03 -4.82e-03 -3.33e-03 50.140 56
=== Fluence/Peak Flux Summary ===
Model Band1 Band2 Band3 Band4 Band5 Total
15-25 25-50 50-100 100-350 15-150 15-350 keV
Fluence PL 3.21e-07 5.86e-07 8.22e-07 2.41e-06 2.35e-06 4.14e-06 erg/cm2
90%_error_low -3.66e-08 -4.00e-08 -7.42e-08 -4.46e-07 -1.75e-07 -5.06e-07 erg/cm2
90%_error_hi 3.78e-08 3.98e-08 7.41e-08 5.14e-07 1.77e-07 5.62e-07 erg/cm2
Peak flux PL 1.83e-01 1.94e-01 1.45e-01 1.77e-01 5.90e-01 6.99e-01 ph/cm2/s
90%_error_low -8.71e-02 -5.76e-02 -5.44e-02 -1.09e-01 -1.53e-01 -1.86e-01 ph/cm2/s
90%_error_hi 9.94e-02 5.34e-02 5.04e-02 1.90e-01 1.53e-01 1.95e-01 ph/cm2/s
Fluence CPL 3.24e-07 5.82e-07 8.17e-07 2.53e-06 2.38e-06 4.03e-06 erg/cm2
90%_error_low -4.63e-08 -4.39e-08 -6.94e-08 -1.05e-06 -2.06e-07 -8.64e-07 erg/cm2
90%_error_hi 4.08e-08 7.71e-08 7.91e-08 1.36e-07 1.45e-07 6.58e-07 erg/cm2
Peak flux CPL 1.50e-01 8.10e-03 1.47e-04 3.12e-06 1.60e-01 1.61e-01 ph/cm2/s
90%_error_low -9.86e-02 -8.10e-03 -1.47e-04 -3.12e-06 -1.11e-01 -1.26e-01 ph/cm2/s
90%_error_hi 1.15e-01 9.73e-02 3.85e-02 2.39e-02 1.90e-01 1.84e-01 ph/cm2/s
======================================================================
Image
Pre-slew 15.0-350.0 keV image (Event data)
#   RAcent    DECcent   POSerr    Theta     Phi              Peak Cts       SNR   Name
  328.0969    43.5446   0.0119    21.5099   -11.1749         2.2510730     16.231 TRIG_01031636

Foreground time interval of the image:
-40.336  57.293 (delta_t =  97.629 [sec])
Background time interval of the image:
-239.008 -40.336 (delta_t = 198.672 [sec])
Light Curves
Note: The mask-weighted lightcurves have units of either count/det or counts/sec/det, where a det is 0.4 x 0.4 = 0.16 sq cm.
Full-time range; 1 s binning
Other quick-look light curves:
- 64 ms binning (zoomed)
- 16 ms binning (zoomed)
- 8 ms binning (zoomed)
- 2 ms binning (zoomed)
- SN=5 or 10 s binning (full-time range)
- Raw light curve
Spectra
- 64 ms binning (zoomed)
- 16 ms binning (zoomed)
- 8 ms binning (zoomed)
- 2 ms binning (zoomed)
- SN=5 or 10 s binning (full-time range)
- Raw light curve
Spectra
Notes:
- 1) The fitting includes the systematic errors.
- 2) When the burst includes telescope slew time periods, the fitting uses an average response file made from multiple 5-s response files through out the slew time plus single time preiod for the non-slew times, and weighted by the total counts in the corresponding time period using addrmf. An average response file is needed becuase a spectral fit using the pre-slew DRM will introduce some errors in both a spectral shape and a normalization if the PHA file contains a lot of the slew/post-slew time interval.
- 3) For fits to more complicated models (e.g. a power-law over a cutoff power-law), the BAT team has decided to require a chi-square improvement of more than 6 for each extra dof.
Time averaged spectrum fit using the average DRM
Power-law model
Time interval is from  -40.336 sec. to  134.716 sec.

Spectral model in power-law:
------------------------------------------------------------
Parameters  : value       lower 90%   higher 90%
Photon index: -1.51184     ( -0.12302   0.122282 )
Norm@50keV  : 1.42022E-03    ( -9.56811e-05   9.51783e-05 )
------------------------------------------------------------
#Fit statistic  : Chi-Squared                   51.47     using 59 bins.
 Reduced chi-squared = 0.902982
# Null hypothesis probability of 6.82e-01 with 57 degrees of freedom

Photon flux (15-150 keV)    in 175.1 sec: 0.177875 ( -0.0118  0.011821 ) ph/cm2/s
Energy fluence (15-150 keV)             : 2.35492e-06 ( -1.75273e-07  1.76919e-07 ) ergs/cm2
Cutoff power-law model
Time interval is from  -40.336 sec. to  134.716 sec.
Spectral model in the cutoff power-law:
------------------------------------------------------------
Parameters  : value       lower 90%   higher 90%
Photon index: -1.51258     ( -0.120929   0.143437 )
Epeak [keV] : 9999.34      ( -9999.36 -9999.36 )
Norm@50keV  : 1.42175E-03    ( -9.45419e-05   0.000562465 )
------------------------------------------------------------
#Fit statistic  : Chi-Squared                   51.48     using 59 bins.
 Reduced chi-squared = 0.919286
# Null hypothesis probability of 6.46e-01 with 56 degrees of freedom

Photon flux (15-150 keV)    in 175.1 sec: 0.178598 (    ) ph/cm2/s
Energy fluence (15-150 keV)             : 2.3829e-06 ( -2.05562e-07  1.45443e-07 ) ergs/cm2
1-s peak spectrum fit
Power-law model
Time interval is from    2.684 sec. to    3.684 sec.

Spectral model in power-law:
------------------------------------------------------------
Parameters  : value       lower 90%   higher 90%
Photon index: -1.41541     ( -0.581881   0.568426 )
Norm@50keV  : 4.82449E-03    ( -0.0013358   0.00126298 )
------------------------------------------------------------
#Fit statistic  : Chi-Squared                   50.12     using 59 bins.
 Reduced chi-squared = 0.879298
# Null hypothesis probability of 7.29e-01 with 57 degrees of freedom

Photon flux (15-150 keV)    in 1 sec: 0.589598 ( -0.152693  0.152804 ) ph/cm2/s
Energy fluence (15-150 keV)             : 4.64879e-08 ( -1.43557e-08  1.46879e-08 ) ergs/cm2
Cutoff power-law model
Time interval is from    2.684 sec. to    3.684 sec.
Spectral model in the cutoff power-law:
------------------------------------------------------------
Parameters  : value       lower 90%   higher 90%
Photon index: -6.72769     ( -1.33178   4.23791 )
Epeak [keV] : 707.136      ( -66.8945 137.599 )
Norm@50keV  : 1.65726E-05    ( -1.59042e-05   0.00147647 )
------------------------------------------------------------
#Fit statistic  : Chi-Squared                   45.09     using 59 bins.
 Reduced chi-squared = 0.805179
# Null hypothesis probability of 8.52e-01 with 56 degrees of freedom

Photon flux (15-150 keV)    in 1 sec: 0.159947 ( -0.110981  0.190297 ) ph/cm2/s
Energy fluence (15-150 keV)             : 2.07783e-08 ( -1.93519e-08  -2.8479e-09 ) ergs/cm2
Time-resolved spectra
Distribution
T90 vs. Hardness ratio plot
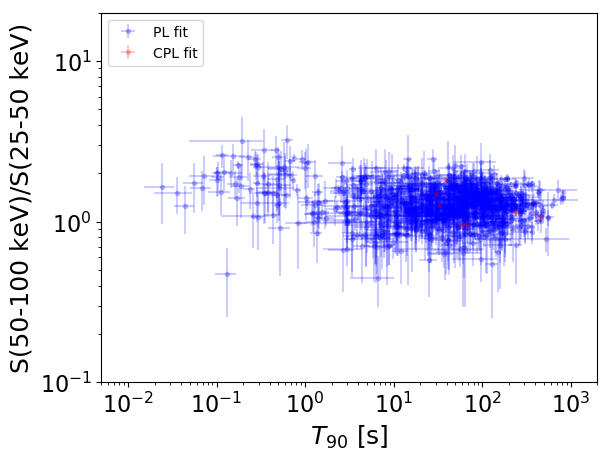
T90                                   = N/A sec.
Hardness ratio (energy fluence ratio) = N/A
S(15-50 keV) vs. S(50-150 keV) plot
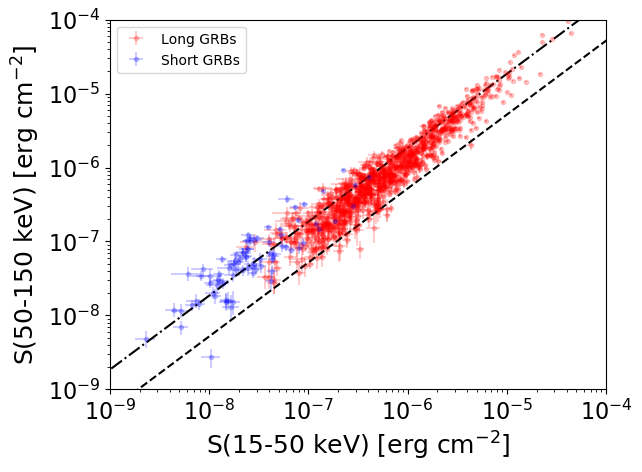
S(15-50 keV)  = N/A
S(50-150 keV) = N/A
The dash-dotted line and the dashed line traces the fluences calculated from the Band function with Epeak = 15 and 150 keV, respectively. Both lines assume a canonical values of alpha = -1 and beta = -2.5.
Mask shadow pattern
IMX = 3.866379967327187E-01, IMY = 7.638013210396750E-02
Spacecraft aspect plot
Bright source in the pre-burst/pre-slew/post-slew images
Pre-burst image of 15-350 keV band
Time interval of the image:
-239.008000 -40.336000

# RAcent  DECcent POSerr Theta    Phi  PeakCts   SNR AngSep     Name
#  [deg]    [deg]    ['] [deg]  [deg]                   [']
299.6700  35.2188    7.0  44.0  -23.2   0.6670   1.7    4.0	Cyg X-1
308.1340  40.9215    3.0  36.2  -17.0   1.1080   3.9    2.2	Cyg X-3
326.3936  38.3698    7.5  22.5  -25.2   0.3328   1.5   10.8	Cyg X-2
 49.0542  53.8735    2.8  40.9   98.3   3.5933   4.2 ------	UNKNOWN
  6.5704  59.5820    2.1  24.4   65.8   1.4445   5.5 ------	UNKNOWN
291.1540  46.0216    3.4  47.5   -6.3   1.3583   3.4 ------	UNKNOWN
281.8817  31.5664    2.8  59.1  -20.3   5.2325   4.2 ------	UNKNOWN
289.2255  26.9215    2.5  55.5  -28.6   4.9179   4.6 ------	UNKNOWN
  8.5269 -17.1807    3.6  55.2 -144.9   4.9061   3.2 ------	UNKNOWN
312.8099  12.5076    2.9  44.5  -60.2   3.6711   4.0 ------	UNKNOWN
Pre-slew background subtracted image of 15-350 keV band
Time interval of the image:
-40.336000 57.292580

# RAcent  DECcent POSerr Theta    Phi  PeakCts   SNR AngSep     Name
#  [deg]    [deg]    ['] [deg]  [deg]                   [']
299.4233  35.3493    7.3  44.2  -22.9   0.4013   1.6   12.1	Cyg X-1
307.9276  40.8562   13.0  36.4  -17.1  -0.1676  -0.9   10.1	Cyg X-3
326.3542  38.2832   10.4  22.6  -25.4  -0.1644  -1.1    8.9	Cyg X-2
 22.5569  76.9688    2.1  42.4   60.2   3.5509   5.6 ------	UNKNOWN
328.0969  43.5445    0.7  21.5  -11.2   2.2511  16.2 ------	UNKNOWN
  9.9121   3.5718    2.1  35.7 -155.3   0.9959   5.6 ------	UNKNOWN
354.0995   0.2152    2.6  36.2 -127.7   1.0314   4.5  354.3	UNKNOWN
 11.9137 -12.7231    2.6  51.7 -150.3   1.8355   4.5 ------	UNKNOWN
304.3752  16.5537    2.4  48.6  -49.0   3.2107   4.9 ------	UNKNOWN
318.0001   9.5979    2.1  42.7  -68.3   2.9940   5.6 ------	UNKNOWN
Post-slew image of 15-350 keV band
Time interval of the image:
105.492600 963.008800

# RAcent  DECcent POSerr Theta    Phi  PeakCts   SNR AngSep     Name
#  [deg]    [deg]    ['] [deg]  [deg]                   [']
254.3073  35.2747    6.5  55.7   13.7  -7.5552  -2.0    8.4	Her X-1
288.8953  10.9280    7.8  47.0  -36.7   2.1227   1.5    5.8	GRS 1915+105
299.6022  35.1959    1.0  23.4  -16.0   7.4406  12.0    0.7	Cyg X-1
308.1126  40.9803    1.9  15.0   -7.8   4.5811   6.2    1.7	Cyg X-3
326.1356  38.3106    4.7   5.4  -78.5   1.4511   2.5    1.8	Cyg X-2
 40.1011  42.2262    3.1  51.0  150.1  10.5043   3.8 ------	UNKNOWN
252.3531  37.6089    3.3  55.8   17.1  11.0991   3.5 ------	UNKNOWN