Analysis Summary
Notes:
- 1) No attempt has been made to eliminate the non-significant decimal places.
- 2) This batgrbproduct analysis is done using the HEASARC data.
- 3) This batgrbproduct analysis is using the flight position for the mask-weighting calculation.
======================================================================
BAT GRB EVENT DATA PROCESSING REPORT
Process Script Ver: batgrbproduct v2.48
Process Start Time: Sat Jul 30 00:12:17 EDT 2022
Host Name: batproc1
Current Working Dir: /local/data/bat1/alien/Swift_3rdBATcatalog/event/batevent_reproc/trigger1032024
======================================================================
Trigger: 01032024 Segment: 000
BAT Trigger Time: 634725824.832 [s; MET]
Trigger Stop: 634725825.344 [s; MET]
UTC: 2021-02-11T08:43:18.344500 [includes UTCF correction]
Where From?: TDRSS position message
BAT
RA: 269.432936029963 Dec: -46.2994226377339 [deg; J2000]
Catalogged Source?: NO
Point Source?: YES
GRB Indicated?: YES [ by BAT flight software ]
Image S/N Ratio: 7.09
Image Trigger?: NO
Rate S/N Ratio: 13.7477270848675 [ if not an image trigger ]
Image S/N Ratio: 7.09
Analysis Position: [ source = BAT ]
RA: 269.432936029963 Dec: -46.2994226377339 [deg; J2000]
Refined Position: [ source = BAT pre-slew burst ]
RA: 269.423171644191 Dec: -46.2715233460588 [deg; J2000]
{ 17h 57m 41.6s , -46d 16' 17.5" }
+/- 1.57711598100587 [arcmin] (estimated 90% radius based on SNR)
+/- 0.752650570265979 [arcmin] (formal 1-sigma fit error)
SNR: 15.8655834548919
Angular difference between the analysis and refined position is 1.722223 arcmin
Partial Coding Fraction: 1.015625 [ including projection effects ]
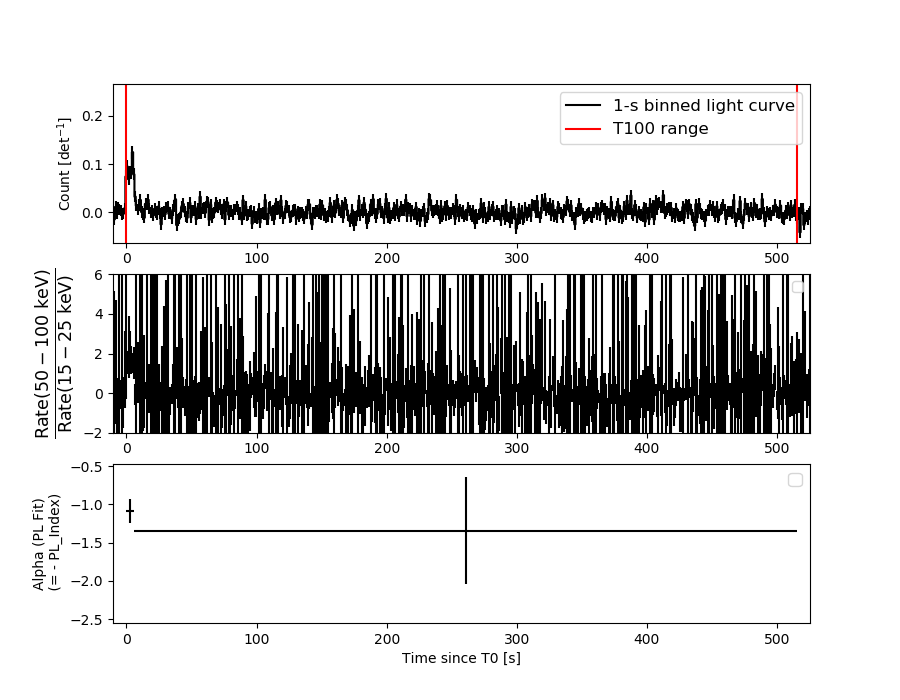
Duration
T90: 451.299999952316 +/- 203.99098611231
Measured from: 3.49599993228912
to: 454.795999884605 [s; relative to TRIGTIME]
T50: 277.483999967575 +/- 218.84366391102
Measured from: 3.82799994945526
to: 281.31199991703 [s; relative to TRIGTIME]
Fluence
Peak Flux (peak 1 second)
Measured from: 4.27999997138977
to: 5.27999997138977 [s; relative to TRIGTIME]
Total Fluence
Measured from: -0.700000047683716
to: 515.34399998188 [s; relative to TRIGTIME]
Band 1 Band 2 Band 3 Band 4
15-25 25-50 50-100 100-350 keV
Total 0.400637 0.568338 0.484112 0.030754
0.154272 0.146249 0.122979 0.105043 [error]
Peak 0.030921 0.052662 0.040460 0.014544
0.007388 0.007423 0.006594 0.005316 [error]
[ fluence units of on-axis counts / fully illuminated detector ]
======================================================================
====== Table of the duration information =============================
Value tstart tstop
T100 516.044 -0.700 515.344
T90 451.300 3.496 454.796
T50 277.484 3.828 281.312
Peak 1.000 4.280 5.280
====== Spectral Analysis Summary =====================================
Model : spectral model: simple power-law (PL) and cutoff power-law (CPL)
Ph_index : photon index: E^{Ph_index}
Ph_90err : 90% error of the photon index
Epeak : Epeak in keV
Epeak_90err: 90% error of Epeak
Norm : normalization at 50 keV in both the PL model and CPL model
Nomr_90err : 90% error of the normalization
chi2 : Chi-Squared
dof : degree of freedo
=== Time-averaged spectral analysis ===
(Best model with acceptable fit: N/A)
Model Ph_index Ph_90err_low Ph_90err_hi Epeak Epeak_90err_low Epeak_90err_hi Norm Nomr_90err_low Norm_90err_hi chi2 dof
PL -1.260 -0.430 0.448 - - - 2.03e-04 -5.16e-05 5.16e-05 75.870 57
CPL -0.007 -1.119 3.596 83.528 -31.179 -83.528 8.03e-04 -8.03e-04 2.86e-02 74.680 56
=== 1-s peak spectral analysis ===
(Best model with acceptable fit: N/A)
Model Ph_index Ph_90err_low Ph_90err_hi Epeak Epeak_90err_low Epeak_90err_hi Norm Nomr_90err_low Norm_90err_hi chi2 dof
PL -1.252 -0.276 0.281 - - - 8.75e-03 -1.38e-03 1.37e-03 46.840 57
CPL -0.965 -1.095 1.301 187.198 -187.198 -187.198 1.21e-02 -4.63e-03 3.82e-02 46.630 56
=== Fluence/Peak Flux Summary ===
Model Band1 Band2 Band3 Band4 Band5 Total
15-25 25-50 50-100 100-350 15-150 15-350 keV
Fluence PL 1.07e-07 2.27e-07 3.79e-07 1.44e-06 1.04e-06 2.16e-06 erg/cm2
90%_error_low -4.63e-08 -6.64e-08 -1.15e-07 -7.54e-07 -2.87e-07 -8.62e-07 erg/cm2
90%_error_hi 5.33e-08 6.48e-08 1.14e-07 1.21e-06 2.93e-07 1.24e-06 erg/cm2
Peak flux PL 2.84e-01 3.32e-01 2.78e-01 3.95e-01 1.04e+00 1.29e+00 ph/cm2/s
90%_error_low -8.09e-02 -6.07e-02 -5.23e-02 -1.37e-01 -1.67e-01 -2.11e-01 ph/cm2/s
90%_error_hi 8.83e-02 5.94e-02 5.15e-02 1.78e-01 1.67e-01 2.16e-01 ph/cm2/s
Fluence CPL 8.23e-08 2.50e-07 4.11e-07 3.58e-07 9.57e-07 1.10e-06 erg/cm2
90%_error_low -4.32e-08 -7.85e-08 -1.35e-07 -3.13e-07 -3.08e-07 -4.45e-07 erg/cm2
90%_error_hi 6.47e-08 8.36e-08 1.40e-07 1.40e-06 3.24e-07 1.46e-06 erg/cm2
Peak flux CPL 2.69e-01 3.40e-01 2.86e-01 2.82e-01 1.02e+00 1.18e+00 ph/cm2/s
90%_error_low -9.84e-02 -6.65e-02 -5.76e-02 -2.82e-01 -1.74e-01 -2.78e-01 ph/cm2/s
90%_error_hi 1.00e-01 7.06e-02 6.07e-02 1.54e-01 1.73e-01 3.08e-01 ph/cm2/s
======================================================================
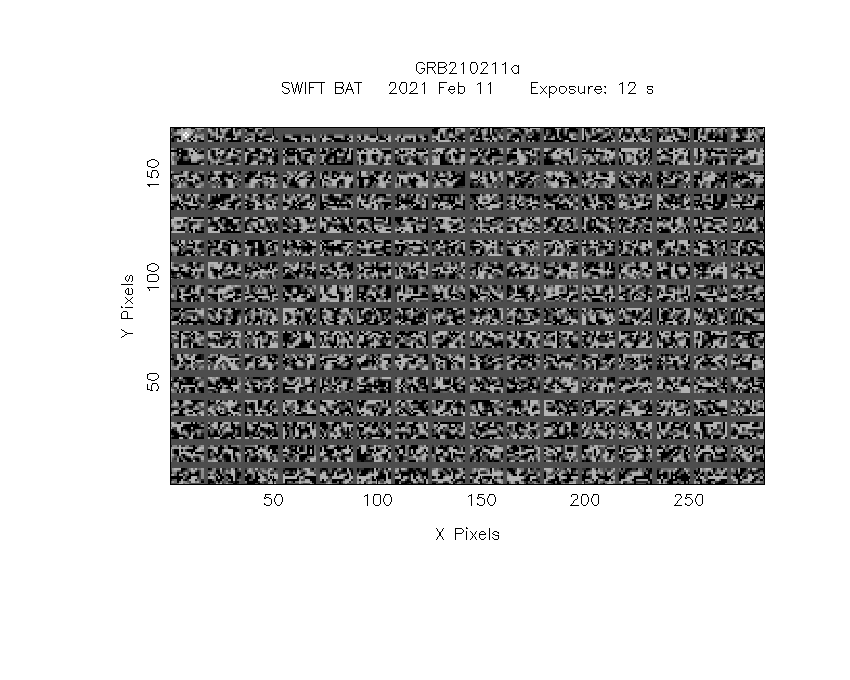
Image
Pre-slew 15.0-350.0 keV image (Event data)
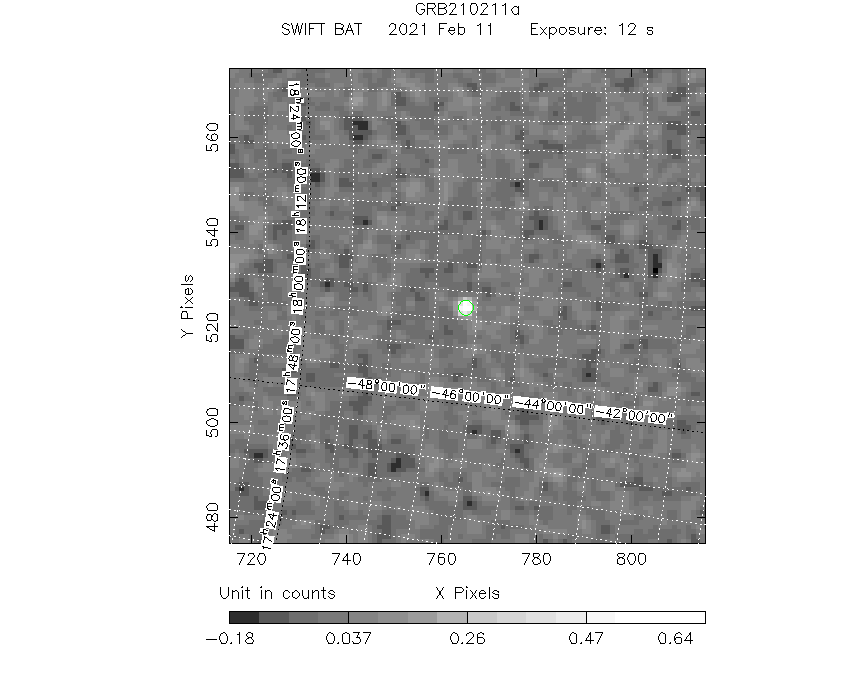
#   RAcent    DECcent   POSerr    Theta     Phi              Peak Cts       SNR   Name
  269.4232   -46.2715   0.0121    14.5976   -22.5331         0.7210388     15.866 TRIG_01032024

Foreground time interval of the image:
 -0.700  11.669 (delta_t =  12.369 [sec])
Background time interval of the image:
-239.832  -0.700 (delta_t = 239.132 [sec])
Light Curves
Note: The mask-weighted lightcurves have units of either count/det or counts/sec/det, where a det is 0.4 x 0.4 = 0.16 sq cm.
Full-time range; 1 s binning
Other quick-look light curves:
- 64 ms binning (zoomed)
- 16 ms binning (zoomed)
- 8 ms binning (zoomed)
- 2 ms binning (zoomed)
- SN=5 or 10 s binning (full-time range)
- Raw light curve
Spectra
- 64 ms binning (zoomed)
- 16 ms binning (zoomed)
- 8 ms binning (zoomed)
- 2 ms binning (zoomed)
- SN=5 or 10 s binning (full-time range)
- Raw light curve
Spectra
Notes:
- 1) The fitting includes the systematic errors.
- 2) When the burst includes telescope slew time periods, the fitting uses an average response file made from multiple 5-s response files through out the slew time plus single time preiod for the non-slew times, and weighted by the total counts in the corresponding time period using addrmf. An average response file is needed becuase a spectral fit using the pre-slew DRM will introduce some errors in both a spectral shape and a normalization if the PHA file contains a lot of the slew/post-slew time interval.
- 3) For fits to more complicated models (e.g. a power-law over a cutoff power-law), the BAT team has decided to require a chi-square improvement of more than 6 for each extra dof.
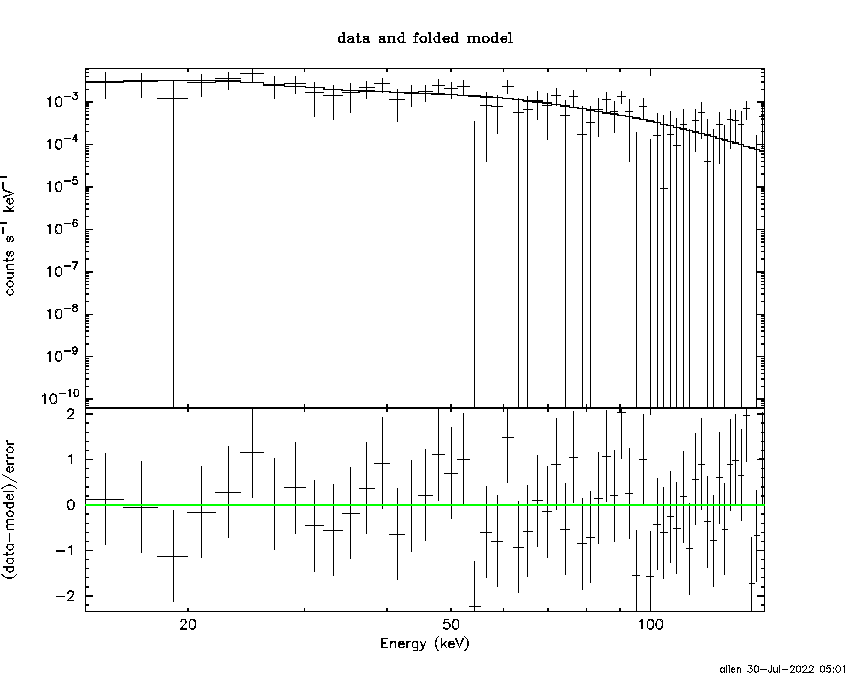
Time averaged spectrum fit using the average DRM
Power-law model
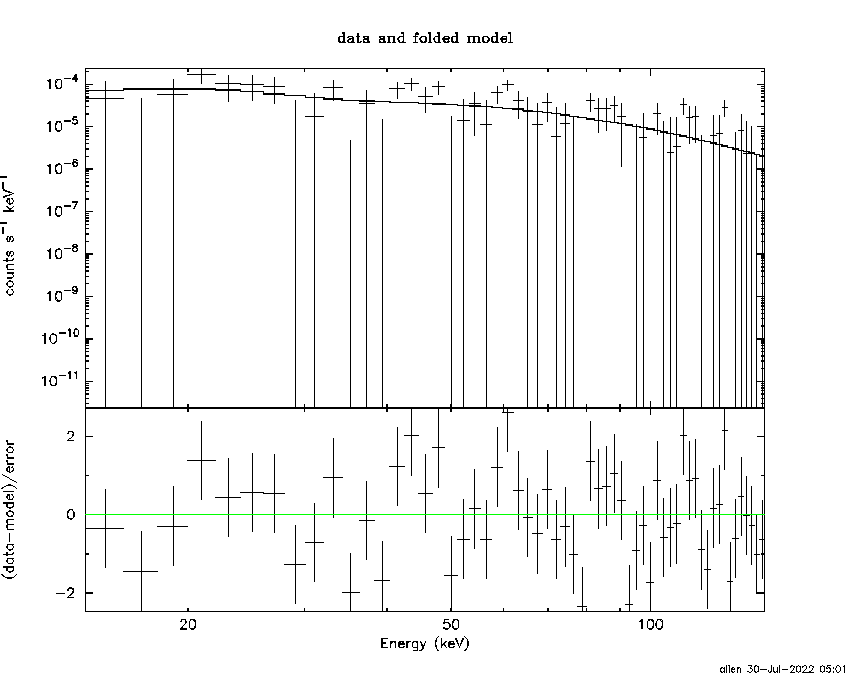
Time interval is from   -0.700 sec. to  515.344 sec.

Spectral model in power-law:
------------------------------------------------------------
Parameters  : value       lower 90%   higher 90%
Photon index: -1.26024     ( -0.430438   0.447912 )
Norm@50keV  : 2.02674E-04    ( -5.16483e-05   5.16477e-05 )
------------------------------------------------------------
#Fit statistic  : Chi-Squared                   75.87     using 59 bins.
 Reduced chi-squared = 1.33105
# Null hypothesis probability of 4.80e-02 with 57 degrees of freedom

Photon flux (15-150 keV)    in 516 sec: 2.40116E-02 ( -0.0063166  0.0063667 ) ph/cm2/s
Energy fluence (15-150 keV)             : 1.04395e-06 ( -2.87101e-07  2.9289e-07 ) ergs/cm2
Cutoff power-law model
Time interval is from   -0.700 sec. to  515.344 sec.
Spectral model in the cutoff power-law:
------------------------------------------------------------
Parameters  : value       lower 90%   higher 90%
Photon index: -0.00671053     ( -1.11867   3.59608 )
Epeak [keV] : 83.5282      ( -31.1791 -83.5281 )
Norm@50keV  : 8.03397E-04    ( -0.0008034   0.0286119 )
------------------------------------------------------------
#Fit statistic  : Chi-Squared                   74.68     using 59 bins.
 Reduced chi-squared = 1.33357
# Null hypothesis probability of 4.83e-02 with 56 degrees of freedom

Photon flux (15-150 keV)    in 516 sec: 2.26189E-02 ( -0.0068623  0.0067549 ) ph/cm2/s
Energy fluence (15-150 keV)             : 9.56974e-07 ( -3.07906e-07  3.2394e-07 ) ergs/cm2
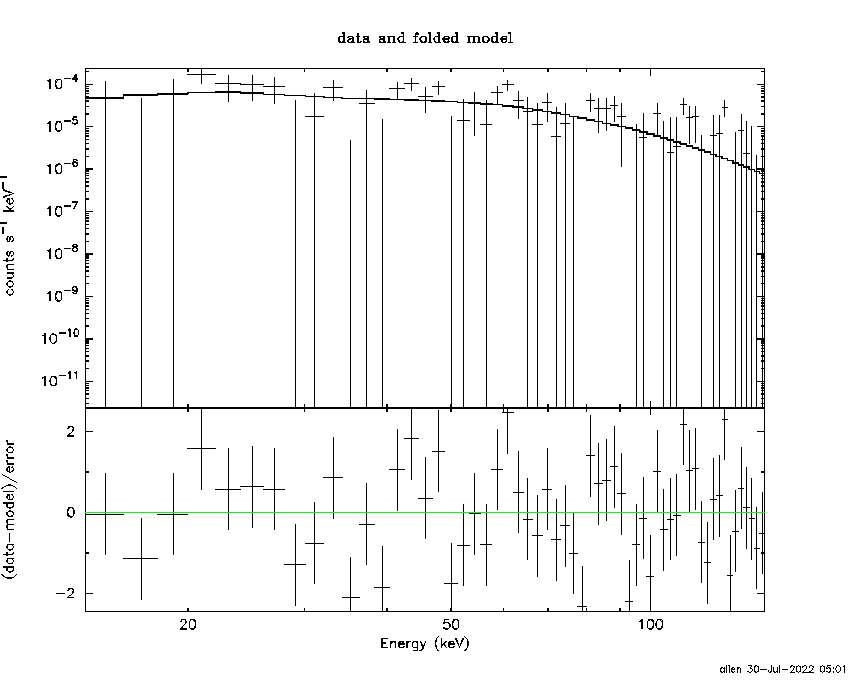
1-s peak spectrum fit
Power-law model
Time interval is from    4.280 sec. to    5.280 sec.

Spectral model in power-law:
------------------------------------------------------------
Parameters  : value       lower 90%   higher 90%
Photon index: -1.25223     ( -0.275718   0.281164 )
Norm@50keV  : 8.75462E-03    ( -0.00137561   0.00137392 )
------------------------------------------------------------
#Fit statistic  : Chi-Squared                   46.84     using 59 bins.
 Reduced chi-squared = 0.821754
# Null hypothesis probability of 8.29e-01 with 57 degrees of freedom

Photon flux (15-150 keV)    in 1 sec: 1.03582 ( -0.166569  0.16703 ) ph/cm2/s
Energy fluence (15-150 keV)             : 8.7575e-08 ( -1.53013e-08  1.55063e-08 ) ergs/cm2
Cutoff power-law model
Time interval is from    4.280 sec. to    5.280 sec.
Spectral model in the cutoff power-law:
------------------------------------------------------------
Parameters  : value       lower 90%   higher 90%
Photon index: -0.964943     ( -1.09469   1.30084 )
Epeak [keV] : 187.198      ( -187.233 -187.233 )
Norm@50keV  : 1.21137E-02    ( -0.00462884   0.0382054 )
------------------------------------------------------------
#Fit statistic  : Chi-Squared                   46.63     using 59 bins.
 Reduced chi-squared = 0.832679
# Null hypothesis probability of 8.10e-01 with 56 degrees of freedom

Photon flux (15-150 keV)    in 1 sec: 1.02296 ( -0.17406  0.17304 ) ph/cm2/s
Energy fluence (15-150 keV)             : 3.13466e-08 ( -7.69176e-09  8.07915e-09 ) ergs/cm2
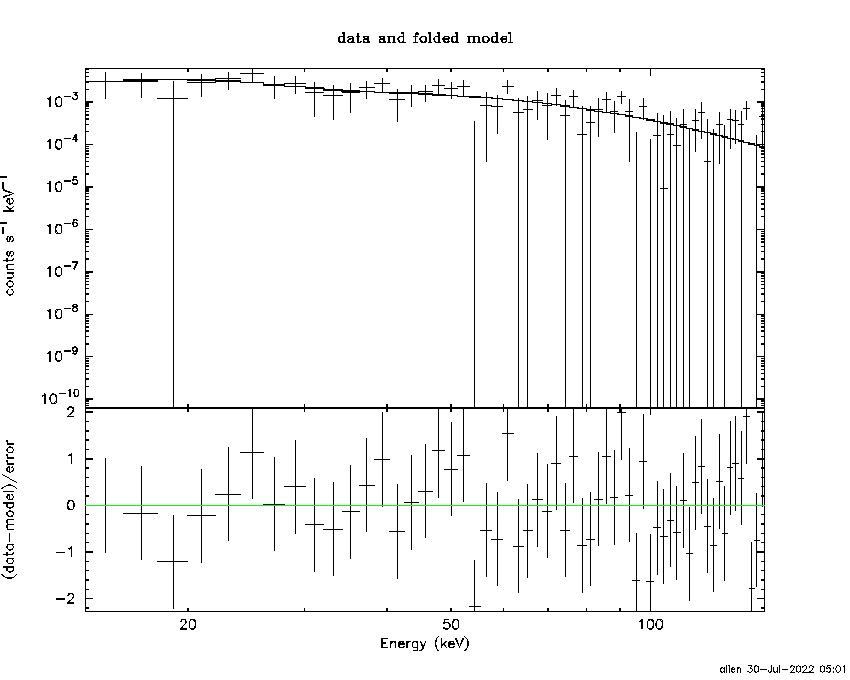
Time-resolved spectra
Distribution
T90 vs. Hardness ratio plot
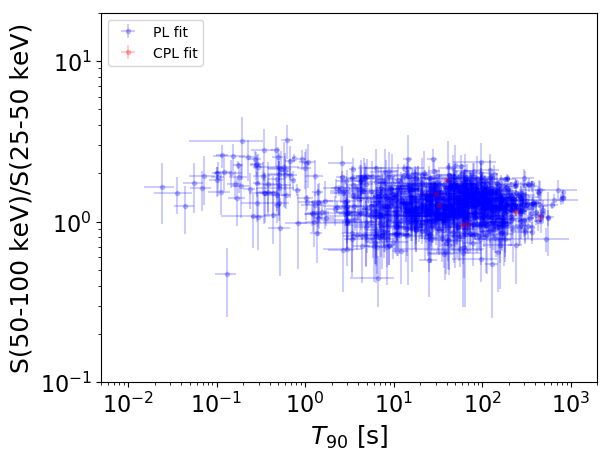
T90                                   = N/A sec.
Hardness ratio (energy fluence ratio) = N/A
S(15-50 keV) vs. S(50-150 keV) plot
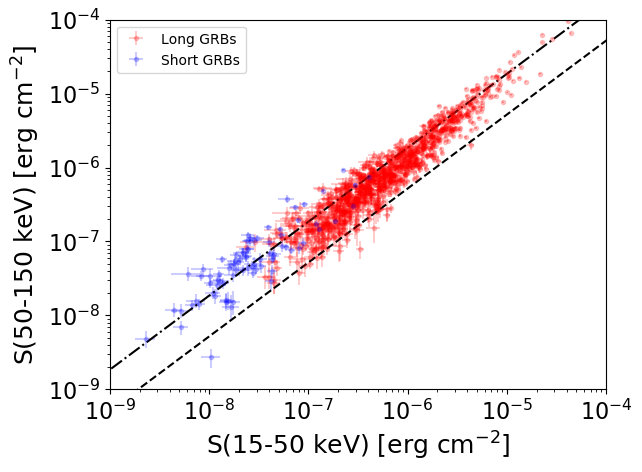
S(15-50 keV)  = N/A
S(50-150 keV) = N/A
The dash-dotted line and the dashed line traces the fluences calculated from the Band function with Epeak = 15 and 150 keV, respectively. Both lines assume a canonical values of alpha = -1 and beta = -2.5.
Mask shadow pattern
IMX = 2.405527487595046E-01, IMY = 9.980326310323284E-02
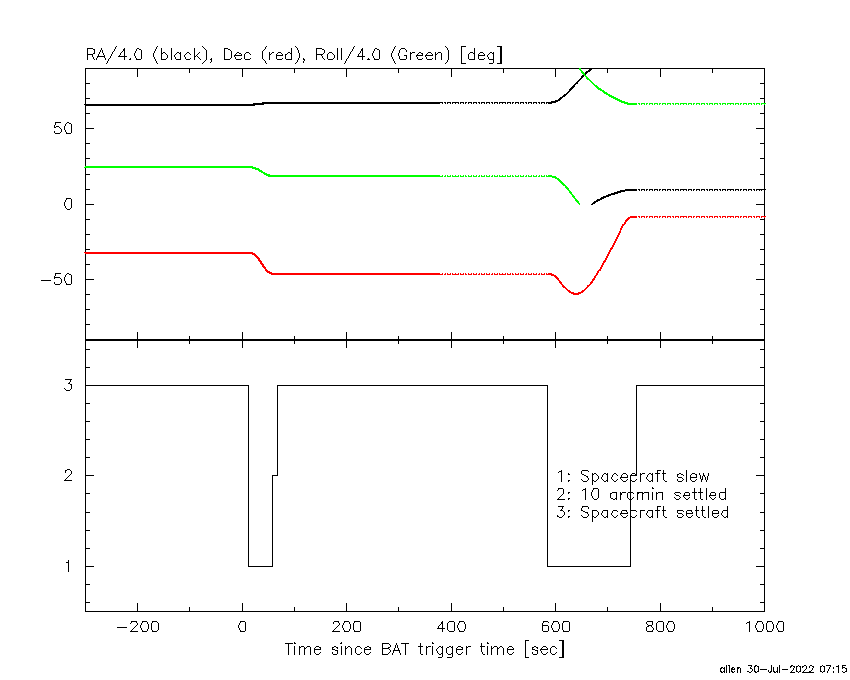
Spacecraft aspect plot
Bright source in the pre-burst/pre-slew/post-slew images
Pre-burst image of 15-350 keV band
Time interval of the image:
-239.832000 -0.700000

# RAcent  DECcent POSerr Theta    Phi  PeakCts   SNR AngSep     Name
#  [deg]    [deg]    ['] [deg]  [deg]                   [']
244.9846 -15.6233    0.6  24.0  121.8   7.1978  17.8    1.1	Sco X-1
255.9974 -37.8247    3.7   8.6   40.0   0.8184   3.1    1.3	4U 1700-377
256.2472 -36.4178    4.9   7.7   47.4   0.6514   2.4    9.1	GX 349+2
262.8707 -24.5765    0.0   7.8  164.5   0.2425   0.8   12.6	GX 1+4
264.9737 -44.3190    0.0  12.1  -10.8   0.1694   0.6   12.6	4U 1735-44
268.5005  -1.4228    8.5  31.1 -179.0   0.4791   1.4    8.1	SW J1753.5-0127
270.2886 -25.0874   34.1   9.0 -148.7  -0.0884  -0.3    0.5	GX 5-1
270.3019 -25.7435    3.1   8.5 -146.1   0.9992   4.0    0.0	GRS 1758-258
274.1543 -13.9859   10.5  20.5 -158.5   0.3242   1.1    9.2	GX 17+2
275.8656 -30.4714    3.0  10.2 -104.6   1.0840   3.8    7.0	H1820-303
285.0505 -24.8083 1588.3  19.9 -114.3  -0.0022  -0.0    6.8	HT1900.1-2455
288.9019  11.0061   17.5  49.4 -154.7  -0.4385  -0.7    7.1	GRS 1915+105
263.0050 -33.8424    6.4   1.8   21.1   0.4891   1.8    0.9	GX 354-0
255.7311 -48.7896    1.0  17.7   10.7   3.1557  11.4 ------	UNKNOWN
283.5002   6.8306    2.9  43.3 -158.8   2.1003   4.0 ------	UNKNOWN
311.0660 -68.0109    3.1  44.7  -30.6   1.8400   3.8 ------	UNKNOWN
306.0144 -11.3015    3.0  43.9 -116.5   4.8100   3.8 ------	UNKNOWN
Pre-slew background subtracted image of 15-350 keV band
Time interval of the image:
-0.700000 11.668600

# RAcent  DECcent POSerr Theta    Phi  PeakCts   SNR AngSep     Name
#  [deg]    [deg]    ['] [deg]  [deg]                   [']
245.0939 -15.5213    5.6  24.0  122.1   0.1161   2.1    9.7	Sco X-1
256.1435 -37.9789    7.6   8.6   38.7  -0.0668  -1.5   11.0	4U 1700-377
256.2406 -36.4433    8.1   7.7   47.3  -0.0618  -1.4    9.5	GX 349+2
262.9701 -24.5892    5.2   7.7  165.1  -0.0938  -2.2    9.6	GX 1+4
264.6571 -44.5935    4.7  12.3   -9.7  -0.1037  -2.4    9.4	4U 1735-44
268.3841  -1.3915   10.0  31.1 -179.2  -0.0611  -1.2    3.8	SW J1753.5-0127
270.3035 -24.9306   57.8   9.2 -149.3  -0.0085  -0.2    9.0	GX 5-1
270.1505 -25.5812    0.0   8.6 -147.5   0.0575   1.4   12.7	GRS 1758-258
273.8662 -13.8830    9.8  20.5 -159.3  -0.0547  -1.2   12.3	GX 17+2
276.0145 -30.4992   53.8  10.4 -104.3   0.0095   0.2    9.2	H1820-303
285.0302 -24.9206  120.3  19.8 -114.1   0.0048   0.1    0.3	HT1900.1-2455
288.8204  10.8094   73.6  49.2 -154.7   0.0156   0.2    8.3	GRS 1915+105
262.7980 -33.8842    8.3   1.9   24.9  -0.0613  -1.4   10.0	GX 354-0
269.4232 -46.2715    0.7  14.6  -22.5   0.7207  15.9 ------	UNKNOWN
280.4966 -10.6833    2.0  26.4 -148.9   0.2815   5.6 ------	UNKNOWN
294.6692 -65.3152    2.3  37.9  -27.9   0.3307   5.0 ------	UNKNOWN
Post-slew image of 15-350 keV band
Time interval of the image:
57.268610 584.668590

# RAcent  DECcent POSerr Theta    Phi  PeakCts   SNR AngSep     Name
#  [deg]    [deg]    ['] [deg]  [deg]                   [']
244.9794 -15.6410    0.7  36.8  154.4  14.4922  16.3    0.0	Sco X-1
256.0365 -37.9830    5.3  12.9  141.4   1.0213   2.2    8.7	4U 1700-377
256.4457 -36.3751    2.4  13.9  147.1   2.1722   4.7    2.9	GX 349+2
263.0831 -24.7941    5.2  22.1 -179.4   1.1326   2.2    5.0	GX 1+4
264.5727 -44.5938    3.9   3.8  131.0   1.3756   3.0   11.3	4U 1735-44
268.2212  -1.3769    8.5  44.9 -165.6   1.4565   1.3    9.9	SW J1753.5-0127
270.1291 -25.1024    4.0  21.2 -162.2   1.5073   2.9    8.5	GX 5-1
270.2024 -25.7212    2.6  20.6 -162.0   2.4000   4.6    5.6	GRS 1758-258
274.0791 -13.8658    0.0  32.7 -155.5   0.1352   0.2   11.1	GX 17+2
275.9781 -30.2477    3.6  16.8 -144.1   1.6514   3.2    7.7	H1820-303
285.2184 -24.9227   69.4  24.8 -128.0   0.1050   0.2    9.9	HT1900.1-2455
263.1003 -33.9149    4.1  13.3  172.6   1.4611   2.8    7.3	GX 354-0
236.6940  -8.7460    2.5  46.8  149.0   7.4368   4.7 ------	UNKNOWN
261.2347 -73.9514    2.9  27.9   21.0   2.3237   4.0 ------	UNKNOWN
255.6862 -48.7888    1.1   9.6   86.1   6.0284  10.7 ------	UNKNOWN
 31.7677 -72.5233    3.3  54.6   -2.0   6.1507   3.5 ------	UNKNOWN
353.3590 -76.6537    2.1  43.9   -3.2   4.8055   5.4 ------	UNKNOWN
262.7853   3.2500    3.0  49.9 -172.6   4.6339   3.9 ------	UNKNOWN
  1.6548 -68.4817    3.4  48.5  -13.2   3.6826   3.4 ------	UNKNOWN