Analysis Summary
Notes:
- 1) No attempt has been made to eliminate the non-significant decimal places.
- 2) This batgrbproduct analysis is done using the HEASARC data.
- 3) This batgrbproduct analysis is using the flight position for the mask-weighting calculation.
======================================================================
BAT GRB EVENT DATA PROCESSING REPORT
Process Script Ver: batgrbproduct v2.48
Process Start Time: Sat Jul 30 00:09:31 EDT 2022
Host Name: batproc1
Current Working Dir: /local/data/bat1/alien/Swift_3rdBATcatalog/event/batevent_reproc/trigger1032183
======================================================================
Trigger: 01032183 Segment: 000
BAT Trigger Time: 634796744.512 [s; MET]
Trigger Stop: 634796760.896 [s; MET]
UTC: 2021-02-12T04:25:18.019800 [includes UTCF correction]
Where From?: TDRSS position message
BAT
RA: 72.2609556926666 Dec: 7.23375771191397 [deg; J2000]
Catalogged Source?: NO
Point Source?: YES
GRB Indicated?: YES [ by BAT flight software ]
Image S/N Ratio: 7.13
Image Trigger?: NO
Rate S/N Ratio: 10.770329614269 [ if not an image trigger ]
Image S/N Ratio: 7.13
Analysis Position: [ source = BAT ]
RA: 72.2609556926666 Dec: 7.23375771191397 [deg; J2000]
Refined Position: [ source = BAT pre-slew burst ]
RA: 72.2502988328754 Dec: 7.21575385417514 [deg; J2000]
{ 04h 49m 00.1s , +07d 12' 56.7" }
+/- 1.89965894570356 [arcmin] (estimated 90% radius based on SNR)
+/- 0.735885674500343 [arcmin] (formal 1-sigma fit error)
SNR: 12.162149203371
Angular difference between the analysis and refined position is 1.252709 arcmin
Partial Coding Fraction: 1.03125 [ including projection effects ]
Duration
T90: 80 +/- 35.7770876399966
Measured from: -15.5119999647141
to: 64.4880000352859 [s; relative to TRIGTIME]
T50: 32 +/- 22.6274169979695
Measured from: 0.48800003528595
to: 32.4880000352859 [s; relative to TRIGTIME]
Fluence
Peak Flux (peak 1 second)
Measured from: 7.98800003528595
to: 8.98800003528595 [s; relative to TRIGTIME]
Total Fluence
Measured from: -15.5119999647141
to: 80.4880000352859 [s; relative to TRIGTIME]
Band 1 Band 2 Band 3 Band 4
15-25 25-50 50-100 100-350 keV
Total 0.545028 0.610257 0.288170 0.108470
0.062161 0.063891 0.055665 0.048490 [error]
Peak 0.021733 0.021777 0.017574 -0.001469
0.006587 0.006743 0.005777 0.004692 [error]
[ fluence units of on-axis counts / fully illuminated detector ]
======================================================================
====== Table of the duration information =============================
Value tstart tstop
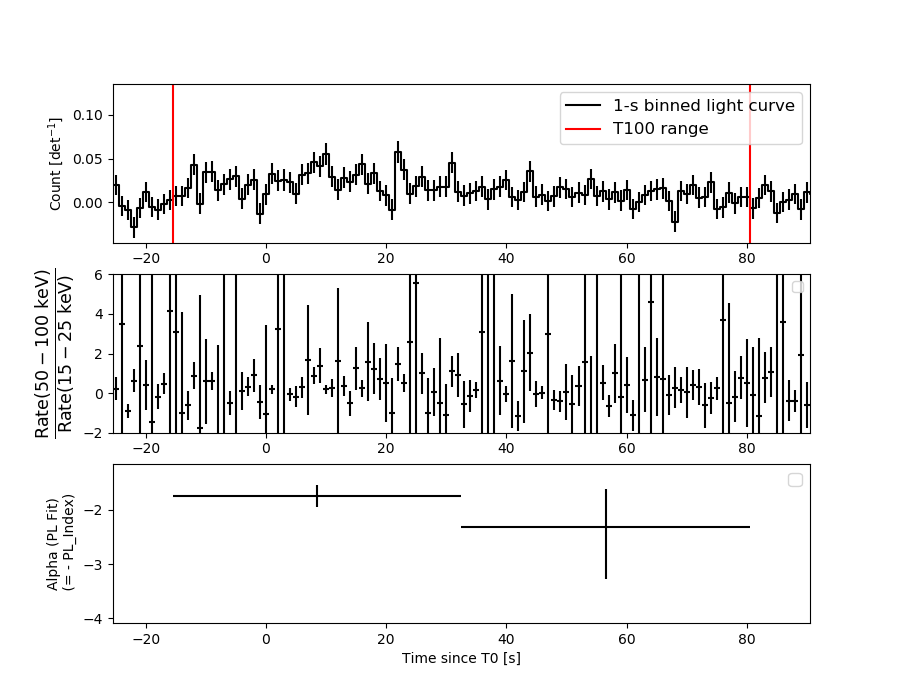
T100 96.000 -15.512 80.488
T90 80.000 -15.512 64.488
T50 32.000 0.488 32.488
Peak 1.000 7.988 8.988
====== Spectral Analysis Summary =====================================
Model : spectral model: simple power-law (PL) and cutoff power-law (CPL)
Ph_index : photon index: E^{Ph_index}
Ph_90err : 90% error of the photon index
Epeak : Epeak in keV
Epeak_90err: 90% error of Epeak
Norm : normalization at 50 keV in both the PL model and CPL model
Nomr_90err : 90% error of the normalization
chi2 : Chi-Squared
dof : degree of freedo
=== Time-averaged spectral analysis ===
(Best model with acceptable fit: N/A)
Model Ph_index Ph_90err_low Ph_90err_hi Epeak Epeak_90err_low Epeak_90err_hi Norm Nomr_90err_low Norm_90err_hi chi2 dof
PL -1.846 -0.235 0.223 - - - 9.08e-04 -1.37e-04 1.34e-04 83.080 57
CPL -1.836 -0.834 1.040 532.943 -532.933 -532.943 9.21e-04 -1.50e-04 1.92e-03 83.080 56
=== 1-s peak spectral analysis ===
(Best model with acceptable fit: N/A)
Model Ph_index Ph_90err_low Ph_90err_hi Epeak Epeak_90err_low Epeak_90err_hi Norm Nomr_90err_low Norm_90err_hi chi2 dof
PL -1.646 -0.533 0.488 - - - 3.88e-03 -1.29e-03 1.24e-03 45.000 57
CPL -0.840 -1.392 2.902 65.040 -52.116 -65.040 1.08e-02 -1.08e-02 3.60e-01 44.530 56
=== Fluence/Peak Flux Summary ===
Model Band1 Band2 Band3 Band4 Band5 Total
15-25 25-50 50-100 100-350 15-150 15-350 keV
Fluence PL 1.54e-07 2.29e-07 2.55e-07 5.36e-07 8.01e-07 1.18e-06 erg/cm2
90%_error_low -2.64e-08 -2.75e-08 -5.22e-08 -1.92e-07 -1.19e-07 -2.53e-07 erg/cm2
90%_error_hi 2.70e-08 2.75e-08 5.33e-08 2.54e-07 1.23e-07 3.03e-07 erg/cm2
Peak flux PL 1.84e-01 1.69e-01 1.08e-01 1.06e-01 5.06e-01 5.68e-01 ph/cm2/s
90%_error_low -7.57e-02 -4.95e-02 -4.49e-02 -6.62e-02 -1.46e-01 -1.69e-01 ph/cm2/s
90%_error_hi 8.20e-02 4.93e-02 4.52e-02 1.09e-01 1.46e-01 1.73e-01 ph/cm2/s
Fluence CPL 1.54e-07 2.12e-07 2.29e-07 5.50e-07 7.46e-07 1.15e-06 erg/cm2
90%_error_low -2.64e-08 -4.38e-08 -4.47e-08 -3.12e-07 -1.50e-07 -1.11e-06 erg/cm2
90%_error_hi 2.75e-08 3.66e-08 3.15e-08 7.17e-08 1.16e-07 1.63e-07 erg/cm2
Peak flux CPL 1.67e-01 1.86e-01 1.12e-01 4.17e-02 4.94e-01 5.07e-01 ph/cm2/s
90%_error_low -1.67e-01 -5.48e-02 -5.27e-02 -4.17e-02 -1.50e-01 -1.61e-01 ph/cm2/s
90%_error_hi 9.15e-02 6.85e-02 5.22e-02 9.08e-02 1.49e-01 1.67e-01 ph/cm2/s
======================================================================
Image
Pre-slew 15.0-350.0 keV image (Event data)
#   RAcent    DECcent   POSerr    Theta     Phi              Peak Cts       SNR   Name
   72.2503     7.2158   0.0159     5.2505   -65.0454         1.4939900     12.162 TRIG_01032183

Foreground time interval of the image:
-15.512  67.589 (delta_t =  83.101 [sec])
Background time interval of the image:
-239.512 -15.512 (delta_t = 224.000 [sec])
Light Curves
Note: The mask-weighted lightcurves have units of either count/det or counts/sec/det, where a det is 0.4 x 0.4 = 0.16 sq cm.
Full-time range; 1 s binning
Other quick-look light curves:
- 64 ms binning (zoomed)
- 16 ms binning (zoomed)
- 8 ms binning (zoomed)
- 2 ms binning (zoomed)
- SN=5 or 10 s binning (full-time range)
- Raw light curve
Spectra
- 64 ms binning (zoomed)
- 16 ms binning (zoomed)
- 8 ms binning (zoomed)
- 2 ms binning (zoomed)
- SN=5 or 10 s binning (full-time range)
- Raw light curve
Spectra
Notes:
- 1) The fitting includes the systematic errors.
- 2) When the burst includes telescope slew time periods, the fitting uses an average response file made from multiple 5-s response files through out the slew time plus single time preiod for the non-slew times, and weighted by the total counts in the corresponding time period using addrmf. An average response file is needed becuase a spectral fit using the pre-slew DRM will introduce some errors in both a spectral shape and a normalization if the PHA file contains a lot of the slew/post-slew time interval.
- 3) For fits to more complicated models (e.g. a power-law over a cutoff power-law), the BAT team has decided to require a chi-square improvement of more than 6 for each extra dof.
Time averaged spectrum fit using the average DRM
Power-law model
Time interval is from  -15.512 sec. to   80.488 sec.

Spectral model in power-law:
------------------------------------------------------------
Parameters  : value       lower 90%   higher 90%
Photon index: -1.84622     ( -0.235439   0.223366 )
Norm@50keV  : 9.07576E-04    ( -0.000137411   0.000133529 )
------------------------------------------------------------
#Fit statistic  : Chi-Squared                   83.08     using 59 bins.
 Reduced chi-squared = 1.45754
# Null hypothesis probability of 1.37e-02 with 57 degrees of freedom

Photon flux (15-150 keV)    in 96 sec: 0.127381 ( -0.015202  0.015203 ) ph/cm2/s
Energy fluence (15-150 keV)             : 8.01311e-07 ( -1.19347e-07  1.22645e-07 ) ergs/cm2
Cutoff power-law model

Time interval is from  -15.512 sec. to   80.488 sec.
Spectral model in the cutoff power-law:
------------------------------------------------------------
Parameters  : value       lower 90%   higher 90%
Photon index: -1.83569     ( -0.829999   1.04404 )
Epeak [keV] : 532.943      ( -9988.61 -9988.62 )
Norm@50keV  : 9.20720E-04    ( -0.000136974   0.00192961 )
------------------------------------------------------------
#Fit statistic  : Chi-Squared                   83.08     using 59 bins.
 Reduced chi-squared = 1.48357
# Null hypothesis probability of 1.09e-02 with 56 degrees of freedom

Photon flux (15-150 keV)    in 96 sec: 0.127377 ( -0.015834  0.015203 ) ph/cm2/s
Energy fluence (15-150 keV)             : 7.46193e-07 ( -1.4954e-07  1.16272e-07 ) ergs/cm2
1-s peak spectrum fit
Power-law model

Time interval is from    7.988 sec. to    8.988 sec.

Spectral model in power-law:
------------------------------------------------------------
Parameters  : value       lower 90%   higher 90%
Photon index: -1.64594     ( -0.532885   0.487861 )
Norm@50keV  : 3.87681E-03    ( -0.00129383   0.00123844 )
------------------------------------------------------------
#Fit statistic  : Chi-Squared                   45.00     using 59 bins.
 Reduced chi-squared = 0.789474
# Null hypothesis probability of 8.75e-01 with 57 degrees of freedom

Photon flux (15-150 keV)    in 1 sec: 0.505559 ( -0.146358  0.14639 ) ph/cm2/s
Energy fluence (15-150 keV)             : 3.60753e-08 ( -1.22828e-08  1.28496e-08 ) ergs/cm2
Cutoff power-law model
Time interval is from    7.988 sec. to    8.988 sec.
Spectral model in the cutoff power-law:
------------------------------------------------------------
Parameters  : value       lower 90%   higher 90%
Photon index: -0.839565     ( -1.39206   2.90191 )
Epeak [keV] : 65.0401      ( -52.1155 -65.0399 )
Norm@50keV  : 1.07753E-02    ( -0.0107755   0.360292 )
------------------------------------------------------------
#Fit statistic  : Chi-Squared                   44.53     using 59 bins.
 Reduced chi-squared = 0.795179
# Null hypothesis probability of 8.65e-01 with 56 degrees of freedom

Photon flux (15-150 keV)    in 1 sec: 0.493638 ( -0.149705  0.149451 ) ph/cm2/s
Energy fluence (15-150 keV)             : 3.36574e-08 ( -1.23657e-08  1.4079e-08 ) ergs/cm2
Time-resolved spectra
Distribution
T90 vs. Hardness ratio plot
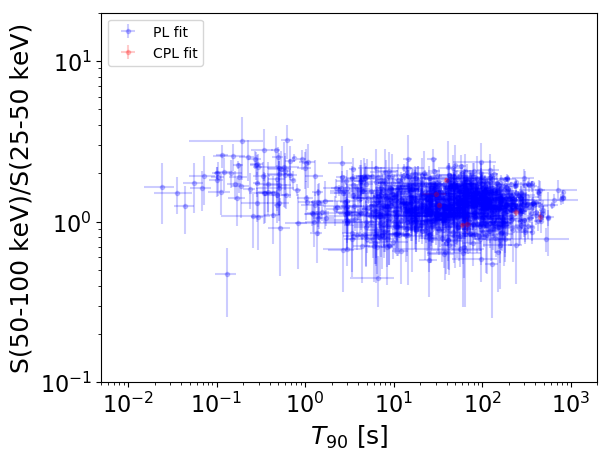
T90                                   = N/A sec.
Hardness ratio (energy fluence ratio) = N/A
S(15-50 keV) vs. S(50-150 keV) plot
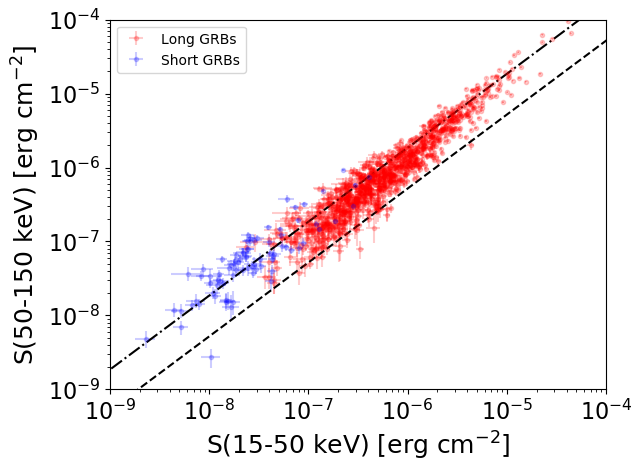
S(15-50 keV)  = N/A
S(50-150 keV) = N/A
The dash-dotted line and the dashed line traces the fluences calculated from the Band function with Epeak = 15 and 150 keV, respectively. Both lines assume a canonical values of alpha = -1 and beta = -2.5.
Mask shadow pattern
IMX = 3.877095071584416E-02, IMY = 8.331681337943837E-02
Spacecraft aspect plot
Bright source in the pre-burst/pre-slew/post-slew images
Pre-burst image of 15-350 keV band
Time interval of the image:
-239.512000 -15.512000

# RAcent  DECcent POSerr Theta    Phi  PeakCts   SNR AngSep     Name
#  [deg]    [deg]    ['] [deg]  [deg]                   [']
 83.6511  22.0146    0.3  17.5   27.6   9.5857  35.1    1.0	Crab
 74.0320 -20.5541    2.4  26.4 -165.5   1.2649   4.7 ------	UNKNOWN
 46.6734 -41.8727    4.8  55.1 -144.9   4.8850   2.4 ------	UNKNOWN
Pre-slew background subtracted image of 15-350 keV band
Time interval of the image:
-15.512000 67.588600

# RAcent  DECcent POSerr Theta    Phi  PeakCts   SNR AngSep     Name
#  [deg]    [deg]    ['] [deg]  [deg]                   [']
 83.6996  22.0340    6.4  17.5   27.7  -0.2393  -1.8    3.9	Crab
 73.6632  43.4436    2.1  37.9    3.3   1.0649   5.4 ------	UNKNOWN
 77.9158 -12.9506    2.3  18.6 -174.3   0.6718   5.1 ------	UNKNOWN
 72.2503   7.2157    0.9   5.3  -65.0   1.4939  12.2 ------	UNKNOWN
 39.7428 -16.1475    2.3  43.1 -113.4   2.4307   4.9 ------	UNKNOWN
Post-slew image of 15-350 keV band
Time interval of the image:
91.588610 928.988610

# RAcent  DECcent POSerr Theta    Phi  PeakCts   SNR AngSep     Name
#  [deg]    [deg]    ['] [deg]  [deg]                   [']
 83.6601  22.0208    0.8  18.4   47.7  33.7064  15.2    1.5	Crab
101.8574   2.9257    2.7  29.8  109.1  12.3977   4.3 ------	UNKNOWN
 41.7647  55.5876    3.0  54.1   -8.5  22.5806   3.8 ------	UNKNOWN
 30.8701  45.8224    3.3  52.5  -23.3  22.7887   3.5 ------	UNKNOWN
 40.0926 -18.0578    3.6  40.6 -116.7  20.2243   3.2 ------	UNKNOWN
 24.8602  26.5700    2.6  48.9  -48.6  46.1594   4.4 ------	UNKNOWN