Analysis Summary
Notes:
- 1) No attempt has been made to eliminate the non-significant decimal places.
- 2) This batgrbproduct analysis is done using the HEASARC data.
- 3) This batgrbproduct analysis is using the flight position for the mask-weighting calculation.
======================================================================
BAT GRB EVENT DATA PROCESSING REPORT
Process Script Ver: batgrbproduct v2.48
Process Start Time: Sat Jul 30 00:02:39 EDT 2022
Host Name: batproc1
Current Working Dir: /local/data/bat1/alien/Swift_3rdBATcatalog/event/batevent_reproc/trigger1033328
======================================================================
Trigger: 01033328 Segment: 000
BAT Trigger Time: 635348146.176 [s; MET]
Trigger Stop: 635348147.2 [s; MET]
UTC: 2021-02-18T13:35:19.647260 [includes UTCF correction]
Where From?: TDRSS position message
BAT
RA: 47.2910601557218 Dec: 35.287132551004 [deg; J2000]
Catalogged Source?: NO
Point Source?: YES
GRB Indicated?: YES [ by BAT flight software ]
Image S/N Ratio: 7.16
Image Trigger?: NO
Rate S/N Ratio: 7.07106781186548 [ if not an image trigger ]
Image S/N Ratio: 7.16
Analysis Position: [ source = BAT ]
RA: 47.2910601557218 Dec: 35.287132551004 [deg; J2000]
Refined Position: [ source = BAT pre-slew burst ]
RA: 47.3203263045052 Dec: 35.3228320461168 [deg; J2000]
{ 03h 09m 16.9s , +35d 19' 22.2" }
+/- 1.41716551781561 [arcmin] (estimated 90% radius based on SNR)
+/- 0.548509073953229 [arcmin] (formal 1-sigma fit error)
SNR: 18.4843111522042
Angular difference between the analysis and refined position is 2.577129 arcmin
Partial Coding Fraction: 0.578125 [ including projection effects ]
Duration
T90: 215.927999973297 +/- 30.2537176723276
Measured from: -3.86000001430511
to: 212.067999958992 [s; relative to TRIGTIME]
T50: 96.3799999952316 +/- 13.7069168189479
Measured from: 13.9639999866486
to: 110.34399998188 [s; relative to TRIGTIME]
Fluence
Peak Flux (peak 1 second)
Measured from: 0.0920000076293945
to: 1.09200000762939 [s; relative to TRIGTIME]
Total Fluence
Measured from: -13.4759999513626
to: 246.583999991417 [s; relative to TRIGTIME]
Band 1 Band 2 Band 3 Band 4
15-25 25-50 50-100 100-350 keV
Total 1.609231 2.474646 1.912669 0.371546
0.138677 0.142622 0.122790 0.101988 [error]
Peak 0.015597 0.058769 0.041593 0.018091
0.009040 0.009840 0.008691 0.006907 [error]
[ fluence units of on-axis counts / fully illuminated detector ]
======================================================================
====== Table of the duration information =============================
Value tstart tstop
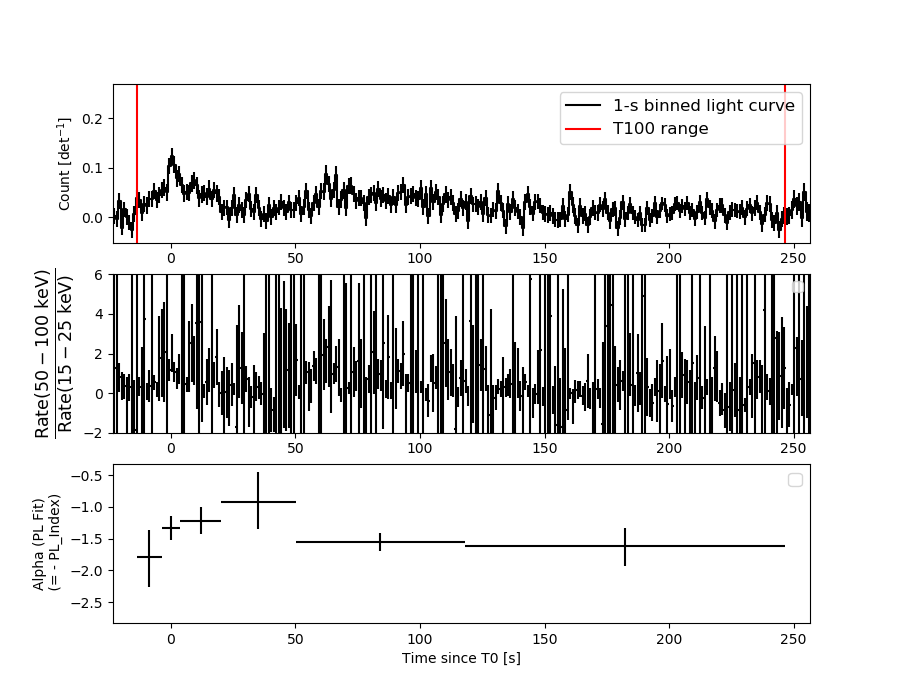
T100 260.060 -13.476 246.584
T90 215.928 -3.860 212.068
T50 96.380 13.964 110.344
Peak 1.000 0.092 1.092
====== Spectral Analysis Summary =====================================
Model : spectral model: simple power-law (PL) and cutoff power-law (CPL)
Ph_index : photon index: E^{Ph_index}
Ph_90err : 90% error of the photon index
Epeak : Epeak in keV
Epeak_90err: 90% error of Epeak
Norm : normalization at 50 keV in both the PL model and CPL model
Nomr_90err : 90% error of the normalization
chi2 : Chi-Squared
dof : degree of freedo
=== Time-averaged spectral analysis ===
(Best model with acceptable fit: N/A)
Model Ph_index Ph_90err_low Ph_90err_hi Epeak Epeak_90err_low Epeak_90err_hi Norm Nomr_90err_low Norm_90err_hi chi2 dof
PL -1.475 -0.109 0.109 - - - 1.72e-03 -1.11e-04 1.11e-04 54.860 57
CPL -0.816 -0.454 0.508 91.589 -20.330 85.175 3.65e-03 -1.45e-03 2.76e-03 48.420 56
=== 1-s peak spectral analysis ===
(Best model with acceptable fit: N/A)
Model Ph_index Ph_90err_low Ph_90err_hi Epeak Epeak_90err_low Epeak_90err_hi Norm Nomr_90err_low Norm_90err_hi chi2 dof
PL -1.131 -0.351 0.379 - - - 9.18e-03 -1.94e-03 1.91e-03 43.940 57
CPL -1.070 -6.295 1.001 859.215 N/A N/A 9.81e-03 N/A N/A 43.970 56
=== Fluence/Peak Flux Summary ===
Model Band1 Band2 Band3 Band4 Band5 Total
15-25 25-50 50-100 100-350 15-150 15-350 keV
Fluence PL 5.57e-07 1.04e-06 1.49e-06 4.56e-06 4.25e-06 7.65e-06 erg/cm2
90%_error_low -6.19e-08 -7.23e-08 -1.20e-07 -7.40e-07 -2.96e-07 -8.37e-07 erg/cm2
90%_error_hi 6.39e-08 7.20e-08 1.20e-07 8.30e-07 2.97e-07 9.08e-07 erg/cm2
Peak flux PL 2.66e-01 3.33e-01 3.04e-01 4.84e-01 1.07e+00 1.39e+00 ph/cm2/s
90%_error_low -1.07e-01 -9.07e-02 -6.69e-02 -1.94e-01 -2.36e-01 -2.89e-01 ph/cm2/s
90%_error_hi 1.23e-01 8.72e-02 6.58e-02 2.64e-01 2.37e-01 2.93e-01 ph/cm2/s
Fluence CPL 4.94e-07 1.11e-06 1.56e-06 1.92e-06 4.07e-06 5.08e-06 erg/cm2
90%_error_low -7.43e-08 -8.72e-08 -1.35e-07 -7.84e-07 -3.23e-07 -8.36e-07 erg/cm2
90%_error_hi 7.58e-08 8.92e-08 1.37e-07 1.47e-06 3.24e-07 1.46e-06 erg/cm2
Peak flux CPL 2.74e-01 3.33e-01 3.03e-01 5.01e-01 1.07e+00 1.40e+00 ph/cm2/s
90%_error_low -1.31e-01 -4.61e-02 -6.60e-02 N/A -2.40e-01 -3.09e-01 ph/cm2/s
90%_error_hi 1.14e-01 9.32e-02 7.61e-02 N/A 2.38e-01 2.56e-01 ph/cm2/s
======================================================================
Image
Pre-slew 15.0-350.0 keV image (Event data)
#   RAcent    DECcent   POSerr    Theta     Phi              Peak Cts       SNR   Name
   47.3203    35.3228   0.0104    36.2151   -25.0657         5.3449000     18.484 TRIG_01033328

Foreground time interval of the image:
-13.476 166.725 (delta_t = 180.201 [sec])
Background time interval of the image:
-239.176 -13.476 (delta_t = 225.700 [sec])
Light Curves
Note: The mask-weighted lightcurves have units of either count/det or counts/sec/det, where a det is 0.4 x 0.4 = 0.16 sq cm.
Full-time range; 1 s binning
Other quick-look light curves:
- 64 ms binning (zoomed)
- 16 ms binning (zoomed)
- 8 ms binning (zoomed)
- 2 ms binning (zoomed)
- SN=5 or 10 s binning (full-time range)
- Raw light curve
Spectra
- 64 ms binning (zoomed)
- 16 ms binning (zoomed)
- 8 ms binning (zoomed)
- 2 ms binning (zoomed)
- SN=5 or 10 s binning (full-time range)
- Raw light curve
Spectra
Notes:
- 1) The fitting includes the systematic errors.
- 2) When the burst includes telescope slew time periods, the fitting uses an average response file made from multiple 5-s response files through out the slew time plus single time preiod for the non-slew times, and weighted by the total counts in the corresponding time period using addrmf. An average response file is needed becuase a spectral fit using the pre-slew DRM will introduce some errors in both a spectral shape and a normalization if the PHA file contains a lot of the slew/post-slew time interval.
- 3) For fits to more complicated models (e.g. a power-law over a cutoff power-law), the BAT team has decided to require a chi-square improvement of more than 6 for each extra dof.
Time averaged spectrum fit using the average DRM
Power-law model
Time interval is from  -13.476 sec. to  246.584 sec.

Spectral model in power-law:
------------------------------------------------------------
Parameters  : value       lower 90%   higher 90%
Photon index: -1.47483     ( -0.10893   0.108997 )
Norm@50keV  : 1.71593E-03    ( -0.000111048   0.000110934 )
------------------------------------------------------------
#Fit statistic  : Chi-Squared                   54.86     using 59 bins.
 Reduced chi-squared = 0.962456
# Null hypothesis probability of 5.56e-01 with 57 degrees of freedom

Photon flux (15-150 keV)    in 260.1 sec: 0.212803 ( -0.01424  0.014269 ) ph/cm2/s
Energy fluence (15-150 keV)             : 4.25245e-06 ( -2.95687e-07  2.97326e-07 ) ergs/cm2
Cutoff power-law model
Time interval is from  -13.476 sec. to  246.584 sec.
Spectral model in the cutoff power-law:
------------------------------------------------------------
Parameters  : value       lower 90%   higher 90%
Photon index: -0.815625     ( -0.453595   0.507698 )
Epeak [keV] : 91.5890      ( -20.3305 85.175 )
Norm@50keV  : 3.64610E-03    ( -0.00144818   0.00276123 )
------------------------------------------------------------
#Fit statistic  : Chi-Squared                   48.42     using 59 bins.
 Reduced chi-squared = 0.864643
# Null hypothesis probability of 7.54e-01 with 56 degrees of freedom

Photon flux (15-150 keV)    in 260.1 sec: 0.206685 ( -0.014865  0.014868 ) ph/cm2/s
Energy fluence (15-150 keV)             : 4.0695e-06 ( -3.2339e-07  3.23897e-07 ) ergs/cm2
1-s peak spectrum fit
Power-law model
Time interval is from    0.092 sec. to    1.092 sec.

Spectral model in power-law:
------------------------------------------------------------
Parameters  : value       lower 90%   higher 90%
Photon index: -1.13133     ( -0.350513   0.378532 )
Norm@50keV  : 9.18302E-03    ( -0.00193783   0.00191446 )
------------------------------------------------------------
#Fit statistic  : Chi-Squared                   43.94     using 59 bins.
 Reduced chi-squared = 0.770877
# Null hypothesis probability of 8.98e-01 with 57 degrees of freedom

Photon flux (15-150 keV)    in 1 sec: 1.06864 ( -0.23561  0.23714 ) ph/cm2/s
Energy fluence (15-150 keV)             : 9.50824e-08 ( -2.02861e-08  2.0332e-08 ) ergs/cm2
Cutoff power-law model
Time interval is from    0.092 sec. to    1.092 sec.
Spectral model in the cutoff power-law:
------------------------------------------------------------
Parameters  : value       lower 90%   higher 90%
Photon index: -2.37968     ( -4.98502   2.31095 )
Epeak [keV] : 124.514      (   )
Norm@50keV  : 1.21184E-03    (     )
------------------------------------------------------------
#Fit statistic  : Chi-Squared                   43.42     using 59 bins.
 Reduced chi-squared = 0.775357
# Null hypothesis probability of 8.90e-01 with 56 degrees of freedom

Photon flux (15-150 keV)    in 1 sec: 1.07026 ( -0.239977  0.23811 ) ph/cm2/s
Energy fluence (15-150 keV)             : 9.53059e-08 ( -2.14339e-08  1.96761e-08 ) ergs/cm2
Time-resolved spectra
Distribution
T90 vs. Hardness ratio plot
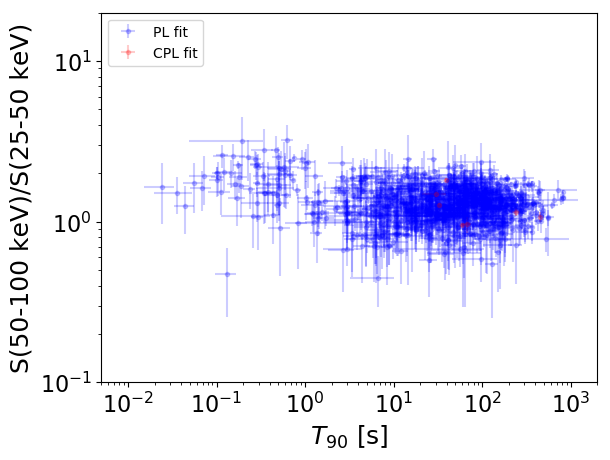
T90                                   = N/A sec.
Hardness ratio (energy fluence ratio) = N/A
S(15-50 keV) vs. S(50-150 keV) plot
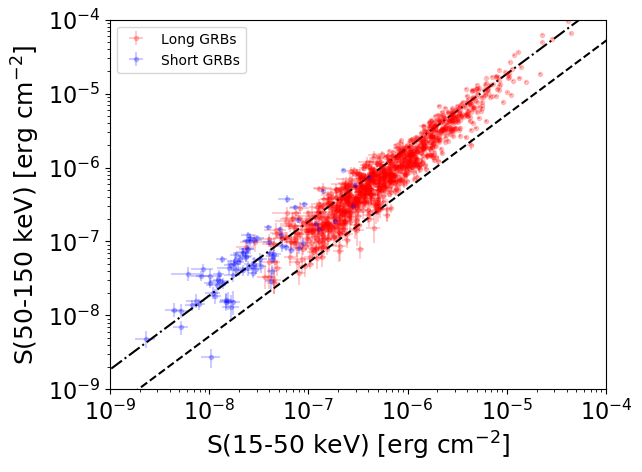
S(15-50 keV)  = N/A
S(50-150 keV) = N/A
The dash-dotted line and the dashed line traces the fluences calculated from the Band function with Epeak = 15 and 150 keV, respectively. Both lines assume a canonical values of alpha = -1 and beta = -2.5.
Mask shadow pattern
IMX = 6.633276817333866E-01, IMY = 3.102406262588234E-01
Spacecraft aspect plot
Bright source in the pre-burst/pre-slew/post-slew images
Pre-burst image of 15-350 keV band
Time interval of the image:
-239.176000 -13.476000

# RAcent  DECcent POSerr Theta    Phi  PeakCts   SNR AngSep     Name
#  [deg]    [deg]    ['] [deg]  [deg]                   [']
 83.6339  22.0300    0.3  18.4   45.9   8.9454  33.5    0.9	Crab
 93.8143  54.7820    2.6  50.5   26.5   3.8504   4.4 ------	UNKNOWN
101.6296 -33.6447    2.6  49.5  158.2   3.6921   4.4 ------	UNKNOWN
 65.4508  31.4452    2.7  25.0   -3.3   1.0889   4.3 ------	UNKNOWN
 41.8264   6.2313    2.9  30.3  -79.5   1.5687   3.9 ------	UNKNOWN
 39.3328 -29.1919    3.0  48.3 -129.9   5.1198   3.9 ------	UNKNOWN
 26.8267  21.5600    3.2  46.1  -56.3   4.3382   3.6 ------	UNKNOWN
Pre-slew background subtracted image of 15-350 keV band
Time interval of the image:
-13.476000 166.724600

# RAcent  DECcent POSerr Theta    Phi  PeakCts   SNR AngSep     Name
#  [deg]    [deg]    ['] [deg]  [deg]                   [']
 83.6648  21.8733    5.6  18.2   46.3   0.4585   2.1    8.6	Crab
 75.9552 -51.4909    2.7  58.9 -172.0   5.8761   4.3 ------	UNKNOWN
 47.3203  35.3228    0.6  36.2  -25.1   5.3447  18.5 ------	UNKNOWN
 39.5539 -21.7940    1.9  43.3 -122.3   4.4298   6.0 ------	UNKNOWN
 30.1760   8.8351    1.8  41.7  -74.2   4.8838   6.4 ------	UNKNOWN
Post-slew image of 15-350 keV band
Time interval of the image:
300.924600 962.967800

# RAcent  DECcent POSerr Theta    Phi  PeakCts   SNR AngSep     Name
#  [deg]    [deg]    ['] [deg]  [deg]                   [']
254.4606  35.3433   31.4  46.0  -12.3   0.3229   0.4    0.2	Her X-1
237.8488  25.4738    4.0  54.0    8.0   5.4884   2.9 ------	UNKNOWN
 76.7333  42.1584    4.2  56.9  177.3   7.4258   2.8 ------	UNKNOWN
242.4721  28.3270    2.9  51.5    2.5   5.0642   4.0 ------	UNKNOWN
356.8326  55.5744    2.6  43.9 -116.5  10.7066   4.5 ------	UNKNOWN
 14.2280  52.4704    3.7  48.4 -129.9   9.1380   3.2 ------	UNKNOWN