Analysis Summary
Notes:
- 1) No attempt has been made to eliminate the non-significant decimal places.
- 2) This batgrbproduct analysis is done using the HEASARC data.
- 3) This batgrbproduct analysis is using the flight position for the mask-weighting calculation.
======================================================================
BAT GRB EVENT DATA PROCESSING REPORT
Process Script Ver: batgrbproduct v2.48
Process Start Time: Sat Jul 30 00:00:09 EDT 2022
Host Name: batproc1
Current Working Dir: /local/data/bat1/alien/Swift_3rdBATcatalog/event/batevent_reproc/trigger1034325
======================================================================
Trigger: 01034325 Segment: 000
BAT Trigger Time: 635726272.832 [s; MET]
Trigger Stop: 635726274.88 [s; MET]
UTC: 2021-02-22T22:37:26.278200 [includes UTCF correction]
Where From?: TDRSS position message
BAT
RA: 154.621353612647 Dec: -14.898108406699 [deg; J2000]
Catalogged Source?: NO
Point Source?: YES
GRB Indicated?: YES [ by BAT flight software ]
Image S/N Ratio: 7.45
Image Trigger?: NO
Rate S/N Ratio: 10.3440804327886 [ if not an image trigger ]
Image S/N Ratio: 7.45
Analysis Position: [ source = BAT ]
RA: 154.621353612647 Dec: -14.898108406699 [deg; J2000]
Refined Position: [ source = BAT pre-slew burst ]
RA: 154.627414996572 Dec: -14.9384390813758 [deg; J2000]
{ 10h 18m 30.6s , -14d 56' 18.4" }
+/- 2.04138789530057 [arcmin] (estimated 90% radius based on SNR)
+/- 0.750393496882707 [arcmin] (formal 1-sigma fit error)
SNR: 10.9740672022125
Angular difference between the analysis and refined position is 2.445225 arcmin
Partial Coding Fraction: 0.3867188 [ including projection effects ]
Duration
T90: 12.1120001077652 +/- 0.907638672141884
Measured from: -9.73600006103516
to: 2.37600004673004 [s; relative to TRIGTIME]
T50: 7.27999997138977 +/- 3.82574016142967
Measured from: -5.8639999628067
to: 1.41600000858307 [s; relative to TRIGTIME]
Fluence
Peak Flux (peak 1 second)
Measured from: 0.875999927520752
to: 1.87599992752075 [s; relative to TRIGTIME]
Total Fluence
Measured from: -10.2000000476837
to: 2.69599997997284 [s; relative to TRIGTIME]
Band 1 Band 2 Band 3 Band 4
15-25 25-50 50-100 100-350 keV
Total 0.331782 0.229772 0.117324 0.028369
0.038658 0.039571 0.033468 0.029236 [error]
Peak 0.062945 0.059178 0.048730 0.022577
0.011389 0.012003 0.010294 0.008229 [error]
[ fluence units of on-axis counts / fully illuminated detector ]
======================================================================
====== Table of the duration information =============================
Value tstart tstop
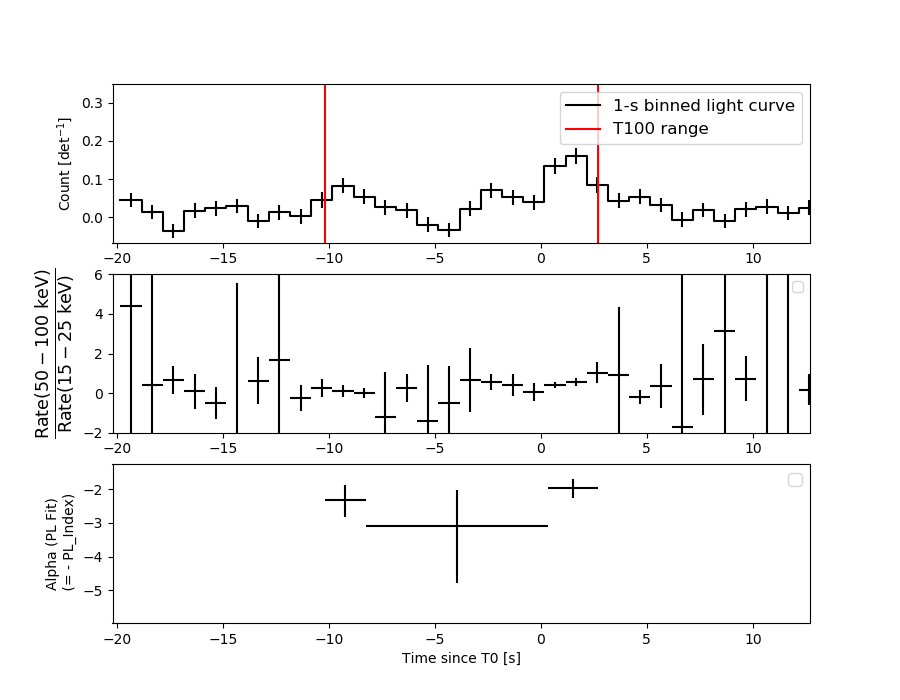
T100 12.896 -10.200 2.696
T90 12.112 -9.736 2.376
T50 7.280 -5.864 1.416
Peak 1.000 0.876 1.876
====== Spectral Analysis Summary =====================================
Model : spectral model: simple power-law (PL) and cutoff power-law (CPL)
Ph_index : photon index: E^{Ph_index}
Ph_90err : 90% error of the photon index
Epeak : Epeak in keV
Epeak_90err: 90% error of Epeak
Norm : normalization at 50 keV in both the PL model and CPL model
Nomr_90err : 90% error of the normalization
chi2 : Chi-Squared
dof : degree of freedo
=== Time-averaged spectral analysis ===
(Best model with acceptable fit: N/A)
Model Ph_index Ph_90err_low Ph_90err_hi Epeak Epeak_90err_low Epeak_90err_hi Norm Nomr_90err_low Norm_90err_hi chi2 dof
PL -2.339 -0.369 0.325 - - - 2.56e-03 -6.80e-04 6.68e-04 62.400 57
CPL -1.928 N/A N/A 6.175 N/A N/A 4.70e-03 N/A N/A 62.390 56
=== 1-s peak spectral analysis ===
(Best model with acceptable fit: N/A)
Model Ph_index Ph_90err_low Ph_90err_hi Epeak Epeak_90err_low Epeak_90err_hi Norm Nomr_90err_low Norm_90err_hi chi2 dof
PL -1.818 -0.344 0.309 - - - 1.04e-02 -2.27e-03 2.18e-03 49.620 57
CPL -1.797 -1.183 0.960 445.015 -444.744 -445.015 1.07e-02 -1.07e-02 2.12e-02 49.630 56
=== Fluence/Peak Flux Summary ===
Model Band1 Band2 Band3 Band4 Band5 Total
15-25 25-50 50-100 100-350 15-150 15-350 keV
Fluence PL 9.32e-08 1.03e-07 8.16e-08 1.07e-07 3.17e-07 3.84e-07 erg/cm2
90%_error_low -1.85e-08 -1.93e-08 -2.78e-08 -5.60e-08 -6.62e-08 -1.01e-07 erg/cm2
90%_error_hi 1.87e-08 1.87e-08 3.07e-08 8.86e-08 6.98e-08 1.26e-07 erg/cm2
Peak flux PL 5.81e-01 4.85e-01 2.75e-01 2.31e-01 1.44e+00 1.57e+00 ph/cm2/s
90%_error_low -1.61e-01 -9.35e-02 -7.61e-02 -1.04e-01 -2.79e-01 -3.01e-01 ph/cm2/s
90%_error_hi 1.71e-01 9.32e-02 7.34e-02 1.35e-01 2.79e-01 3.01e-01 ph/cm2/s
Fluence CPL 9.25e-08 1.07e-07 7.60e-08 4.47e-08 3.03e-07 3.20e-07 erg/cm2
90%_error_low -1.80e-08 -1.88e-08 -3.43e-08 -3.61e-08 -8.05e-08 -9.78e-08 erg/cm2
90%_error_hi 1.87e-08 1.83e-08 3.53e-08 1.27e-07 7.84e-08 1.71e-07 erg/cm2
Peak flux CPL 5.87e-01 4.80e-01 2.72e-01 2.46e-01 1.44e+00 1.59e+00 ph/cm2/s
90%_error_low -1.88e-01 -8.89e-02 -1.47e-01 N/A -2.87e-01 -1.82e-01 ph/cm2/s
90%_error_hi 1.79e-01 1.16e-01 9.22e-02 N/A 2.87e-01 2.88e-01 ph/cm2/s
======================================================================
Image
Pre-slew 15.0-350.0 keV image (Event data)

#   RAcent    DECcent   POSerr    Theta     Phi              Peak Cts       SNR   Name
  154.6274   -14.9384   0.0175    28.4270    82.7663         0.7991920     10.974 TRIG_01034325

Foreground time interval of the image:
-10.200   2.696 (delta_t =  12.896 [sec])
Background time interval of the image:
-239.832 -10.200 (delta_t = 229.632 [sec])
Light Curves
Note: The mask-weighted lightcurves have units of either count/det or counts/sec/det, where a det is 0.4 x 0.4 = 0.16 sq cm.
Full-time range; 1 s binning
Other quick-look light curves:
- 64 ms binning (zoomed)
- 16 ms binning (zoomed)
- 8 ms binning (zoomed)
- 2 ms binning (zoomed)
- SN=5 or 10 s binning (full-time range)
- Raw light curve
Spectra
- 64 ms binning (zoomed)
- 16 ms binning (zoomed)
- 8 ms binning (zoomed)
- 2 ms binning (zoomed)
- SN=5 or 10 s binning (full-time range)
- Raw light curve
Spectra
Notes:
- 1) The fitting includes the systematic errors.
- 2) When the burst includes telescope slew time periods, the fitting uses an average response file made from multiple 5-s response files through out the slew time plus single time preiod for the non-slew times, and weighted by the total counts in the corresponding time period using addrmf. An average response file is needed becuase a spectral fit using the pre-slew DRM will introduce some errors in both a spectral shape and a normalization if the PHA file contains a lot of the slew/post-slew time interval.
- 3) For fits to more complicated models (e.g. a power-law over a cutoff power-law), the BAT team has decided to require a chi-square improvement of more than 6 for each extra dof.
Time averaged spectrum fit using the average DRM
Power-law model
Time interval is from  -10.200 sec. to    2.696 sec.

Spectral model in power-law:
------------------------------------------------------------
Parameters  : value       lower 90%   higher 90%
Photon index: -2.33938     ( -0.369068   0.325382 )
Norm@50keV  : 2.55523E-03    ( -0.000679985   0.000668126 )
------------------------------------------------------------
#Fit statistic  : Chi-Squared                   62.40     using 59 bins.
 Reduced chi-squared = 1.09474
# Null hypothesis probability of 2.90e-01 with 57 degrees of freedom

Photon flux (15-150 keV)    in 12.9 sec: 0.456596 ( -0.074262  0.074287 ) ph/cm2/s
Energy fluence (15-150 keV)             : 3.1746e-07 ( -6.61905e-08  6.97529e-08 ) ergs/cm2
Cutoff power-law model
Time interval is from  -10.200 sec. to    2.696 sec.
Spectral model in the cutoff power-law:
------------------------------------------------------------
Parameters  : value       lower 90%   higher 90%
Photon index: -1.92834     (       )
Epeak [keV] : 6.17492      (   )
Norm@50keV  : 4.69641E-03    (     )
------------------------------------------------------------
#Fit statistic  : Chi-Squared                   62.39     using 59 bins.
 Reduced chi-squared = 1.11411
# Null hypothesis probability of 2.60e-01 with 56 degrees of freedom

Photon flux (15-150 keV)    in 12.9 sec: 0.451353 ( -0.073159  0.074184 ) ph/cm2/s
Energy fluence (15-150 keV)             : 3.02684e-07 ( -8.05377e-08  7.84339e-08 ) ergs/cm2
1-s peak spectrum fit
Power-law model

Time interval is from    0.876 sec. to    1.876 sec.

Spectral model in power-law:
------------------------------------------------------------
Parameters  : value       lower 90%   higher 90%
Photon index: -1.81818     ( -0.34353   0.308686 )
Norm@50keV  : 1.03943E-02    ( -0.0022689   0.00217555 )
------------------------------------------------------------
#Fit statistic  : Chi-Squared                   49.62     using 59 bins.
 Reduced chi-squared = 0.870526
# Null hypothesis probability of 7.45e-01 with 57 degrees of freedom

Photon flux (15-150 keV)    in 1 sec: 1.44261 ( -0.27868  0.27878 ) ph/cm2/s
Energy fluence (15-150 keV)             : 9.56533e-08 ( -2.06518e-08  2.06923e-08 ) ergs/cm2
Cutoff power-law model
Time interval is from    0.876 sec. to    1.876 sec.
Spectral model in the cutoff power-law:
------------------------------------------------------------
Parameters  : value       lower 90%   higher 90%
Photon index: -1.79698     ( -1.17392   0.968717 )
Epeak [keV] : 445.015      ( -9965.78 -9966.05 )
Norm@50keV  : 1.06565E-02    ( -0.0104123   0.0214687 )
------------------------------------------------------------
#Fit statistic  : Chi-Squared                   49.63     using 59 bins.
 Reduced chi-squared = 0.88625
# Null hypothesis probability of 7.13e-01 with 56 degrees of freedom

Photon flux (15-150 keV)    in 1 sec: 1.44336 ( -0.28694  0.28717 ) ph/cm2/s
Energy fluence (15-150 keV)             : 9.56974e-08 ( -2.1416e-08  2.13953e-08 ) ergs/cm2
Time-resolved spectra
Distribution
T90 vs. Hardness ratio plot
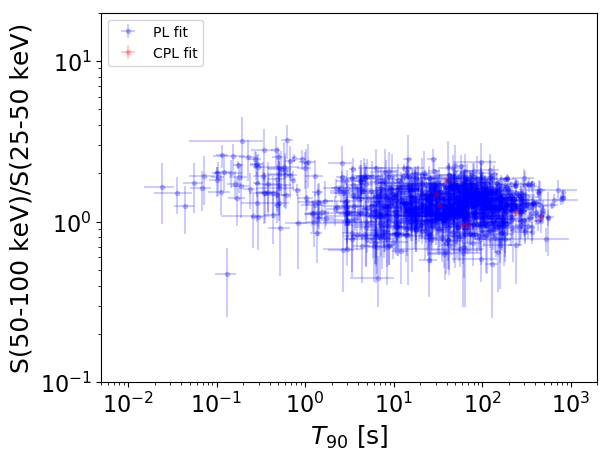
T90                                   = N/A sec.
Hardness ratio (energy fluence ratio) = N/A
S(15-50 keV) vs. S(50-150 keV) plot
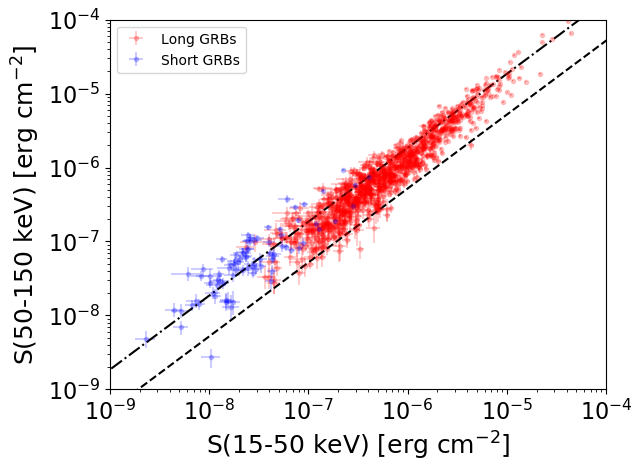
S(15-50 keV)  = N/A
S(50-150 keV) = N/A
The dash-dotted line and the dashed line traces the fluences calculated from the Band function with Epeak = 15 and 150 keV, respectively. Both lines assume a canonical values of alpha = -1 and beta = -2.5.
Mask shadow pattern
IMX = 6.815979628195033E-02, IMY = -5.369977684412671E-01
Spacecraft aspect plot
Bright source in the pre-burst/pre-slew/post-slew images
Pre-burst image of 15-350 keV band
Time interval of the image:
-239.832000 -10.200000

# RAcent  DECcent POSerr Theta    Phi  PeakCts   SNR AngSep     Name
#  [deg]    [deg]    ['] [deg]  [deg]                   [']
135.6139 -40.7037    8.8  21.0    6.2   0.2997   1.3    9.7	Vela X-1
169.9511 -60.5195    0.0  18.6  -88.1   0.0540   0.2   12.4	Cen X-3
186.8599 -62.7650    2.6  24.6 -104.1   1.3805   4.4    5.6	GX 301-2
144.2355  -5.5229    2.7  40.6   70.8   4.0550   4.3 ------	UNKNOWN
170.0335 -19.1908    3.5  23.7  116.5   1.0837   3.3 ------	UNKNOWN
100.5944 -22.5348    3.3  55.5   11.3   4.5297   3.5 ------	UNKNOWN
222.5396 -13.3869    3.0  58.1 -179.9   5.8104   3.9 ------	UNKNOWN
 93.1642 -42.8926    3.4  50.3  -14.7   2.0290   3.4 ------	UNKNOWN
230.2481 -23.1454    2.9  57.6 -165.5   4.6417   4.1 ------	UNKNOWN
Pre-slew background subtracted image of 15-350 keV band
Time interval of the image:
-10.200000 2.696000

# RAcent  DECcent POSerr Theta    Phi  PeakCts   SNR AngSep     Name
#  [deg]    [deg]    ['] [deg]  [deg]                   [']
135.7367 -40.5038    5.5  21.0    6.8  -0.1001  -2.1   10.0	Vela X-1
170.6102 -60.6985    4.0  18.9  -89.0   0.1475   2.9    9.8	Cen X-3
187.0709 -62.8294    0.0  24.7 -104.2  -0.0600  -1.1   11.9	GX 301-2
154.6274 -14.9385    1.0  28.4   82.8   0.7994  11.0 ------	UNKNOWN
Post-slew image of 15-350 keV band
Time interval of the image:
80.068590 962.293300
1059.168000 1149.328000

# RAcent  DECcent POSerr Theta    Phi  PeakCts   SNR AngSep     Name
#  [deg]    [deg]    ['] [deg]  [deg]                   [']
135.3443 -40.5831    7.9  30.7  -64.5  -1.6382  -1.5    8.6	Vela X-1
122.8172  15.2977    3.8  43.6   38.5   6.8414   3.1 ------	UNKNOWN
145.5522   4.4665    2.9  21.4   60.5   3.4056   4.0 ------	UNKNOWN
211.9411  -6.3388    3.0  56.8  173.9  14.6186   3.9 ------	UNKNOWN
212.6059  -9.0873    2.8  56.9  177.2  14.7126   4.1 ------	UNKNOWN
120.9337 -31.5239    3.0  34.9  -38.3   4.3163   3.9 ------	UNKNOWN
 92.2733 -19.2772    4.4  59.5  -17.8  10.3457   2.6 ------	UNKNOWN
213.3758 -31.8666    3.2  55.8 -155.3  12.3759   3.6 ------	UNKNOWN
208.3947 -37.1292    3.3  52.4 -148.3   8.8828   3.5 ------	UNKNOWN
127.9125 -48.2265    3.1  39.9  -66.1   7.3219   3.8 ------	UNKNOWN
114.5114 -46.8752    3.0  46.1  -56.3  12.1611   3.9 ------	UNKNOWN